. 2013 Sep 2:7:520.
doi: 10.3389/fnhum.2013.00520. eCollection 2013.

Decreased small-world functional network connectivity and clustering across resting state networks in schizophrenia: an fMRI classification tutorial

Affiliations

Decreased small-world functional network connectivity and clustering across resting state networks in schizophrenia: an fMRI classification tutorial

Ariana Anderson et al. Front Hum Neurosci. .

Abstract

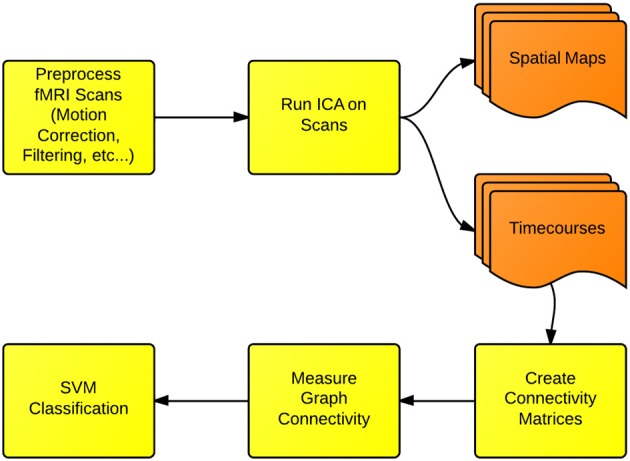
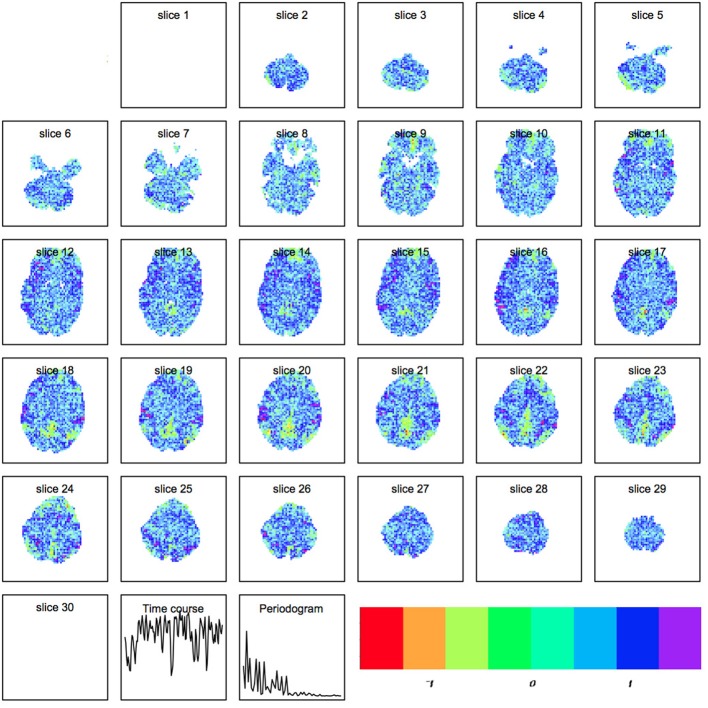
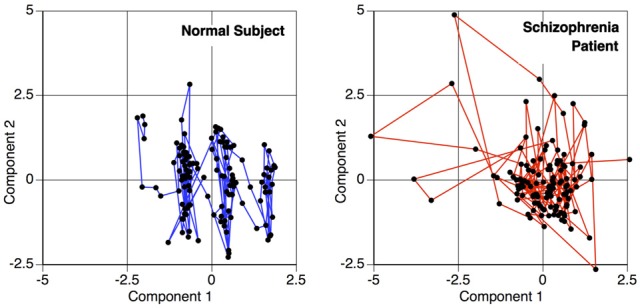
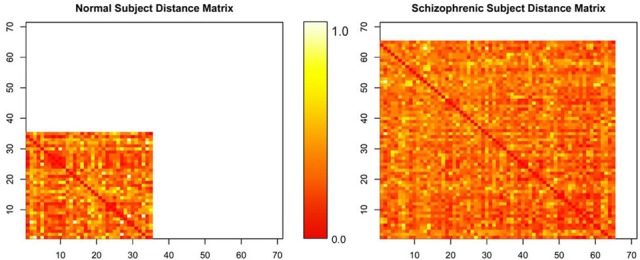
Functional network connectivity (FNC) is a method of analyzing the temporal relationship of anatomical brain components, comparing the synchronicity between patient groups or conditions. We use functional-connectivity measures between independent components to classify between Schizophrenia patients and healthy controls during resting-state. Connectivity is measured using a variety of graph-theoretic connectivity measures such as graph density, average path length, and small-worldness. The Schizophrenia patients showed significantly less clustering (transitivity) among components than healthy controls (p < 0.05, corrected) with networks less likely to be connected, and also showed lower small-world connectivity than healthy controls. Using only these connectivity measures, an SVM classifier (without parameter tuning) could discriminate between Schizophrenia patients and healthy controls with 65% accuracy, compared to 51% chance. This implies that the global functional connectivity between resting-state networks is altered in Schizophrenia, with networks more likely to be disconnected and behave dissimilarly for diseased patients. We present this research finding as a tutorial using the publicly available COBRE dataset of 146 Schizophrenia patients and healthy controls, provided as part of the 1000 Functional Connectomes Project. We demonstrate preprocessing, using independent component analysis (ICA) to nominate networks, computing graph-theoretic connectivity measures, and finally using these connectivity measures to either classify between patient groups or assess between-group differences using formal hypothesis testing. All necessary code is provided for both running command-line FSL preprocessing, and for computing all statistical measures and SVM classification within R. Collectively, this work presents not just findings of diminished FNC among resting-state networks in Schizophrenia, but also a practical connectivity tutorial.

Keywords: R; SVM; Schizophrenia; classification; fMRI; functional network connectivity; independent component analysis; small-world.


Figures

Figure 1
Figure 1
Functional network connectivity (FNC) and classification: the first step in FNC is to define the scale of connectivity to observe. In this case, we use whole-brain networks obtained from ICA, but this analysis also can be implemented on the region-of-interest or the voxel scale. The connectivity is defined and measured to identify differences between either groups or conditions.
Figure 2
Figure 2
Spatial map produced by independent components analysis within R. Each component is a set of spatially weighted regions modulated by the time course. The total longitudinal contribution of a component to the activity observed is the spatial map multiplied by the timecourse.
Figure 3
Figure 3
Temporal activity plot of two primary components within a subject, depicting the relationship between two components over time. This phase space transition between pairs of components are measured for the functional connectivity analysis, to calculate the similarity of the components' behavior.
Figure 4
Figure 4
Normalized distance matrices of two subjects, where rows and columns correspond to components within a subject and the intensity represents the functional connectivity between those components.
Figure 5
Figure 5
Geodesic distance calculation. The distance between A and C is calculated as the manifold path distance from A to B to C, instead of the direct path from A to C. This eliminates the assumption that the points occupy a linear space when using a Euclidean distance.
Figure 6
Figure 6
Graphs representing connectivity of two subjects, obtained by converting the distance matrices for each subject into a structure where each node represents a component, and the distance between nodes represents the connectivity or similarity of their behaviors. Nodes close together demonstrate a higher functional connectivity measure. This map is obtained by recalculating the connectivity matrices using geodesic distances, and then embedding the points in a two dimensional space for plotting. Dim 1 and Dim 2 represent the weightings on the two primary dimensions, similar to multi-dimensional scaling.
Figure 7
Figure 7
Spatial map produced by independent components analysis in FSL.

Similar articles

Cited by

References

    1. Achard S., Salvador R., Whitcher B., Suckling J., Bullmore E. (2006). A resilient, low-frequency, small-world human brain functional network with highly connected association cortical hubs. J. Neurosci. 26, 63–72 10.1523/JNEUROSCI.3874-05.2006 - DOI - PMC - PubMed
    1. Allen E. A., Erhardt E. B., Damaraju E., Gruner W., Segall J. M., Silva R. F., et al. (2011). A baseline for the multivariate comparison of resting-state networks. Front. Syst. Neurosci. 5:2 10.3389/fnsys.2011.00002 - DOI - PMC - PubMed
    1. Anderson A., Bramen J., Douglas P. K., Lenartowicz A., Cho A., Culbertson C., et al. (2011). Large sample group independent component analysis of functional magnetic resonance imaging using anatomical atlas-based reduction and bootstrapped clustering. Int. J. Imaging Syst. Technol. 21, 223–231 10.1002/ima.20286 - DOI - PMC - PubMed
    1. Anderson A., Dinov I. D., Sherin J. E., Quintana J., Yuille A., Cohen M. S. (2010). Classification of spatially unaligned fMRI scans. Neuroimage 49, 2501–2519 10.1016/j.neuroimage.2009.08.036 - DOI - PMC - PubMed
    1. Bassett D. S., Bullmore E., Verchinski B. A., Mattay V. S., Weinberger D. R., Meyer-Lindenberg A. (2008). Hierarchical organization of human cortical networks in health and schizophrenia. J. Neurosci. 28, 9239–9248 10.1523/JNEUROSCI.1929-08.2008 - DOI - PMC - PubMed