

Plasticity and modular control of locomotor patterns in neurological disorders with motor deficits
- PMID: 24032016
- PMCID: PMC3768123
- DOI: 10.3389/fncom.2013.00123
Plasticity and modular control of locomotor patterns in neurological disorders with motor deficits
Abstract
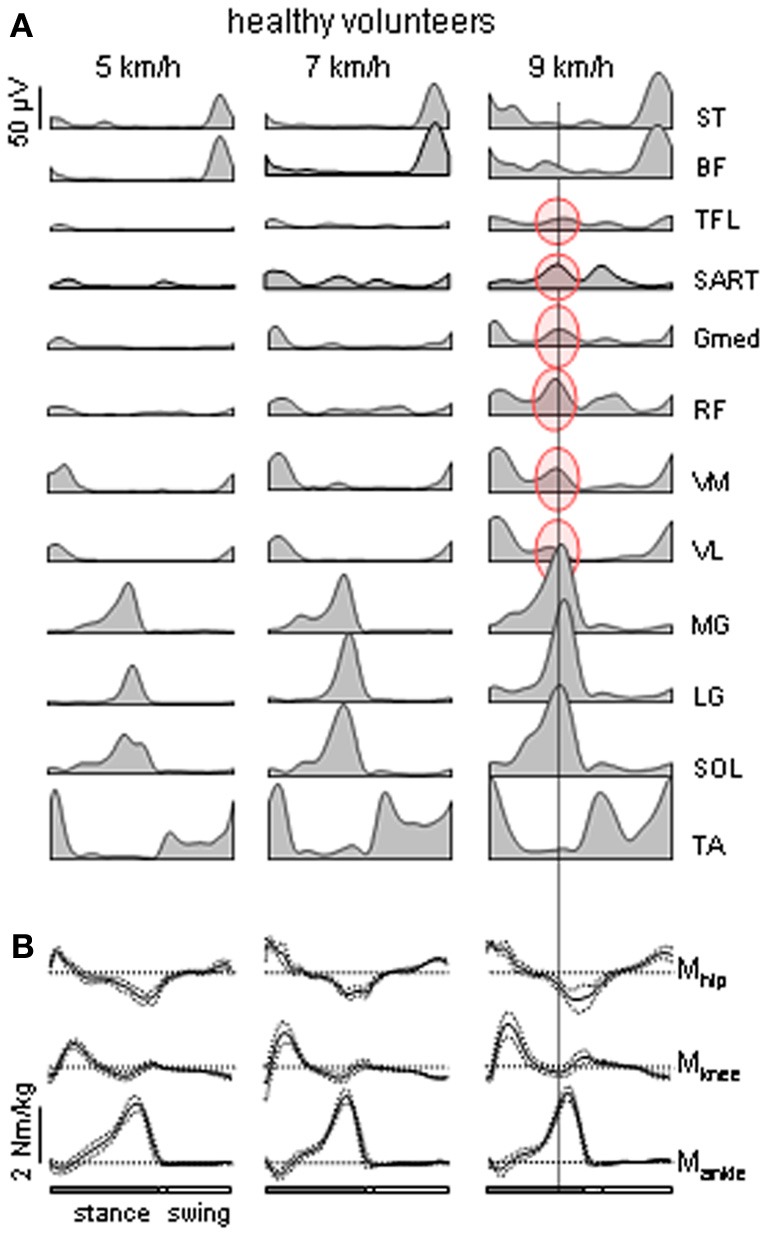
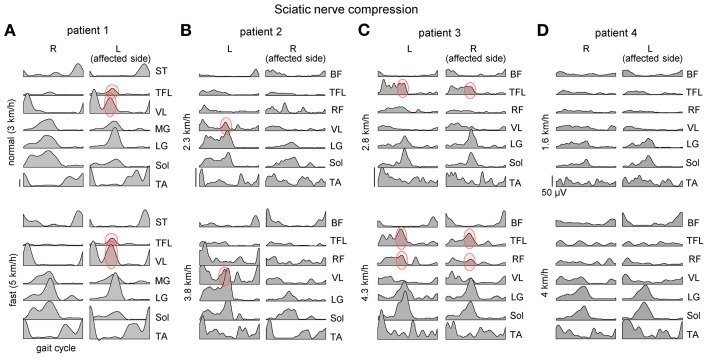
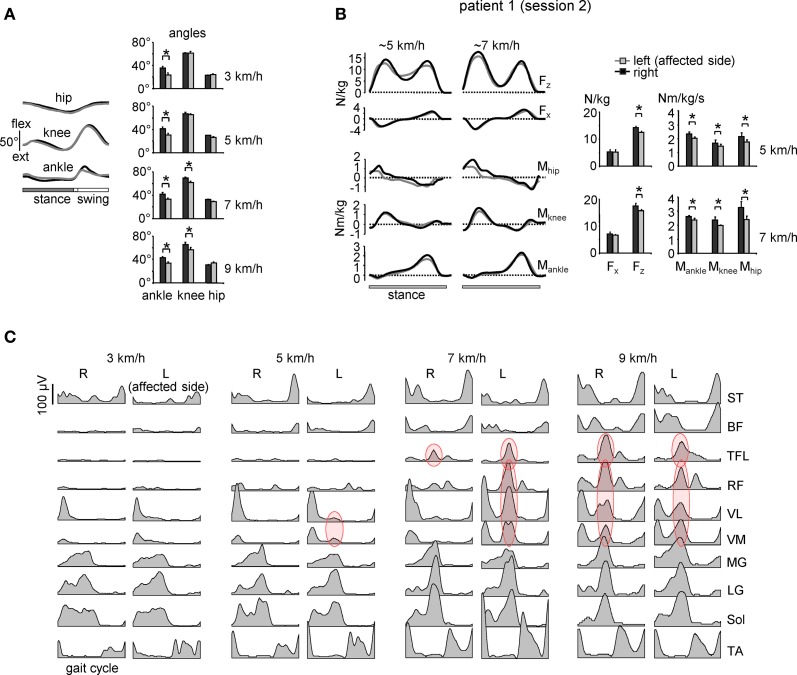
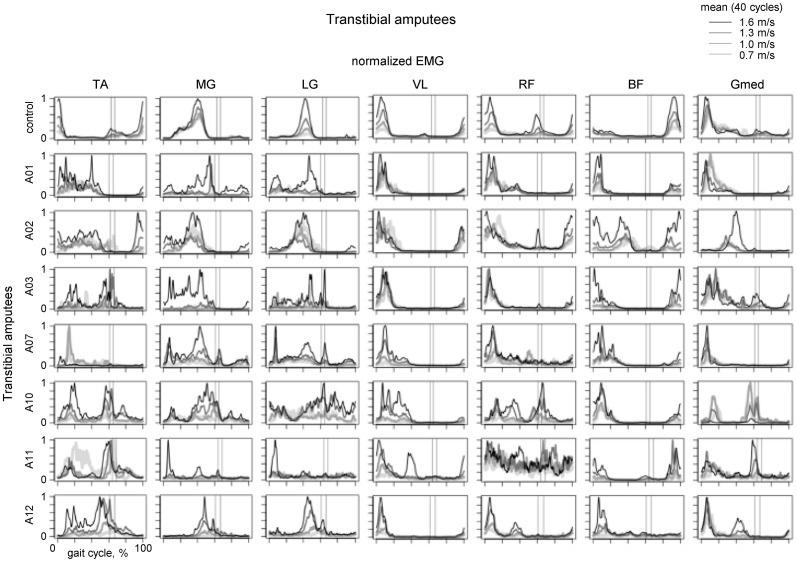
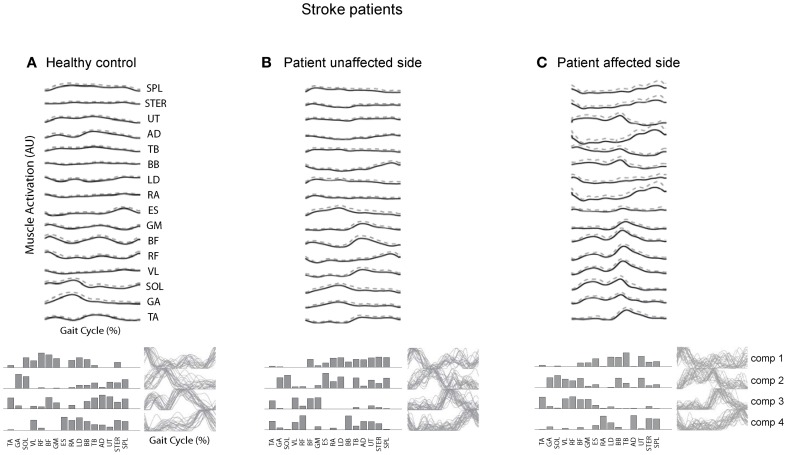
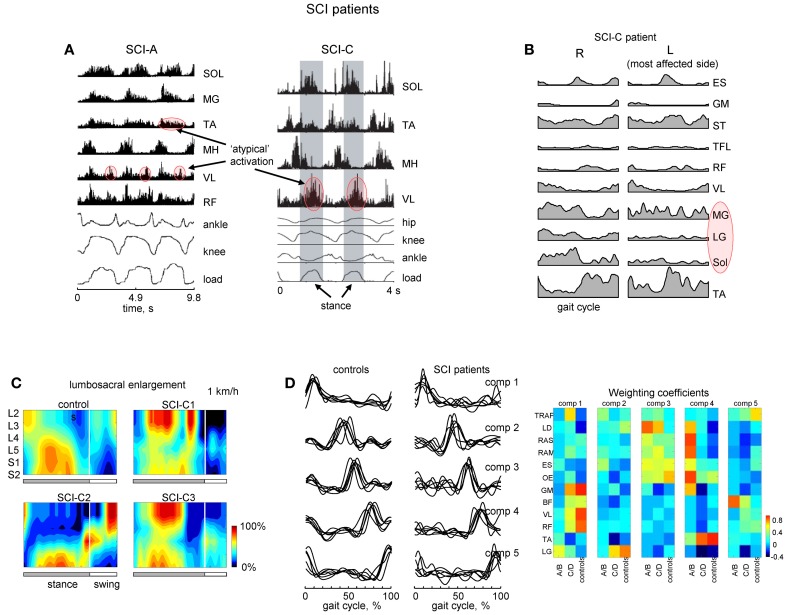
Human locomotor movements exhibit considerable variability and are highly complex in terms of both neural activation and biomechanical output. The building blocks with which the central nervous system constructs these motor patterns can be preserved in patients with various sensory-motor disorders. In particular, several studies highlighted a modular burst-like organization of the muscle activity. Here we review and discuss this issue with a particular emphasis on the various examples of adaptation of locomotor patterns in patients (with large fiber neuropathy, amputees, stroke and spinal cord injury). The results highlight plasticity and different solutions to reorganize muscle patterns in both peripheral and central nervous system lesions. The findings are discussed in a general context of compensatory gait mechanisms, spatiotemporal architecture and modularity of the locomotor program.
Keywords: EMG activity; compensation; locomotor pattern generation; modularity; plantarflexor weakness; spinal cord injury; stroke.
Figures
Similar articles
-
Modularity underlying the performance of unusual locomotor tasks inspired by developmental milestones.J Neurophysiol. 2020 Feb 1;123(2):496-510. doi: 10.1152/jn.00662.2019. Epub 2019 Dec 11. J Neurophysiol. 2020. PMID: 31825715
-
Distributed neural networks for controlling human locomotion: lessons from normal and SCI subjects.Brain Res Bull. 2009 Jan 15;78(1):13-21. doi: 10.1016/j.brainresbull.2008.03.018. Epub 2008 Apr 23. Brain Res Bull. 2009. PMID: 19070781 Review.
-
Distributed plasticity of locomotor pattern generators in spinal cord injured patients.Brain. 2004 May;127(Pt 5):1019-34. doi: 10.1093/brain/awh115. Epub 2004 Feb 26. Brain. 2004. PMID: 14988161
-
The physiological basis of neurorehabilitation--locomotor training after spinal cord injury.J Neuroeng Rehabil. 2013 Jan 21;10:5. doi: 10.1186/1743-0003-10-5. J Neuroeng Rehabil. 2013. PMID: 23336934 Free PMC article. Review.
-
Elimination of Left-Right Reciprocal Coupling in the Adult Lamprey Spinal Cord Abolishes the Generation of Locomotor Activity.Front Neural Circuits. 2017 Nov 24;11:89. doi: 10.3389/fncir.2017.00089. eCollection 2017. Front Neural Circuits. 2017. PMID: 29225569 Free PMC article.
Cited by
-
Update on an Observational, Clinically Useful Gait Coordination Measure: The Gait Assessment and Intervention Tool (G.A.I.T.).Brain Sci. 2022 Aug 19;12(8):1104. doi: 10.3390/brainsci12081104. Brain Sci. 2022. PMID: 36009168 Free PMC article.
-
Spinal motor outputs during step-to-step transitions of diverse human gaits.Front Hum Neurosci. 2014 May 15;8:305. doi: 10.3389/fnhum.2014.00305. eCollection 2014. Front Hum Neurosci. 2014. PMID: 24860484 Free PMC article.
-
Curved Walking Rehabilitation with a Rotating Treadmill in Patients with Parkinson's Disease: A Proof of Concept.Front Neurol. 2017 Feb 28;8:53. doi: 10.3389/fneur.2017.00053. eCollection 2017. Front Neurol. 2017. PMID: 28293213 Free PMC article.
-
Evaluation of Spatiotemporal Patterns of the Spinal Muscle Coordination Output during Walking in the Exoskeleton.Sensors (Basel). 2022 Jul 30;22(15):5708. doi: 10.3390/s22155708. Sensors (Basel). 2022. PMID: 35957264 Free PMC article.
-
Differential activation of lumbar and sacral motor pools during walking at different speeds and slopes.J Neurophysiol. 2019 Aug 1;122(2):872-887. doi: 10.1152/jn.00167.2019. Epub 2019 Jul 10. J Neurophysiol. 2019. PMID: 31291150 Free PMC article.
References
-
- Belanger M., Drew T., Provencher J., Rossignol S. (1996). A comparison of treadmill locomotion in adult cats before and after spinal transection. J. Neurophysiol. 76, 471–491 - PubMed
Publication types
LinkOut - more resources
Full Text Sources
Other Literature Sources