. 2013 Oct;46(5):538-53.
doi: 10.1111/cpr.12059. Epub 2013 Aug 23.

Combined γ-tocotrienol and Met inhibitor treatment suppresses mammary cancer cell proliferation, epithelial-to-mesenchymal transition and migration

Affiliations

Combined γ-tocotrienol and Met inhibitor treatment suppresses mammary cancer cell proliferation, epithelial-to-mesenchymal transition and migration

N M Ayoub et al. Cell Prolif. 2013 Oct.

Abstract

Objectives: Dysregulation of Met signalling is associated with malignant transformation. Combined treatment has been shown to reduce Met activation and mammary tumour cell proliferation. Experiments here, were conducted to determine mechanisms involved in mediating anti-cancer effects of combined γ-tocotrienol and SU11274 (Met inhibitor) treatment in various mammary cancer cell lines.

Materials and methods: Treatment effects on mouse (+SA) and human (MCF-7, and MDA-MB-231) mammary cancer cell lines, and normal mouse (CL-S1) and human (MCF10A) mammary epithelial cell lines were compared. Cell proliferation and survival were determined by MTT assay and Ki-67 staining; protein expression was determined by western blot analysis. Immunofluorescence staining was also used to characterize expression and localization of multiple epithelial and mesenchymal markers. Cell migration was determined using a wound-healing assay.

Results: Combined treatment with γ-tocotrienol and SU11274 resulted in synergistic inhibition of +SA, MCF-7, and MDA-MB-231, but not CL-S1 or MCF10A cell growth that was associated with reduction in Akt STAT1/5 and NFκB activation and corresponding blockade in epithelial-to-mesenchymal transition, as indicated by increased expression of E-cadherin, β-catenin, and cytokeratins 8/18 (epithelial markers) and corresponding reduction in vimentin (mesenchymal marker) and reduction in cancer cell motility.

Conclusions: Suggest that combined γ-tocotrienol and Met inhibitor treatment may provide benefit in treatment of breast cancers characterized by aberrant Met activity.


Figures

Figure 1
Figure 1
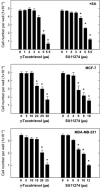
+SA mouse mammary tumour cells were initially plated at 5 × 10 4  cells/well (6 replicates/group) in 24‐well plates and maintained on defined serum‐free media containing 10 ng/ml hepatocyte growth factor. MCF‐7 and MDA‐MB‐231 human mammary cancer cells were initially plated at 1 × 104 cells/well in 96‐well plates and maintained on DMEM/F‐12 media containing 10% fetal bovine serum. Next day, all cells were divided into different treatment groups and exposed to various doses of γ‐tocotrienol or SU11274 throughout a 3‐day culture period. At the end of treatment, viable cell number was determined by the MTT colorimetric assay. Each bar indicates mean number of cells/well ± SEM in each treatment group from a given experiment. Each experiment was repeated three times. *< 0.05 compared with respective vehicle‐treated control group.
Figure 2
Figure 2
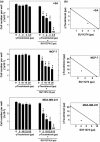
(a) +SA mouse mammary tumour cells were initially plated at 5 × 10 4  cells/well (6 replicates/group) in 24‐well plates and maintained on defined serum‐free media containing 10 ng/ml hepatocyte growth factor. MCF‐7 and MDA‐MB‐231 human mammary cancer cells were initially plated at 1 × 104 cells/well in 96‐well plates and maintained on DMEM/F‐12 media containing 10% fetal bovine serum. Next day, all cells were divided into different treatment groups and exposed to various doses of γ‐tocotrienol and/or SU11274 throughout a 3‐day culture period. At the end of the treatment, viable cell number was determined by the MTT colorimetric assay. Each experiment was repeated three times. *< 0.05 compared with respective vehicle‐treated control group. (b) Isobolograms of γ‐tocotrienol and SU11274 anti‐proliferative effects on multiple mammary cancer cell lines. IC50 concentrations (dose that induced a 50% inhibition of cell growth following a 3‐day culture period) for γ‐tocotrienol and SU11274 were plotted on the y and x axis, respectively. The solid line connecting these points represents the concentration of each compound required to induce the same relative growth inhibition when used in combination if the interaction between the compounds is additive. The data point on each isobologram represents the actual doses of γ‐tocotrienol and SU11274, which, when used in combination, result in 50% inhibition of mammary cancer cell growth over a period of 3 days in culture. The isobolograms of the three different mammary cancer cell lines show data points to be positioned below the line, indicating a strong synergistic anti‐proliferative effect for the various combinations of γ‐tocotrienol and SU11274 used.
Figure 3
Figure 3
(a) Anti‐proliferative effects of γ‐tocotrienol and/or SU11274 on the growth of immortalized normal CL‐S1 (mouse) and MCF10A (human) mammary epithelial cells. CL‐S1 cells were initially plated at 1 × 104 cells/well (6 replicates/group) in 96‐well culture plates and exposed to treatment media containing 10% bovine calf serum, while MCF10A cells were initially plated at 1 × 104 cells/well (6 replicates/group) in 96‐well culture plates and exposed to treatment in media containing 5% horse serum for a period of 3 days. (b) Effects of combined treatment of a subeffective dose of SU11274 with a range of subeffective doses of γ‐tocotrienol on the growth of CL‐S1 and MCF10A cells. All cells were initially plated at 1 × 104 cells/well (6 replicates/group) and exposed to various treatments for a 3‐day culture period. Thereafter, viable cell number was determined by the MTT colorimetric assay. Each bar indicates the mean number of cells ± SEM in each treatment group. Each experiment was repeated at least three times. *< 0.05 as compared with their respective vehicle‐treated control group.
Figure 4
Figure 4
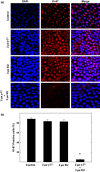
(a) +SA cells were plated on 4‐chamber culture slides at 1 × 10 5  cells/chamber (3 replicates/group) and allowed to attach in complete growth media supplemented with 10% bovine calf serum overnight. Cells were then washed in phosphate‐buffered saline and incubated in defined serum‐free media containing 10 ng/ml HGF as a mitogen and 0–2 μm γ‐tocotrienol (γT3) and/or 0–3 μm SU11274 (SU) for a 3‐day culture period. Thereafter, cells were fixed in 4% formaldehyde/PBS and permeabilized with 0.2% triton X‐100. Fixed cells were then blocked and incubated in specific primary antibody for Ki‐67 followed by incubation with Alexa Fluor 594‐conjugated secondary antibody as described in the Materials and methods section. Red colour in the photomicrographs indicates positive fluorescence staining for Ki‐67, while the blue represents counterstaining of cell nuclei, with DAPI. Magnification of each image is 200×. (b) Percentage of +SA cells displaying positive Ki‐67 staining in proportion to total number of cells in each treatment group. Vertical bars represent per cent positive Ki‐67 staining ± SEM in each treatment group. *< 0.05 compared to vehicle‐treated control group. Cells were counted manually in five photomicrographs selected randomly in each chamber for each treatment group. This experiment was repeated at least three times.
Figure 5
Figure 5
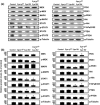
(a) +SA mammary tumour cells were plated at 1 × 10 6  cells/100‐mm culture dish. Cells were then incubated in serum‐free defined media containing 10 ng/ml HGF as a mitogen and 0–2 μm γ‐tocotrienol (γT3) and/or 0–3 μm SU11274 (SU) for a 3‐day culture period. Thereafter, cells were isolated with trypsin and whole cell lysates were prepared and then subjected to polyacrylamide gel electrophoresis and western blot analysis for total MEK, p‐MEK, MAPK, p‐MAPK, STAT1, p‐STAT1, STAT5, p‐STAT5, PI3K, PDK1, p‐PDK1, Akt, p‐Akt, p‐NFκB105, PTEN and p‐PTEN (Ser380/Thr382/383) levels. α‐tubulin was visualized to ensure equal sample loading in each lane. Each western blot is a representative image of the data obtained for experiments that were repeated at least three times. (b) Scanning densitometric analysis was performed for each blot to visualize the relative levels of proteins. Integrated optical density of each band was normalized with their corresponding α‐tubulin and control treatment bands and then shown in bar graphs. Vertical bars indicate the fold‐change in protein levels in various treatment groups ± SEM as compared with their respective vehicle‐treated control group. *< 0.05 compared to their respective vehicle‐treated control group.
Figure 6
Figure 6
(a) Photomicrographs of γ‐tocotrienol (γT 3 ) and SU11274 ( SU ) treatment effects on +SA and MDA‐MB‐231 mammary tumour cell migration in response to hepatocyte growth factor stimulation using the in vitro wound‐healing assay. Cells in each treatment group were plated in sterile flat‐bottom 24‐well plates (6 replicates/group) and allowed to form a subconfluent cell monolayer overnight. Wounds were then scratched in each cell monolayer using a sterile 200 μl pipette tip. Medium was then removed, cells were washed and then exposed to their respective treatments for a 24‐h culture period. Photomicrographs (100× magnification) were taken at the beginning and end of the treatment period. (b) Quantitative analysis of wound closure in each treatment group was calculated relative to wound distance at time 0. Vertical bar represents per cent migration ± SEM. Each experiment was performed in triplicate and the distance migrated was calculated in three or more randomly selected fields per treatment group. *< 0.05 compared to their respective vehicle‐treated control group. #< 0.05 compared to γ‐tocotrienol or SU11274 treatment alone.
Figure 7
Figure 7
(a) Western blot analysis of treatment effect of γ‐tocotrienol (γT 3 ) and/or SU11274 ( SU ) on expression of major epithelial and mesenchymal cell markers in +SA mammary tumour cells. +SA cells were plated at 1 × 106 cells/100 mm culture dish. Cells were then incubated with control or treatment media containing subeffective doses of γ‐tocotrienol (2 μm) and SU11274 (3 μm) either alone or in combination containing 10 ng/ml HGF as a mitogen for a 3‐day culture period. Following treatment exposure, whole cell lysates were prepared and then subjected to polyacrylamide gel electrophoresis and western blot analysis for E‐cadherin, β‐catenin, cytokeratin‐8, cytokeratin‐18 and vimentin. α‐tubulin was visualized to ensure equal sample loading in each lane. Each western blot is a representative image of the data obtained for experiments that were repeated at least three times. Scanning densitometric analysis was performed for each blot to visualize the relative levels of proteins. Integrated optical density of each band was normalized with their corresponding α‐tubulin and control treatment bands and then shown in bar graphs. Vertical bars indicate the fold‐change in protein levels in various treatment groups ± SEM as compared with their respective vehicle‐treated control group. *< 0.05 as compared with their respective vehicle‐treated control group. (b) Immunocytochemical fluorescence staining of epithelial and mesenchymal markers in +SA mammary tumour cells treated with γ‐tocotrienol and/or SU11274 after a 3‐day culture period. +SA cells were seeded on 4‐chamber culture slides 1 × 105 cells/chamber (3 replicates/group) and allowed to attach in complete growth media supplemented with 10% BCS overnight. Cells were then washed with phosphate‐buffered saline and incubated with vehicle control or treatment defined media containing 10 ng/ml HGF for 3 days in culture. At the end of treatments, cells were fixed with 4% formaldehyde/PBS and permeabilized with 0.2% triton X‐100. Fixed cells were blocked and incubated with specific primary antibodies for E‐cadherin, β‐catenin, cytokeratin‐8, cytokeratin‐18 and vimentin followed by incubation with Alexa Fluor 594‐ or 488‐conjugated secondary antibodies as described in the Materials and methods section. In the confocal images, the red or green colour indicates the positive fluorescence staining for target proteins and the blue colour represents counter staining of the +SA cell nuclei DAPI. Magnification of each image is 200×.
Figure 8
Figure 8
Schematic representation of inhibitory effects of γ‐tocotrienol and SU11274 on Met signalling. The Met receptor has an extracellular α‐chain that binds HGF and a transmembrane β‐chain that contains the tyrosine kinase domain and autophosphorylation sites that are essential for interacting with substrates. Activation of Met by hepatocyte growth factor leads to receptor dimerization and recruitment of adaptor (GAB1, Grb2, Shc) and signalling (Ras/MAPK, PI3K/Akt, Src, STAT, Shp2) proteins. Downstream signalling promotes cell proliferation, altered cytoskeletal function, decreased cellular adhesion, increased cellular invasion, decreased apoptosis and enhanced DNA transcription. Combined treatment with γ‐tocotrienol and SU11274 significantly reduces Met levels and activation (autophosphorylation) that ultimately result in significant inhibition of various downstream signalling pathways involved with tumour cell proliferation, motility, viability, morphology and epithelial‐to‐mesenchymal transition.

References

    1. Gastaldi S, Comoglio PM, Trusolino L (2010) The Met oncogene and basal‐like breast cancer: another culprit to watch out for? Breast Cancer Res. 12, 208. - PMC - PubMed
    1. Andrechek ER, Muller WJ (2000) Tyrosine kinase signalling in breast cancer: tyrosine kinase‐mediated signal transduction in transgenic mouse models of human breast cancer. Breast Cancer Res. 2, 211–216. - PMC - PubMed
    1. Hynes NE (2000) Tyrosine kinase signalling in breast cancer. Breast Cancer Res. 2, 154–157. - PMC - PubMed
    1. Geho DH, Bandle RW, Clair T, Liotta LA (2005) Physiological mechanisms of tumor‐cell invasion and migration. Physiology (Bethesda) 20, 194–200. - PubMed
    1. Porter AC, Vaillancourt RR (1998) Tyrosine kinase receptor‐activated signal transduction pathways which lead to oncogenesis. Oncogene 17, 1343–1352. - PubMed

Publication types

MeSH terms