Wall shear stress measured by phase contrast cardiovascular magnetic resonance in children and adolescents with pulmonary arterial hypertension
- PMID: 24034144
- PMCID: PMC3848825
- DOI: 10.1186/1532-429X-15-81
Wall shear stress measured by phase contrast cardiovascular magnetic resonance in children and adolescents with pulmonary arterial hypertension
Abstract
Background: Pulmonary arterial hypertension (PAH) is a devastating disease with significant morbidity and mortality. At the macroscopic level, disease progression is observed as a complex interplay between mean pulmonary artery pressure, pulmonary vascular resistance, pulmonary vascular stiffness, arterial size, and flow. Wall shear stress (WSS) is known to mediate or be dependent on a number of these factors. Given that WSS is known to promote architectural vessel remodeling, it is imperative that the changes of this factor be quantified in the presence of PAH.
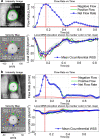
Methods: In this study, we analyzed phase contrast imaging of the right pulmonary artery derived from cardiovascular magnetic resonance to quantify the local, temporal and circumferentially averaged WSS of a PAH population and a pediatric control population. In addition, information about flow and relative area change were derived.
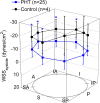
Results: Although the normotensive and PAH shear waveform exhibited a WSS profile which is uniform in magnitude and direction along the vessel circumference at systole, time-averaged WSS (2.2 ± 1.6 vs. 6.6 ± 3.4 dynes/cm(2), P = 0.018) and systolic WSS (8.2 ± 5.0 v. 20.0 ± 9.1 dynes/cm(2), P = 0.018) was significantly depressed in the PAH population as compared to the controls. BSA-indexed PA diameter was significantly larger in the PAH population (1.5 ± 0.4 vs. 0.7 ± 0.1 cm/m(2), P = 0.003).
Conclusions: In the presence of preserved flow rates through a large PAH pulmonary artery, WSS is significantly decreased. This may have implications for proximal pulmonary artery remodeling and cellular function in the progression of PAH.
Figures


References
-
- Barst RJ, McGoon MD, Elliott CG, Foreman AJ, Miller DP, Ivy DD. Survival in childhood pulmonary arterial hypertension: insights from the registry to evaluate early and long-term pulmonary arterial hypertension disease management. Circulation. 2012;125:113–122. doi: 10.1161/CIRCULATIONAHA.111.026591. - DOI - PubMed
-
- Fasnacht MS, Tolsa JF, Beghetti M. The Swiss registry for pulmonary arterial hypertension: the paediatric experience. Swiss med wkly. 2007;137:510–513. - PubMed
-
- Fraisse A, Jais X, Schleich JM, di Filippo S, Maragnes P, Beghetti M, Gressin V, Voisin M, Dauphin C, Clerson P. et al.Characteristics and prospective 2-year follow-up of children with pulmonary arterial hypertension in France. Arch cardiovasc dis. 2010;103:66–74. doi: 10.1016/j.acvd.2009.12.001. - DOI - PubMed
Publication types
MeSH terms
Grants and funding
LinkOut - more resources
Full Text Sources
Other Literature Sources
Medical
Research Materials

