. 2013 Sep 12;154(6):1356-69.
doi: 10.1016/j.cell.2013.08.026.

Decoding information in cell shape

Affiliations

Decoding information in cell shape

Padmini Rangamani et al. Cell. .

Abstract

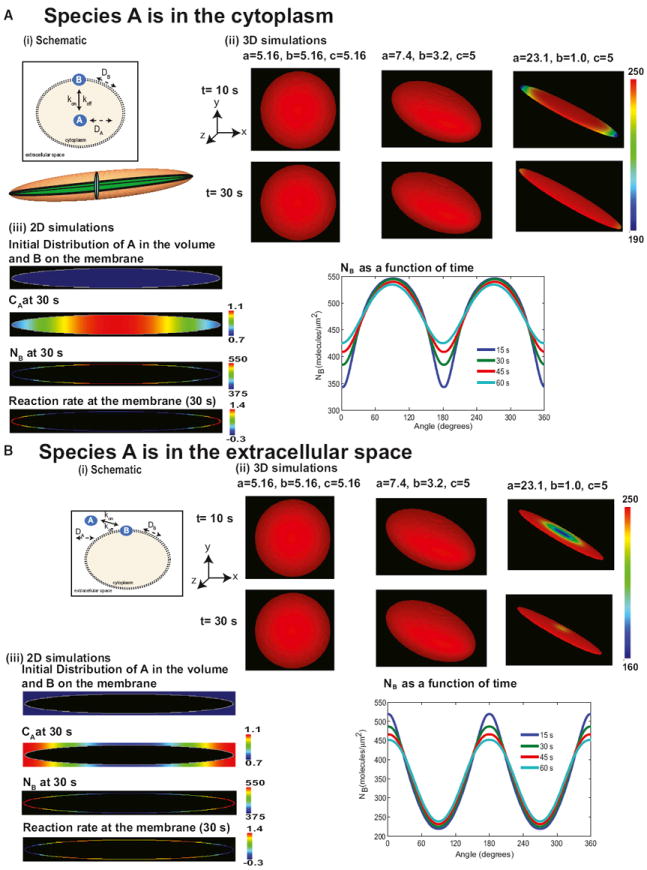
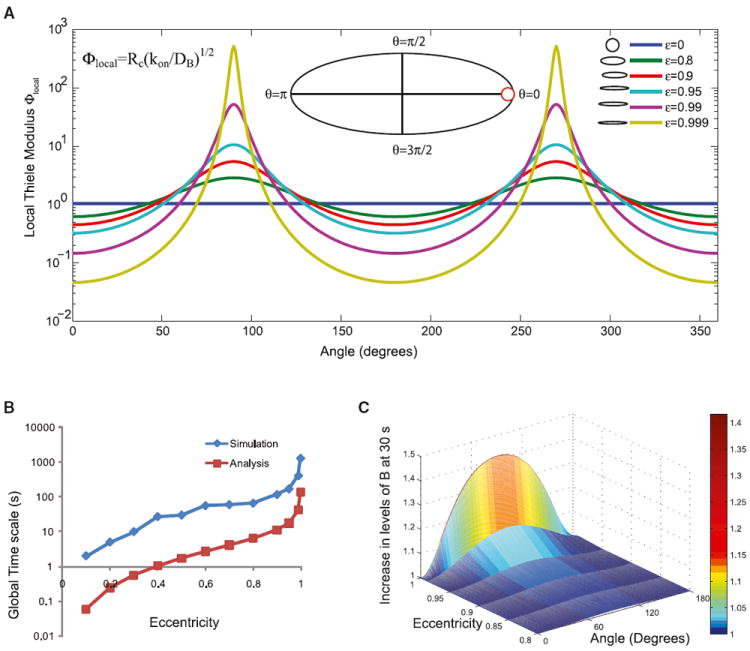
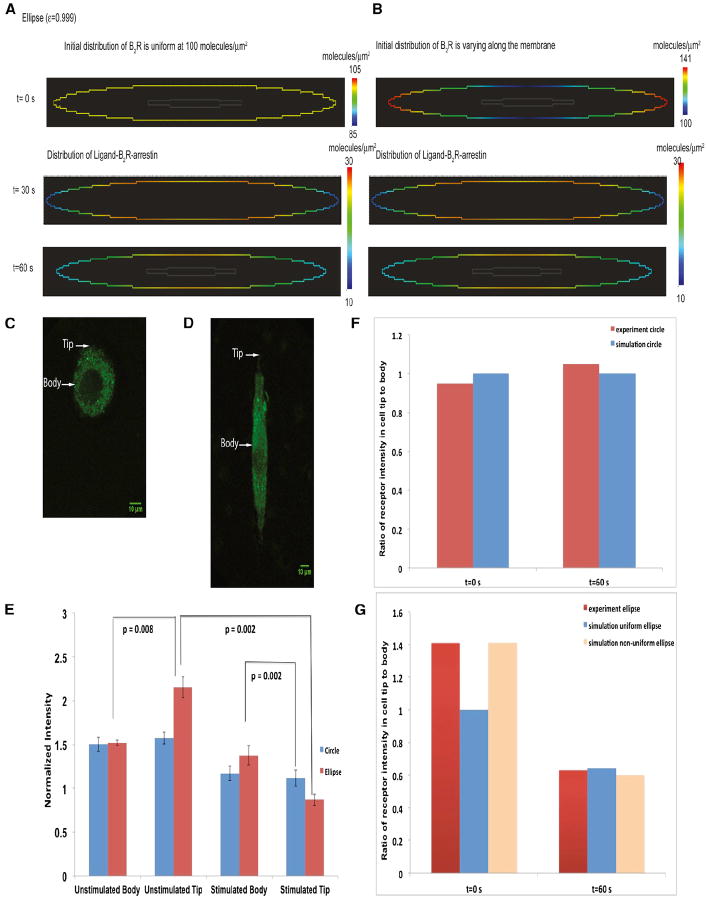
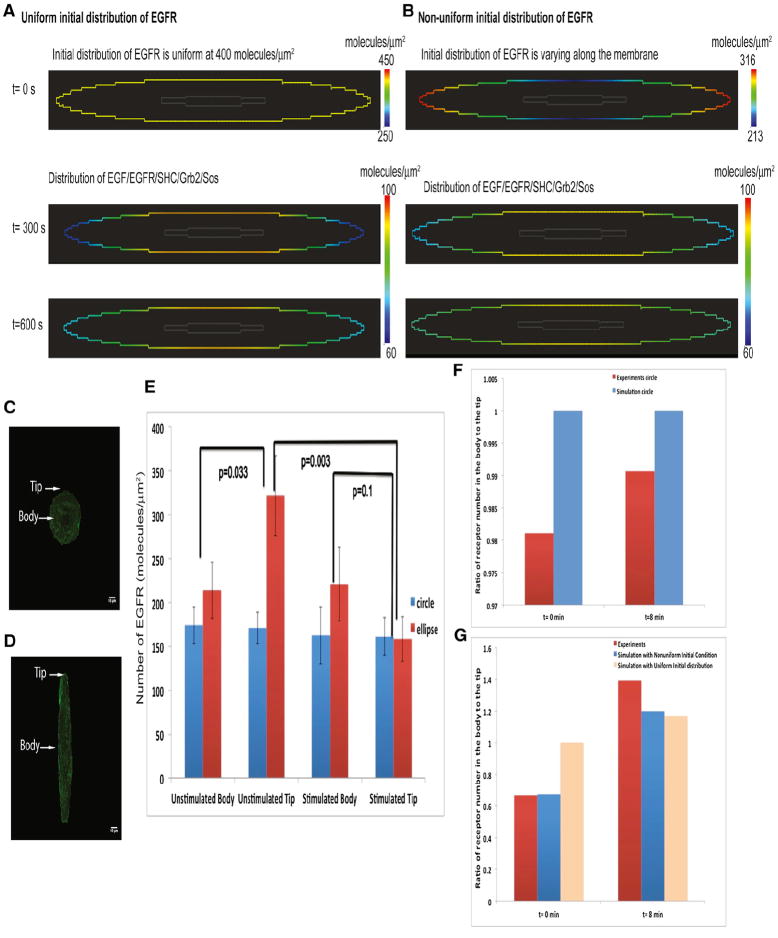
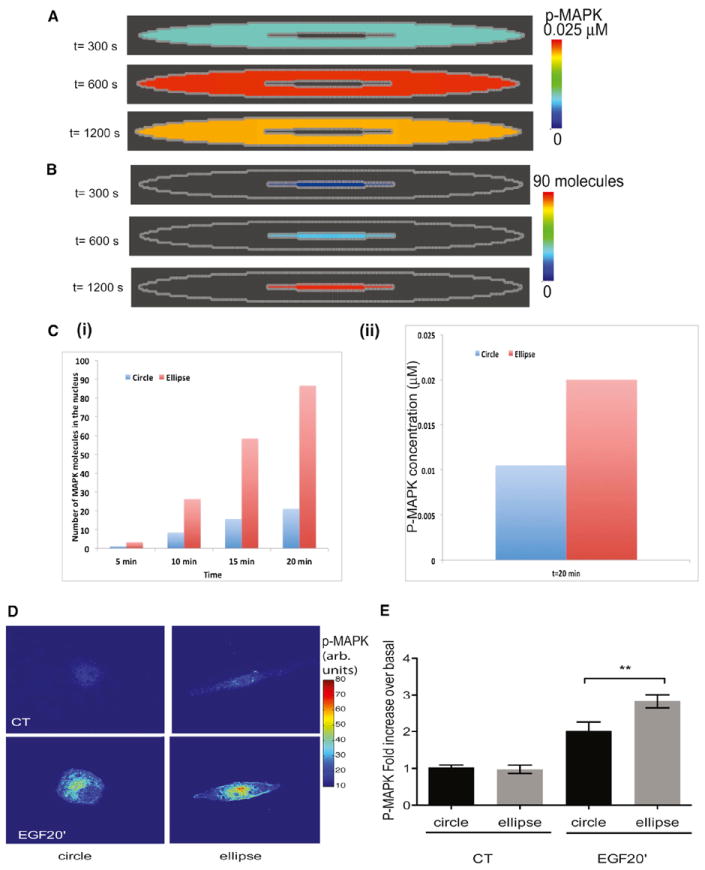
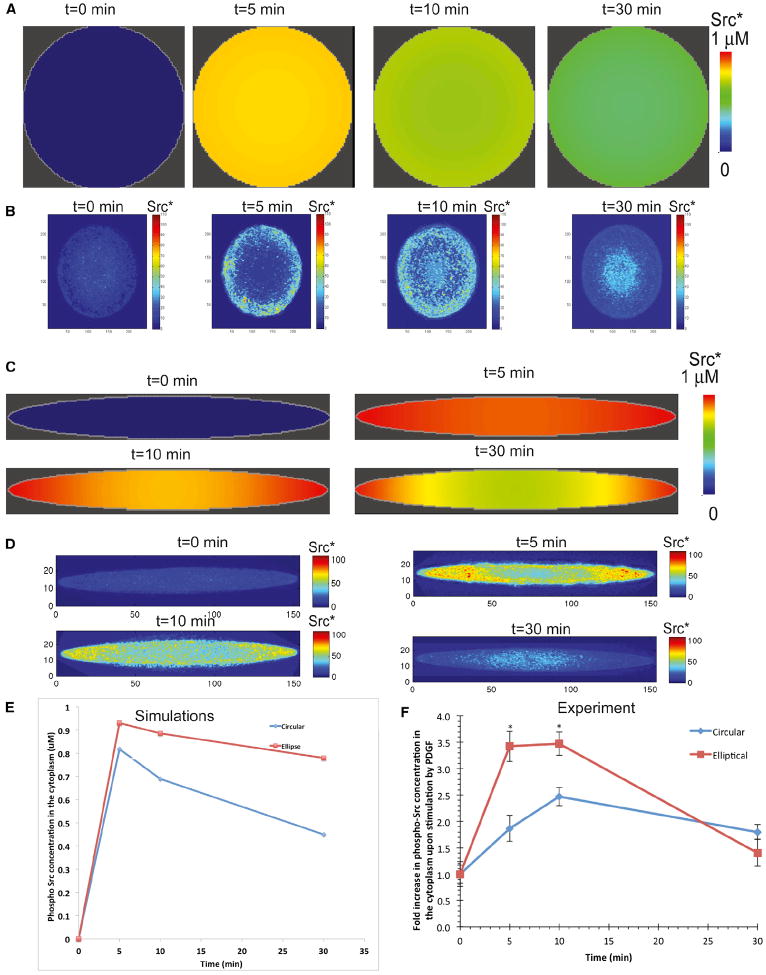
Shape is an indicator of cell health. But how is the information in shape decoded? We hypothesize that decoding occurs by modulation of signaling through changes in plasma membrane curvature. Using analytical approaches and numerical simulations, we studied how elongation of cell shape affects plasma membrane signaling. Mathematical analyses reveal transient accumulation of activated receptors at regions of higher curvature with increasing cell eccentricity. This distribution of activated receptors is periodic, following the Mathieu function, and it arises from local imbalance between reaction and diffusion of soluble ligands and receptors in the plane of the membrane. Numerical simulations show that transient microdomains of activated receptors amplify signals to downstream protein kinases. For growth factor receptor pathways, increasing cell eccentricity elevates the levels of activated cytoplasmic Src and nuclear MAPK1,2. These predictions were experimentally validated by changing cellular eccentricity, showing that shape is a locus of retrievable information storage in cells.


Figures

Figure 1
Figure 1. Simulations of the Effect of Membrane Curvature on the Transformation of Homogeneous Initial Distribution of Signaling Components to Transient Inhomogeneities in the Membrane and the Cytoplasm
(A) Signaling from the cytoplasm to the membrane. (i) The cytoplasmic component A binds to the plasma membrane to form membrane component B. A is free to diffuse in the cytoplasmic volume, whereas B has lateral mobility in the plane of the membrane. The cartoon below the reaction scheme illustrates that, in an ellipsoid, all 2D cross-sections passing through the center yield ellipses. (ii) Membrane surface distribution of B in 3D at 10 and 30 s in a sphere and two ellipsoids. The needle-shaped cell shows a transient spatial inhomogeneity in the membrane concentration of B. The dimensions of the shapes are shown on the panels. Initial concentration of A in the cytoplasm is 2 μM, and initial distribution of B on the membrane is 0 molecules/μm2. The values of a, b, and c are the semiprincipal axes of the ellipsoid and determine its shape. For a sphere, a = b = c = radius of the sphere. (iii) Simulations of the distribution of signaling components in 2D geometry. Shown are the initial distribution of A (2 μM in the cytoplasm) and B (0 molecules/μm2), concentration of A in the cytoplasm at 30 s, molecular density of B on the membrane at 30 s, and reaction rate along the membrane at 30 s, and angular dependence of membrane density of B at different times follows a Mathieu sine function. (B) Same as in (A) except species A is in the extracellular space. The surface-to-volume relationship is reversed, and this results in a Mathieu cosine function. See also Figure S1.
Figure 2
Figure 2. Angular Dependence of Local Thiele Modulus in Elliptically Shaped Cells
(A) Local Thiele modulus varies along the angle in an ellipse and results in competing reaction and diffusion processes along the membrane. The range of the local Thiele modulus also increases with increasing eccentricity of the ellipse. Inset shows a reference ellipse with the different angles marked. The red circle shows the osculating circle that determines the radius of curvature at the point θ = 0. (B) The global timescales from analysis and numerical simulations follow similar dependence on eccentricity. Note that the simulation includes the timescale of the reaction, whereas the analysis is based on size and diffusivity alone. (C) The fold change in component B along the membrane is calculated by normalizing the membrane concentrations by the value of B at θ = 0. The fold change in B depends on the eccentricity of the ellipse, and as the ellipse becomes more elongated (compare ε = 0.9 to ε = 0.999), the fold change in B increases.
Figure 3
Figure 3. Numerical Simulations and Experiments on the Plasma Membrane Distribution of Bradykinin Receptor in Circular and Elliptical A-10 Cells
Simulation of the spatial distribution of active bradykinin receptor at 1 min for a uniform initial distribution. The concentration of active bradykinin receptor is higher in the body than in the tips. Please note that this simulation utilizes signaling components binding to the plasma membrane from both the outside (bradykinin) and inside (β-arrestin) of the cell (see Figure S1E). (A) Simulation of the spatial distribution of active bradykinin receptor at 1 min for a nonuniform initial distribution of the receptor. (B) Representative circular cell used for analysis. Arrows indicate the region of the plasma membrane where body and tip measurements were taken. (C) Representative elliptical cell used for analysis. Arrows indicate the region of the plasma membrane where body and tip measurements were taken. (D) Experiments determining levels of bradykinin receptor in the body or tip of circular and elliptical cells (n = 5). The normalized fluorescence intensity is compared between circular cells and elliptical cells. Data ± SD are shown. p values indicate statistical difference according to Mann-Whitney tests. (E) Ratio of receptor intensity in cell tip to cell body in circular cells. (F) Ratio of receptor intensity in cell tip to cell body in elliptical cells. See also Tables S1 and S2.
Figure 4
Figure 4. Numerical Simulations and Experiments on the Membrane Distribution of EGFR-eGFP in Circular and Elliptical COS-7 Cells
(A) Simulation of the spatial distribution of active EGFR-eGFP at 5 and 10 min. The concentration of EGFR is higher in the body than in the tips. Please note that this simulation utilizes signaling components binding to the plasma membrane from both the outside (EGF) and inside (SHC and GRB2) of the cell (see Figure S1E). The initial distribution of EGFR is uniform in this case. (B) Simulations of the spatial distribution of active EGFR-eGFP at 5 and 10 min. The initial distribution of EGFR is nonuniform in this case. The concentration of EGFR is higher in the body than in the tips. (C) Representative circular cell transfected with EGFR-eGFP. Arrows indicate the region of the plasma membrane where body and tip measurements were taken. (D) Representative elliptical cell used for FCS analysis. Arrows indicate the region of the plasma membrane where body and tip measurements were taken. (E) Experiments determining levels of EGFR-eGFP in the body or tip of elliptical cells (n = 14). Numerical values were extracted from the autocorrelation function fit to fluorescence correlation data for unstimulated data. Cells were measured after 12 hr of serum starvation; for stimulated data, measurements were started immediately after addition of 100 ng/ml EGF and were completed within 8 min. Data ± SD are shown. p values indicate statistical difference according to Mann-Whitney tests. (F) Ratio of receptor number at the tip to body in simulations and experiment in circular cells. (G) Ratio of receptor number at the tip to body in simulations and experiment in elliptical cells. See also Figures S2 and S3 and Tables S3, S4, and S5.
Figure 5
Figure 5. Levels of Activated MAPK1,2 in the Nucleus of Circular and Elliptical Cells
(A) Simulations of the activation of MAPK1,2 in the cytoplasm. The concentration of MAPK1,2 in the cytoplasm follows the kinetics shown in Figure S4—first increasing and then attaining a steady value before decreasing. The spatial distribution of MAPK1,2 in the cytoplasm appears uniform because of the high diffusion coefficient of MAPK1,2 in the cytoplasm. Later time points are shown for comparison with experiments (B) Simulations of active MAPK1,2 in the nucleus. The concentration of MAPK1,2 increases with time in the nucleus. The spatial distribution of MAPK1,2 in the nucleus appears uniform because of the high diffusion coefficient of active MAPK within the nucleus. (C) (i) From simulations, the number of molecules of active MAPK1,2 in the nucleus is higher in elliptical cells when compared to the number of active MAPK in circular cells. (ii) The concentration of p-MAPK1,2 in circular and elliptical cells at 20 min is shown from simulations. (D) Elliptical COS7 cells stimulated with EGF show an enhanced accumulation of phosphor- MAPK. p MAPK1,2 immunostained cells are shown as color-coded grayscale images. Original pseudocolored images are shown in Figure S5. (E) EGF-treated cells show a higher concentration of p-MAPK1,2 in elliptical cells than in circular cells. Fluorescence intensity ratios of nuclear p-MAPK1,2/MAPK1,2 were plotted as mean ± SEM (n = 15–31; p = 0.0069; one-tailed t test) See also Figures S4 and S5.
Figure 6
Figure 6. Levels of PDGF-Activated Phospho-Src in Circle and Elliptically Shaped Cardiac Fibroblasts
(A) Simulations show that, in circular cells, homogeneous concentration of phospho-Src in the cytoplasm is obtained upon activation of the cells by PDGF. (B) In experiments, circular cardiac fibroblasts grown in microfabricated grooves (n = 13–19) exhibit nearly uniform activation of Src near the plasma membrane, as measured by quantitative immunofluorescence. (C) Simulations show that, upon activation, the concentration of phospho-Src leads to a curvature-dependent concentration gradient in the cytoplasm. (D) In experiments, PDGF-activated phospho-Src in cardiac fibroblasts grown on elliptical cells (n = 12–14) shows a concentration gradient. (E) Simulations show that phospho-Src in the cytoplasm has a higher concentration in elliptical cells when compared to the concentration of phospho-Src in circular cells. (F) Summary of experimental data of fold increase of phospho-Src upon PDGF activation for indicated times. Values are means of 12–20 independent cells from two separate experiments and SEM (n = 12–20; *p < 0.001 when comparing ellipses and circles at the same time point; unpaired two-tailed t tests with Bonferroni correction for multiple comparisons). See also Figure S6 and Table S6.

References

    1. Ahmed I, Ponery AS, Nur-E-Kamal A, Kamal J, Meshel AS, Sheetz MP, Schindler M, Meiners S. Morphology, cytoskeletal organization, and myosin dynamics of mouse embryonic fibroblasts cultured on nanofibrillar surfaces. Mol Cell Biochem. 2007;301:241–249. - PubMed
    1. Allen JA, Halverson-Tamboli RA, Rasenick MM. Lipid raft microdomains and neurotransmitter signalling. Nat Rev Neurosci. 2007;8:128–140. - PubMed
    1. Arscott FM. Periodic Differential Equations: An Introduction to Mathieu, Lamé, and Allied Functions. New York: The Macmillan Company; 1964.
    1. Asthagiri AR, Lauffenburger DA. A computational study of feedback effects on signal dynamics in a mitogen-activated protein kinase (MAPK) pathway model. Biotechnol Prog. 2001;17:227–239. - PubMed
    1. Bhalla US, Iyengar R. Emergent properties of networks of biological signaling pathways. Science. 1999;283:381–387. - PubMed

Publication types

LinkOut - more resources