. 2013;14(9):R101.
doi: 10.1186/gb-2013-14-9-r101.

Reducing assembly complexity of microbial genomes with single-molecule sequencing

Reducing assembly complexity of microbial genomes with single-molecule sequencing

Sergey Koren et al. Genome Biol. 2013.

Abstract

Background: The short reads output by first- and second-generation DNA sequencing instruments cannot completely reconstruct microbial chromosomes. Therefore, most genomes have been left unfinished due to the significant resources required to manually close gaps in draft assemblies. Third-generation, single-molecule sequencing addresses this problem by greatly increasing sequencing read length, which simplifies the assembly problem.

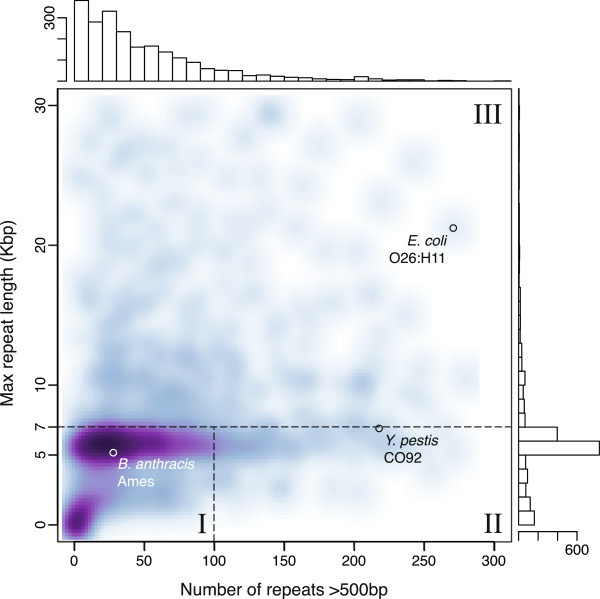
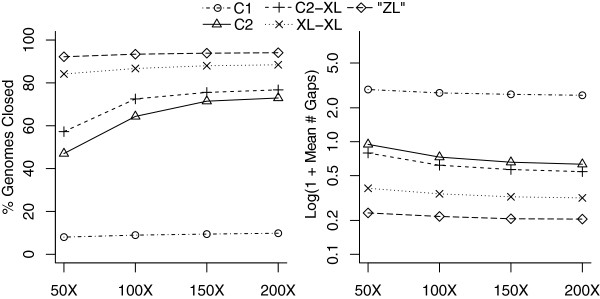
Results: To measure the benefit of single-molecule sequencing on microbial genome assembly, we sequenced and assembled the genomes of six bacteria and analyzed the repeat complexity of 2,267 complete bacteria and archaea. Our results indicate that the majority of known bacterial and archaeal genomes can be assembled without gaps, at finished-grade quality, using a single PacBio RS sequencing library. These single-library assemblies are also more accurate than typical short-read assemblies and hybrid assemblies of short and long reads.

Conclusions: Automated assembly of long, single-molecule sequencing data reduces the cost of microbial finishing to $1,000 for most genomes, and future advances in this technology are expected to drive the cost lower. This is expected to increase the number of completed genomes, improve the quality of microbial genome databases, and enable high-fidelity, population-scale studies of pan-genomes and chromosomal organization.


Figures

Figure 1
Figure 1
Genome assembly graph complexity is reduced as sequence length increases. Three de Bruijn graphs for E. coli K12 are shown for k of 50, 1,000, and 5,000. The graphs are constructed from the reference and are error-free following the methodology of Kingsford et al.[27]. Non-branching paths have been collapsed, so each node can be thought of as a contig with edges indicating adjacency relationships that cannot be resolved, leaving a repeat-induced gap in the assembly. (A) At k = 50, the graph is tangled with hundreds of contigs. (B) Increasing the k-mer size to k = 1,000 significantly simplifies the graph, but unresolved repeats remain. (C) At k = 5,000, the graph is fully resolved into a single contig. The single contig is self-adjacent, reflecting the circular chromosome of the bacterium.
Figure 2
Figure 2
Improving PacBio RS sequence lengths. The sequence length histograms of four PacBio RS chemistries are shown using 100 bp buckets. Solid lines correspond to observed sequence lengths and dashed lines correspond to fitted log-normal distributions [17] with the specified mean and standard deviation. Since the initial instrument release in April 2011, the average sequence length increased over 3.5-fold through December 2012. (A) The original C1 chemistry, released in April 2011; (B) C2 chemistry, released in February, 2012; (C) XL-C2 chemistry, released in December 2012; and (D) XL-XL chemistry, released in December 2012.
Figure 3
Figure 3
Sequence length compensates for increased error. The mean number of expected 10 bp seeds (the default in BLASR) was computed for each sequence length and error rate following the method in Chaisson and Tesler [28]. Additional seeds decrease the number of matches that have to be examined, decreasing runtime and increasing accuracy. For example, increasing the number of 15 bp seeds from 10 to 20 reduces the number of sequences with over 100 matches to the human reference by 25% [28]. Points correspond to the median sequence length and observed error rate of four PacBio RS sequencing chemistries. Sequence lengths also compensate for increased error since more seeds can be found in a longer sequence. For example, 20 seeds (dashed line), can be found both in a 0.75 kbp sequence at 15% error and an approximately 2.5 kbp sequence at 30% error.
Figure 4
Figure 4
Three classes of microbial genome assembly complexity. The top row illustrates repeat content via an alignment dotplot in Bacillus anthracis Ames, Yersinia pestis CO92, and Escherichia coli O26:H11 11368. For a repeat occurring at two distinct positions x and y in the genome, a dot of the corresponding size is placed on the matrix at [x,y]. The bottom row illustrates assemblies of these genomes using 200× simulated PacBio C2 sequencing (outer circle), and infinite coverage of 500 bp, perfect reads (inner circle). The number of gaps in each assembly is noted. Class I genomes have few repeats except for the rDNA operon sized 5 to 7 kbp. In this case, both short reads and PacBio reads can generate a continuous assembly. Class II genomes have many repeats, such as insertion sequence elements, but none greater than 7 kbp. In this case, the PacBio reads can completely assemble the genome, while the short-read assembly is heavily fragmented. Class III genomes contain large, often phage-related, repeats >7 kbp. In this case, no technology can generate a complete genome. However, the PacBio assembly is significantly more continuous than the short-read assembly.
Figure 5
Figure 5
Repeat count versus maximum repeat length for 2,267 complete genomes. For each genome, the number of repeat regions >500 bp is given on the horizontal axis and the size of the largest repeat in the genome is given on the vertical axis. A smoothed scatterplot of all complete genomes is in the center, with the corresponding histograms for each axis at the top and right. The figure is cropped to show only repeat counts <300 and maximum repeat size <30 kbp. This comprises 95% of the data, with the remaining 5% containing a maximum repeat >30 kbp or more than 300 repeats. In the extremes, class II genomes can reach over 800 repeat copies, and class III genome repeats can exceed 100 kbp [26,33].
Figure 6
Figure 6
Assembly improvement with increasing coverage and read length. Simulated assembly results on all complete NCBI references as of January 2013 using PacBio RS C1, C2, XL-C2, XL-XL, and projected 'ZL’ chemistries. The two figures show the percentage of genomes closed (left) and the average number of remaining gaps (right) with increasing sequencing coverage. C2 and newer chemistries can span the rDNA repeat and thus close many more genomes than the C1 chemistry. However, beyond 150× C2 there is limited benefit from further sequencing because the remaining repeats are too long to resolve. The longer chemistries saturate most repeats and gain little benefit from additional coverage over 50×. Resolving the remaining repeats requires a jump in sequence length to hundreds of kilobases.

References

    1. Kyrpides NC. Genomes OnLine database (GOLD 1.0): A monitor of complete and ongoing genome projects world-wide. Bioinformatics. 1999;14:773–774. - PubMed
    1. Pagani I, Liolios K, Jansson J, Chen IM, Smirnova T, Nosrat B, Markowitz VM, Kyrpides NC. The genomes OnLine database (GOLD) v. 4: status of genomic and metagenomic projects and their associated metadata. Nucleic Acids Res. 2012;14:D571–579. - PMC - PubMed
    1. Fraser CM, Eisen JA, Nelson KE, Paulsen IT, Salzberg SL. The value of complete microbial genome sequencing (you get what you pay for) J Bacteriol. 2002;14:6403–6405. - PMC - PubMed
    1. Chain PS, Grafham DV, Fulton RS, Fitzgerald MG, Hostetler J, Muzny D, Ali J, Birren B, Bruce DC, Buhay C, Cole JR, Ding Y, Dugan S, Field D, Garrity GM, Gibbs R, Graves T, Han CS, Harrison SH, Highlander S, Hugenholtz P, Khouri HM, Kodira CD, Kolker E, Kyrpides NC, Lang D, Lapidus A, Malfatti SA, Markowitz V, Metha T. et al.Genomics. Genome project standards in a new era of sequencing. Science. 2009;14:236–237. - PMC - PubMed
    1. Salzberg SL, Yorke JA. Beware of mis-assembled genomes. Bioinformatics. 2005;14:4320–4321. - PubMed

Publication types