. 2013;14(9):R102.
doi: 10.1186/gb-2013-14-9-r102.

Differential DNA methylation with age displays both common and dynamic features across human tissues that are influenced by CpG landscape

Differential DNA methylation with age displays both common and dynamic features across human tissues that are influenced by CpG landscape

Kenneth Day et al. Genome Biol. 2013.

Abstract

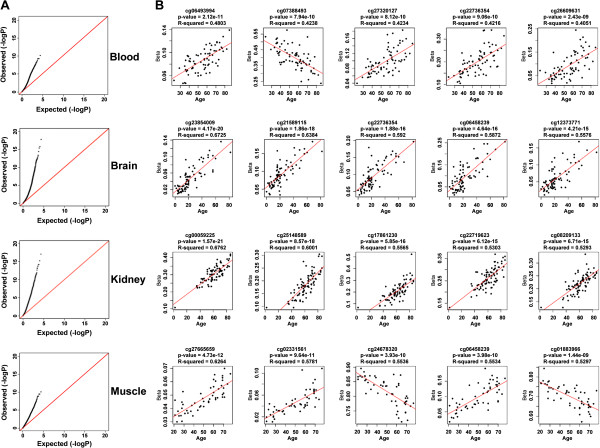
Background: DNA methylation is an epigenetic modification that changes with age in human tissues, although the mechanisms and specificity of this process are still poorly understood. We compared CpG methylation changes with age across 283 human blood, brain, kidney, and skeletal muscle samples using methylation arrays to identify tissue-specific age effects.

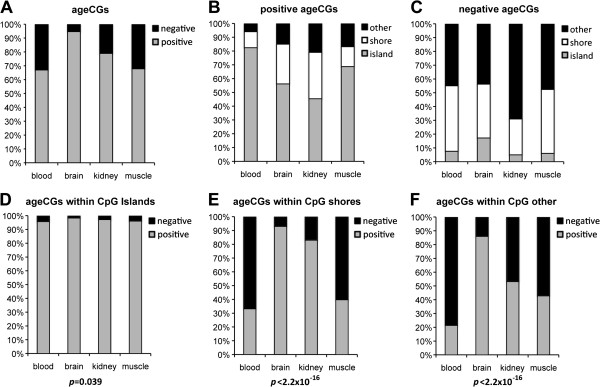
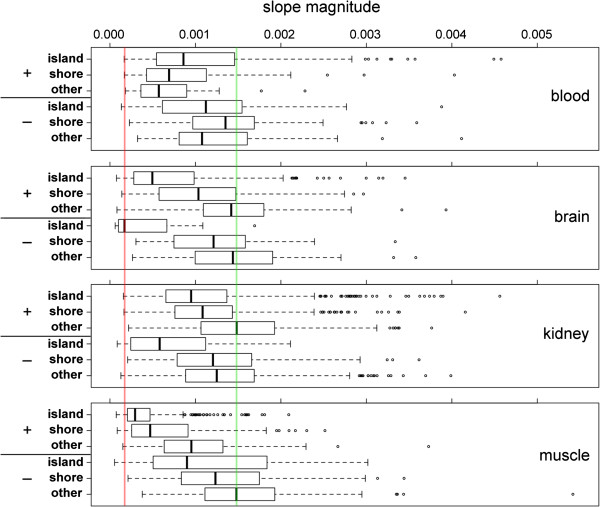
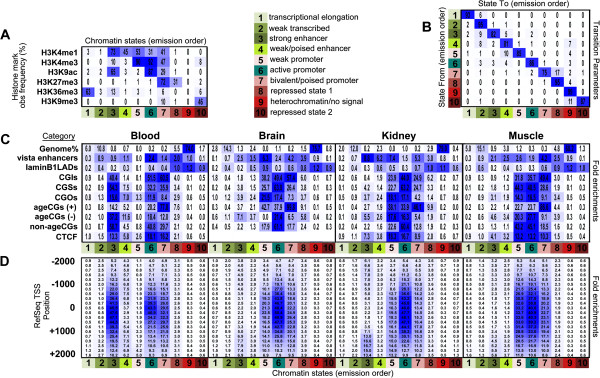
Results: We found age-associated CpGs (ageCGs) that are both tissue-specific and common across tissues. Tissue-specific age CGs are frequently located outside CpG islands with decreased methylation, and common ageCGs show the opposite trend. AgeCGs are significantly associated with poorly expressed genes, but those with decreasing methylation are linked with higher tissue-specific expression levels compared with increasing methylation. Therefore, tissue-specific gene expression may protect against common age-dependent methylation. Distinguished from other tissues, skeletal muscle age CGs are more associated with expression, enriched near genes related to myofiber contraction, and closer to muscle-specific CTCF binding sites. Kidney-specific ageCGs are more increasingly methylated compared to other tissues as measured by affiliation with kidney-specific expressed genes. Underlying chromatin features also mark common and tissue-specific age effects reflective of poised and active chromatin states, respectively. In contrast with decreasingly methylated ageCGs, increasingly methylated ageCGs are also generally further from CTCF binding sites and enriched within lamina associated domains.

Conclusions: Our data identified common and tissue-specific DNA methylation changes with age that are reflective of CpG landscape and suggests both common and unique alterations within human tissues. Our findings also indicate that a simple epigenetic drift model is insufficient to explain all age-related changes in DNA methylation.


Figures

Figure 1
Figure 1
Linear regression results showed an association between DNA methylation and age across four human tissues. (A) Uniform quantile-quantile (Q-Q) plots of -log P-values from linear regression tests for associations between β-score and age within blood, brain, kidney, and skeletal muscle tissue samples. (B) Scatterplots for the top five strongest associations between β-score and age across each of the four tissues. Illumina CpG ID, P-value, and R-squared results are depicted above each scatterplot.
Figure 2
Figure 2
Bar graphs displaying the percentages of ageCGs classified by CpG context and positive or negative association with age across four human tissues. (A) Percentage of total ageCGs that exhibited a positive or negative association with age in each tissue. (B,C) Percentage of positively associated (B) and negatively associated ageCGs (C) positioned within CpG islands, shores, or other. (D-F) Percentages of positively or negatively associated ageCGs each classified within CpG islands (D), CpG shores (E), or CpG other contexts (F). P-values are below bar graphs that resulted from Pearson’s Chi-squared tests between number of positive or negative associations across tissues in each respective CpG context.
Figure 3
Figure 3
Boxplots of slope magnitude grouped according to positive (+) or negative (-) ageCGs and CpG context across four tissues. Vertical red and green lines mark the smallest and largest median slope magnitude, respectively, across all four tissues. A significant three-way interaction between CpG context, tissue type, and positive or negative slope trend was found among slope magnitude values (ANOVA on Box-Cox power transformed slope values, P = 5.4 × 10⁻⁵).
Figure 4
Figure 4
Jointly learned tissue-specific chromatin states across four human tissues and functional enrichments within positive and negative ageCG positions. Ten input chromatin states using Roadmap Epigenome ChIP-seq data for six histone modifications across four human tissues were used with ChromHMM software. (A) Heatmap/table shows learned emission parameters based on genome-wide combinations of histone marks. Values indicate observed frequencies of histone modifications found at genomic positions corresponding with chromatin states. (B) Transitional parameter heatmap/table shows probabilities of transitions between states (multiplied by 100). Rows show the 'from' chromatin state and columns show the 'to' chromatin state, that is, a 17% probability that chromatin state 7 transitioned into state 8. (C) Heatmap/table depicts percentage of the genome for each chromatin state (topmost row) and relative fold functional enrichments of genome category (that is, vista enhancers, lamin B1 laminB1lads, CpGs within CGIs, CGSs, CGOs, positive (+) and negative (-) ageCGs and non-ageCGs). Enrichments for chromatin states underlying ChIP-seq CTCF binding sites were determined using ENCODE data for CD14+ and CD20+ cells (merged peaks blood), kidney tissue, and myotubes (brain data not available). Overlap enrichments were determined separately for each tissue using tissue-specific segmentation files generated from the jointly learned model. Values across rows indicate relative fold enrichment, and blue color scale is based on subtraction of the minimum value in the row divided by the maximum row value for each tissue separately (vertical black lines divide table enrichments per tissue). (D) Neighborhood enrichments for RefSeq transcriptional start site annotations (TSS) within chromatin states determined using default 0-based anchor coordinates for each start site position. Fold enrichment values and color scale are according to rows. In all panels, the lower axis shows chromatin state colored to match chromatin state descriptions (1 to 10).
Figure 5
Figure 5
Validation of ageCGs by targeted capture and bisulfite sequencing of genomic regions encompassing ageCG sites. (A) Scatterplots of percentage methylation by bisulfite sequencing (Bis-seq) versus Methylation27 β-score and correlation of methylation values between the two methods across 19 kidney samples used for validation. (B) A representative Bland-Altman plot for comparison of Bis-seq and Methylation27 methylation values. Points depict the average percentage methylation between both methods plotted against the differences in methylation between the methods. Dotted lines show limits of agreement (average difference ± 1.96 standard deviation of the difference). (C, D) Comparison of methylation delta values (median percentage methylation of young minus old samples) at CpGs covered by Bis-seq (top panels) and Methylation27 arrays (middle panels). Red points represent ageCGs, and delta values shown for Bis-seq are only for the 9 youngest and 10 oldest samples. False discovery rate (q) values indicate significance level of a widespread age effect by linear mixed model results with Bis-seq data at these target regions. The DKK1 target just missed the significance threshold (q < 0.05), and the RLN1 target demonstrates an example region that contained abrupt changes in direction of delta values among neighboring CpGs. Bottom panels depict labeled gene regions (blue boxes, exons blue lines, introns), CpG islands (green boxes), and fetal kidney chromatin states (colors correspond with definitions in Figure 4). Greater details and examples of all Bis-seq targets are available in Additional files 7 and 24.

References

    1. Scharf AN, Imhof A. Every methyl counts-epigenetic calculus. FEBS Lett. 2011;14:2001–2007. doi: 10.1016/j.febslet.2010.11.029. - DOI - PubMed
    1. Jin B, Li Y, Robertson KD. DNA methylation: superior or subordinate in the epigenetic hierarchy? Genes Cancer. 2011;14:607–617. doi: 10.1177/1947601910393957. - DOI - PMC - PubMed
    1. Gardiner-Garden M, Frommer M. CpG islands in vertebrate genomes. J Mol Biol. 1987;14:261–282. doi: 10.1016/0022-2836(87)90689-9. - DOI - PubMed
    1. Kafri T, Ariel M, Brandeis M, Shemer R, Urven L, McCarrey J, Cedar H, Razin A. Developmental pattern of gene-specific DNA methylation in the mouse embryo and germ line. Genes Dev. 1992;14:705–714. doi: 10.1101/gad.6.5.705. - DOI - PubMed
    1. Smith ZD, Chan MM, Mikkelsen TS, Gu H, Gnirke A, Regev A, Meissner A. A unique regulatory phase of DNA methylation in the early mammalian embryo. Nature. 2012;14:339–344. doi: 10.1038/nature10960. - DOI - PMC - PubMed

MeSH terms