. 2013 Nov 7;13(5):602-16.
doi: 10.1016/j.stem.2013.08.013. Epub 2013 Sep 12.

Long-range chromatin contacts in embryonic stem cells reveal a role for pluripotency factors and polycomb proteins in genome organization

Affiliations

Long-range chromatin contacts in embryonic stem cells reveal a role for pluripotency factors and polycomb proteins in genome organization

Matthew Denholtz et al. Cell Stem Cell. .

Abstract

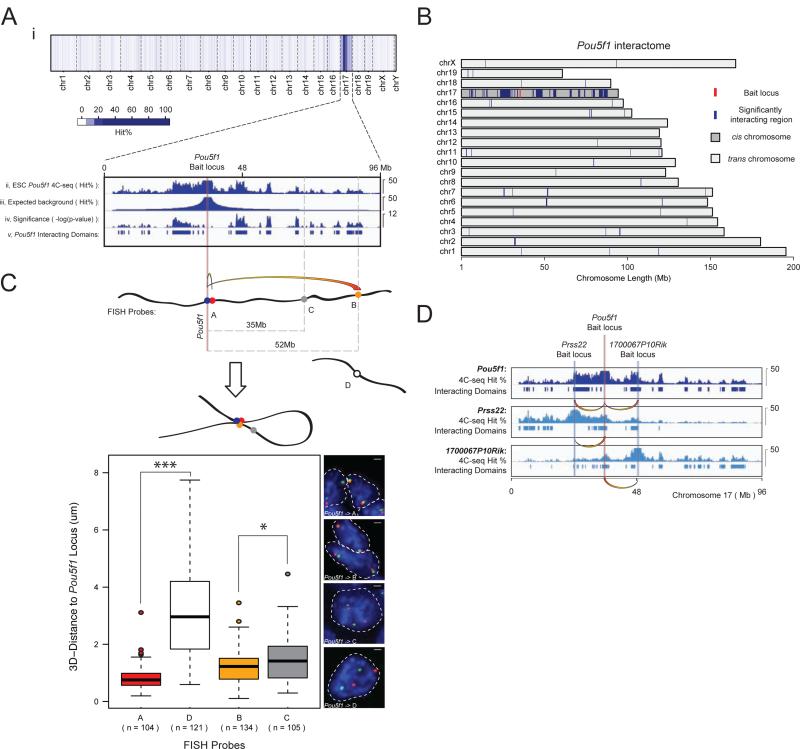
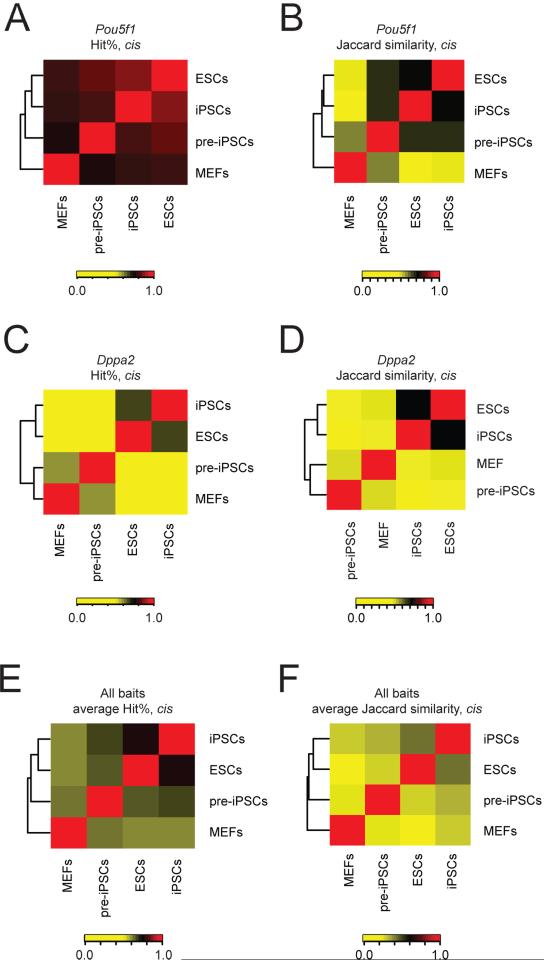
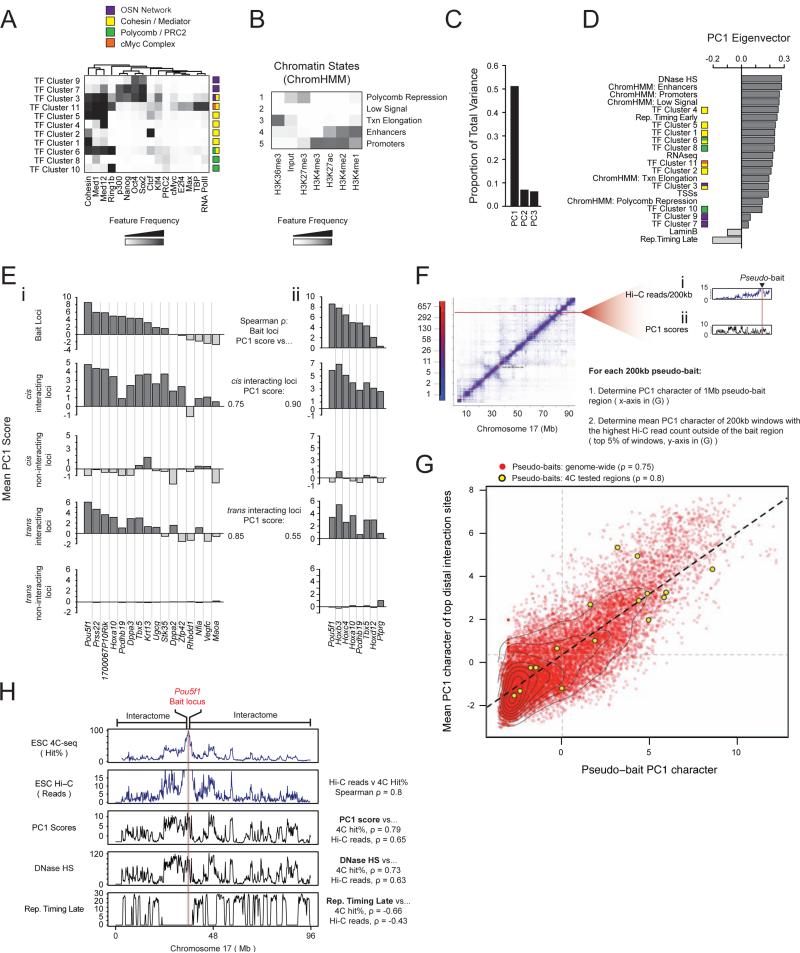
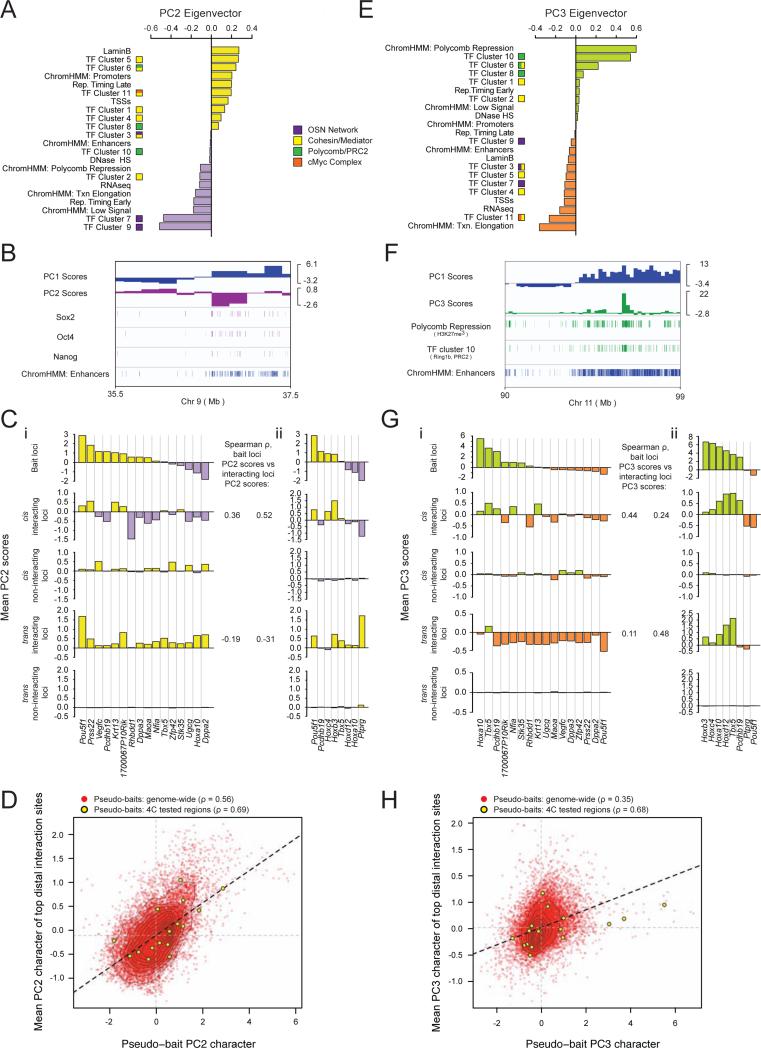
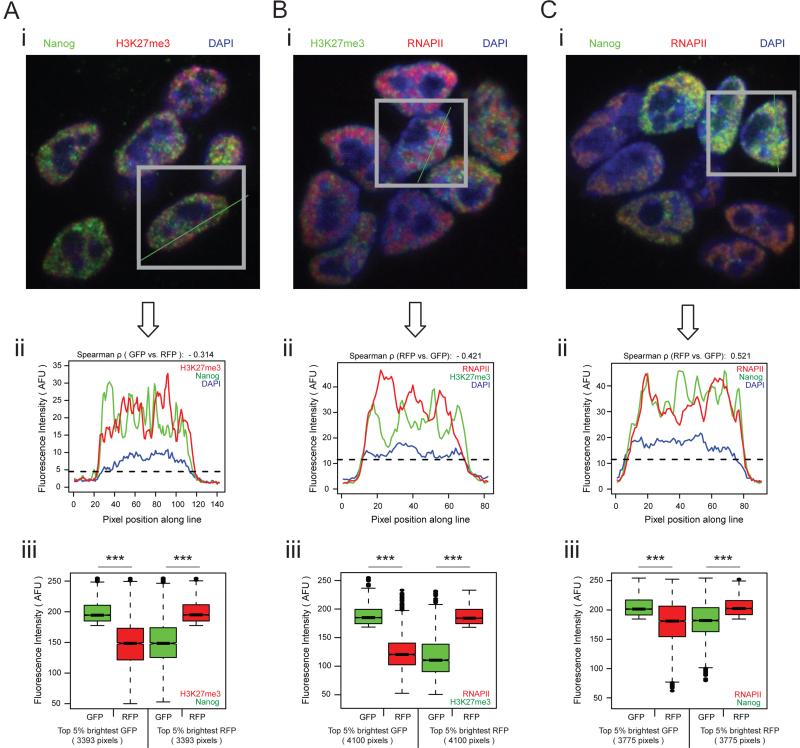
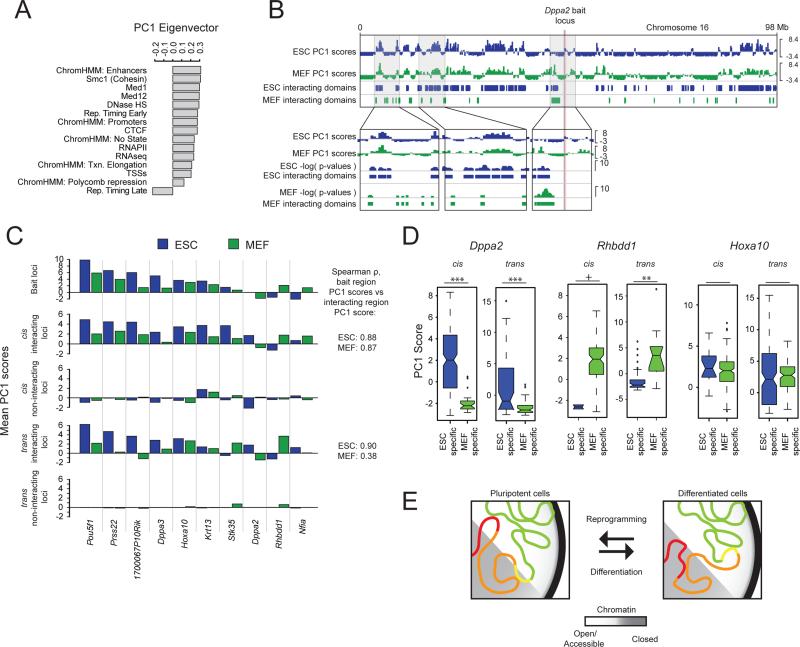
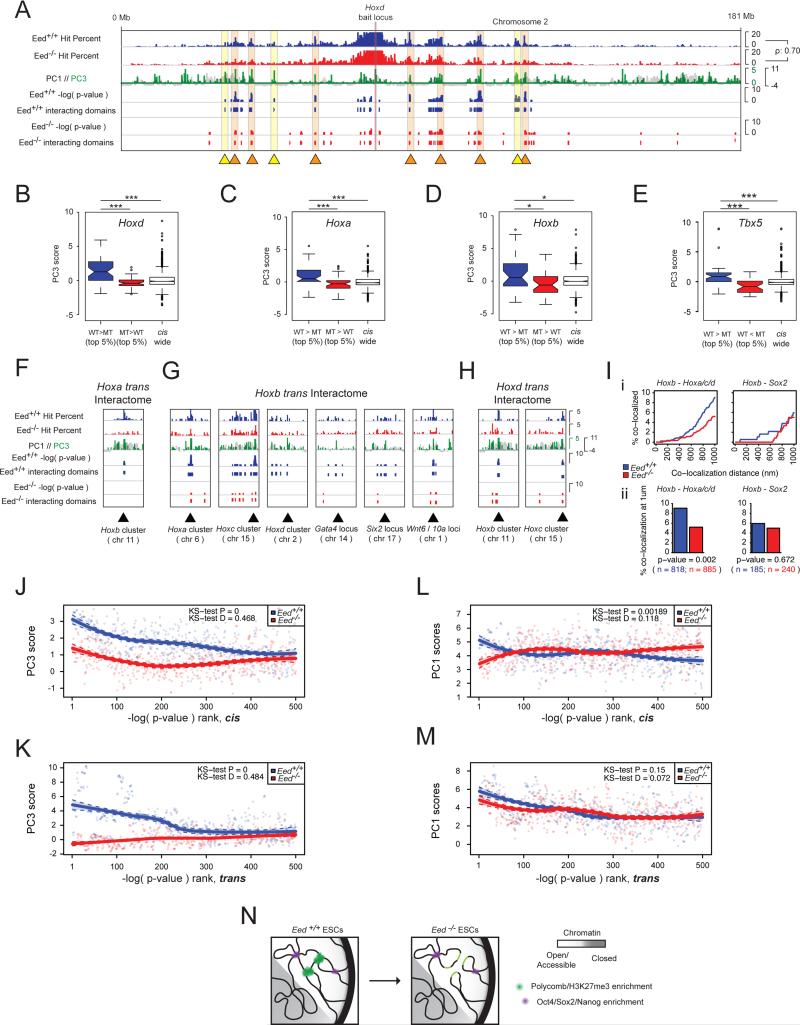
The relationship between 3D organization of the genome and gene-regulatory networks is poorly understood. Here, we examined long-range chromatin interactions genome-wide in mouse embryonic stem cells (ESCs), iPSCs, and fibroblasts and uncovered a pluripotency-specific genome organization that is gradually reestablished during reprogramming. Our data confirm that long-range chromatin interactions are primarily associated with the spatial segregation of open and closed chromatin, defining overall chromosome conformation. Additionally, we identified two further levels of genome organization in ESCs characterized by colocalization of regions with high pluripotency factor occupancy and strong enrichment for Polycomb proteins/H3K27me3, respectively. Underlining the independence of these networks and their functional relevance for genome organization, loss of the Polycomb protein Eed diminishes interactions between Polycomb-regulated regions without altering overarching chromosome conformation. Together, our data highlight a pluripotency-specific genome organization in which pluripotency factors such as Nanog and H3K27me3 occupy distinct nuclear spaces and reveal a role for cell-type-specific gene-regulatory networks in genome organization.


Figures

Figure 1
Figure 1. Long-range chromatin contacts of the Pou5f1 bait region in ESCs
A, Pooled 4C-seq data set, depicting the interaction profile of the Pou5f1 locus located on chromosome (chr) 17 in mouse ESCs. (i) Average hit probability (Hit%) within 200kb windows tiled across the genome. (ii) Hit% in cis (thresholded as displayed) was compared to an empirically modeled background hit% (iii) using the binomial test. (iv) Binomial test results and (v) significantly interacting domains of the Pou5f1 bait region (based on −log(p-values)>=1.8). The vertical red line and associated gray bar denote the Pou5f1 bait locus and the extended 1Mb bait region, respectively, which is always excluded from downstream analysis of the Pou5f1 interactome. B, Significantly interacting domains (blue) of the Pou5f1 bait region (red), genome-wide. C, DNA FISH-based 3D distance measurements between the Pou5f1 locus and genomic regions marked by A-C (in cis) or by D (in trans). Based on 4C-seq data, A and B interact with the Pou5f1 locus, but C, located in an intervening genomic region closer to Pou5f1 on linear DNA than B, does not. Boxes demarcate the interquartile range (IQR) and median, and whiskers +/−1.5 times the IQR. *=p-value<0.05, ***=p-value<0.001, Wilcoxon rank-sum test. D, Two genomic regions containing the gene Prss22 and 1700067P10Rik were identified as interacting partners of the Pou5f1 locus. 4C-seq experiments using Prss22 and 1700067P10Rik as bait regions confirmed their interaction with Pou5f1. Bait regions, 4C-seq hit%, and interacting domains are shown. See also Figure S1.
Figure 2
Figure 2. Long-range chromatin contacts change during differentiation and reprogramming of somatic cells to iPSCs
A, Unsupervised hierarchical clustering of Spearman rank correlation values of the hit% within 200kb windows along the cis chromosome (chr17) for Pou5f1 4C-seq-derived interactomes in ESCs, iPSCs, pre-iPSCs, and MEFs. Color key = Spearman rho values. B, Unsupervised hierarchical clustering of Jaccard similarity coefficients for the overlap of interacting domains of the Pou5f1 bait region in cis, between ESCs, iPSCs, pre-iPSCs, and MEFs. Color key = Jaccard similarity values. C, As in (A), except for the Dppa2 bait. D, As in (B), except for the Dppa2 bait. E, As in (A), except averaged across eight different bait loci (Pou5f1, Stk35, 1700067P10Rik, Nfia, Dppa3, Rhbdd1, Hoxa10, and Dppa2). F, As in (B), except averaged for the eight different bait loci named in (E). See also Figure S2.
Figure 3
Figure 3. Interactions between regions with similar open/closed chromatin are an intrinsic aspect of chromosome conformation
A, Transcription factor (TF) clusters defined using k-means clustering at 1kb resolution for noted ESC data sets, annotated based on feature frequency as represented by the heatmap. The color legend identifies specific gene-regulatory networks. B, Chromatin states were determined based on the six indicated histone modifications in ESCs by a multivariate hidden Markov model, at 200bp resolution (Ernst and Kellis, 2012). Grey scale denotes the frequency with which a given histone mark is found at genomic positions corresponding to the chromatin state. C, PCA was performed on ESC chromatin states and TF clusters from (A) and (B), as well as RNA-seq expression data, DnaseI hypersensitivity, LaminB binding, early and late DNA replication timing (Rep. timing), and density of transcriptional state sites (TSSs). Proportion of total variance in genomic features described by each principal component is shown. D, PC1 eigenvector ranked by genomic feature contribution. E, (i) Top to bottom: mean PC1 score within the 1Mb bait region centered on each listed bait's locus; interacting regions in cis; non-interacting regions in cis; interacting regions in trans; non-interacting regions in trans. Spearman rho's give the rank correlation between the mean PC1 score of the 1Mb bait regions and their interactomes in both cis and trans. (ii) Identical analysis to (i) with a partially overlapping set of baits, for an independently derived ESC line, which is discussed in Figure 7 as Eed+/+ ESC line. F, Schematic of genome-wide, Hi-C-based, pseudo-4C analysis. (i) Each extracted row of the Hi-C contact matrix, adapted from (Dixon et al., 2012), represents the interactome of one pseudo-bait. (ii) Plot of the PC1 character of the same chromosome. The mean PC1 score within the respective 1Mb pseudo-bait region (Pseudo-bait PC1 character) and the mean PC1 score within the pseudo-bait's interactome (top 5% of 200kb windows ranked by reads and excluding 1Mb pseudo bait region), were obtained and plotted as a red point in the scatterplot shown in (G). Pseudo-bait regions corresponding to genomic regions that we used as baits in our 4C-seq analysis in (Ei) are plotted in yellow (4C-bait loci). G, Result of the analysis described in (F). 4C-bait loci show a similar trend when analyzed based on Hi-C data as in (Ei) based on 4C-seq. Correlations between bait and interactome PC1 scores are noted. The Hi-C data are also summarized by the regression line in black, the mean bait and interactome PC1 scores are demarcated by vertical and horizontal grey lines, respectively. Contour lines represent data density. H, Top to bottom: comparison of the Pou5f1 4C-seq-based cis-interactome (hit%), the Pou5f1 cis-interactome defined by Hi-C read counts, PC1 scores, DNaseI HS, and late DNA replication timing along chr17. Specific correlation values are specified. See also Figures S3 and S4.
Figure 4
Figure 4. Regions of shared transcriptional network occupancy preferentially interact
A, PC2 eigenvector with individual feature contributions. TF clusters and chromatin states as in Figure 3. B, Integrative Genomics Viewer tracks of a representative genomic region with PC1 and PC2 scores; Sox2, Oct4, and Nanog occupancy; and enhancer density. C, (i) Top to bottom: mean PC2 score within the 1Mb region centered on each bait's locus; interacting regions in cis; non-interacting regions in cis; interacting regions in trans; non-interacting regions in trans. Spearman rho's give the correlation between the baits’ PC2 and the interactomes’ PC2 character across all analyzed baits in cis and trans. (ii) Identical analysis to (i) except for an independently derived ESC line discussed in Figure 7 as Eed+/+ ESCs, with a partially overlapping set of bait loci. D, Genome-wide pseudo-4C analysis of Hi-C data as described in Figure 3G, except for PC2. E, PC3 eigenvector with individual feature contributions. F, Integrative Genomics Viewer tracks showing a representative genomic region with PC1 and PC3 scores; H3K27me3 and TF cluster 10 (Ring1b/PRC2) enrichment, as well as enhancer density. G, As in (C), except for PC3 scores. H, As in (D), except for PC3 scores. See also Figures S3 and S4.
Figure 5
Figure 5. Nanog and H3K27me3 segregate in the ESC nucleus
A, (i) Image of ESCs immunostained with antibodies against Nanog (green) and H3K27me3 (red). Nuclei are stained with DAPI (blue). (ii) Red and green pixel intensities along the line in (i) for all pixels whose DAPI signals were above the indicated threshold (dotted line). (iii) Quantile normalized fluorescence intensity distribution of the top 5% brightest nuclear (but non-nucleolar) green pixels (GFP) and the normalized red pixel intensity (RFP) at the corresponding position (left); and of the top 5% brightest nuclear (but non-nucleolar) red pixels and the normalized distribution of green pixel intensity at the corresponding position (right), for all cells in the ESC colony in (i). Box and whisker demarcations as in Figure 1C. ***=p-value<2E-16, Wilcoxon rank-sum test. B, As in (A), except for H3K27me3 (green) and RNAPII (red). C, As in (A), except for Nanog (green) and RNAPII (red).
Figure 6
Figure 6. Changes in open/closed chromatin character between ESCs and MEFs correspond to changes in interaction preferences
A, PCA was performed for concatenated ESC+MEF data and included the indicated features. The resulting PC1 eigenvector is depicted. B, Top to bottom: Integrative Genomics Viewer tracks showing the PC1 scores along chr16 in ESCs (blue) and MEFs (green), and the 4C-seq- defined cis-interacting domains of the Dppa2 locus, in ESCs and MEFs. Zoom-ins highlight the switch in PC1 bait character of the Dppa2 locus between MEFs and ESCs (right box) and corresponding changes in interaction preferences (left two boxes). C, Top to bottom: mean PC1 score within the 1Mb region centered on each listed bait's locus; interacting regions in cis; non-interacting regions in cis; interacting regions in trans; non-interacting regions in trans, for ESC data (blue) and MEF data (green). Spearman rho's give the rank correlation between the PC1 bait character and interactome character per cell type, across all analyzed baits in cis and trans. D, PC1 score distributions of ESC and MEF-specific, significantly interacting domains of Dppa2, Rhbdd1, and Hoxa10. Box and whisker demarcations as in Figure 1C, notches ≈ 95% confidence interval around medians. +p-value=0.099; **p-value<0.01; ***p-value<0.001; Wilcoxon rank-sum test. E, Chromatin interaction model, wherein large-scale changes in chromatin interactions mirror changes in open/closed chromatin (PC1) character upon ESC differentiation. Note, for instance, the different interactions of the genomic regions marked in red and yellow, switching between open and closed chromatin. See also Figures S5.
Figure 7
Figure 7. Eed is required for the co-localization of Polycomb-occupied genomic regions
A, Integrative Genomics Viewer tracks showing the Hoxd12 interactome in cis in terms of hit% for Eed+/+ (blue) and Eed−/− (red) ESCs, chromosome-wide PC1 scores (black) overlaid with PC3 scores (green, positive values shown only), binomial test −log(p-values), and interacting domains. Regions that lose significant interactions with the Hoxd12 bait upon Eed ablation are marked with yellow triangles and shading; those that do not lose interactions with the Hoxd12 locus upon Eed ablation, but show a decrease in interaction strength with orange triangles and shading. The Spearman rho shows the rank correlation of the hit% between Eed+/+ and Eed−/− ESCs. B, Eed+/+ and Eed−/− ESCs Hoxd12 4C-seq hit% tracks from (A) were subtracted and the 200kb windows with the top and bottom 5% of resulting values were used to define regions of the cis-chromosome that showed stronger interactions in Eed+/+ (WT>MT) and Eed−/− (MT>WT) ESCs, respectively. The PC3 score distribution of these genomic regions and of the entire chromosome are shown. Box and whisker demarcation as in Figure 1C, notches ≈ 95% confidence interval around medians. ***=p-value<0.001, Wilcoxon rank-sum test. C-E, As in (B), but for the Hoxa10, Hoxb3, and Tbx5 4C-seq cis interactomes. *=p-value<0.05. F-H, Trans interactions between the indicated (PC3-positive) Hox loci in Eed+/+ and Eed−/− ESCs, displayed as in (A). Hoxa refers to results of the Hoxa10 bait locus, Hoxb to Hoxb3, Hoxc to Hoxc4, Hoxd to Hoxd12. I, DNA FISH analysis of the trans interactions between Hox clusters. (i) Cumulative frequency distribution plots of co-localization frequencies between Hoxb3 (chr11) and the other three Hox loci (Hoxa10-chr6, Hoxc4-chr15, Hoxd12-chr2) (left), as well as between Hoxb3 and the Sox2 (chr3) locus (right), with co-localization distances noted on the x-axis, measured in Eed+/+ (blue) and Eed−/− (red) ESCs. (ii) Co-localization frequencies at 1um for Hoxb3 and the other Hox loci (left), as well as for Hoxb3 and Sox2 (right), derived from (i). n=FISH signal pairs analyzed in both (i) and (ii); p-value from two-tailed Fisher exact test. J, The cis interactomes of the six PC3-positive (Polycomb/H3K27me3 enriched) bait loci (Hoxa10, Hoxb3, Hoxc4, Hoxd12, Pcdhb19, Tbx5, see Figure 4Gii) were ranked by −log(p-value) for both Eed+/+ (blue) and Eed−/− (red) ESCs, and the 500 top genomic sites plotted against their average PC3 scores in wildtype ESCs. Loess regression was used for curve generation. KS=Kolmogorov–Smirnov test to determine the probability that the two underlying probability distributions differ (D = KS-test D statistic). K, As in (J), but for the trans interactomes. L, As in (J), except for PC1 scores. M, As in (K), except for PC1 scores. N, Chromatin interaction model, wherein in the absence of Eed, the frequency of interactions between regions with high PC3 scores is reduced, but large-scale chromosome conformation is largely conserved. See also Figures S6.

References

    1. Apostolou E, Ferrari F, Walsh RM, Bar-Nur O, Stadtfeld M, Cheloufi S, Stuart HT, Polo JM, Ohsumi TK, Borowsky ML, et al. Genome-wide chromatin interactions of the Nanog locus in pluripotency, differentiation, and reprogramming. Cell stem cell. 2013;12:699–712. - PMC - PubMed
    1. Bantignies F, Cavalli G. Polycomb group proteins: repression in 3D. Trends in genetics : TIG. 2011;27:454–464. - PubMed
    1. Bickmore WA, van Steensel B. Genome Architecture: Domain Organization of Interphase Chromosomes. Cell. 2013;152:1270–1284. - PubMed
    1. Chamberlain SJ, Yee D, Magnuson T. Polycomb repressive complex 2 is dispensable for maintenance of embryonic stem cell pluripotency. Stem Cells. 2008;26:1496–1505. - PMC - PubMed
    1. de Wit E, de Laat W. A decade of 3C technologies: insights into nuclear organization. Genes & development. 2012;26:11–24. - PMC - PubMed

Publication types

Associated data