. 2013 Dec;62(12):1850-7.
doi: 10.1016/j.metabol.2013.08.003. Epub 2013 Sep 12.

Early detection of liver steatosis by magnetic resonance imaging in rats infused with glucose and intralipid solutions and correlation to insulin levels

Affiliations

Early detection of liver steatosis by magnetic resonance imaging in rats infused with glucose and intralipid solutions and correlation to insulin levels

Gaspard d'Assignies et al. Metabolism. 2013 Dec.

Abstract

Objective: Magnetic resonance (MR) techniques allow noninvasive fat quantification. We aimed to investigate the accuracy of MR imaging (MRI), MR spectroscopy (MRS) and histological techniques to detect early-onset liver steatosis in three rat phenotypes assigned to an experimental glucolipotoxic model or a control group.

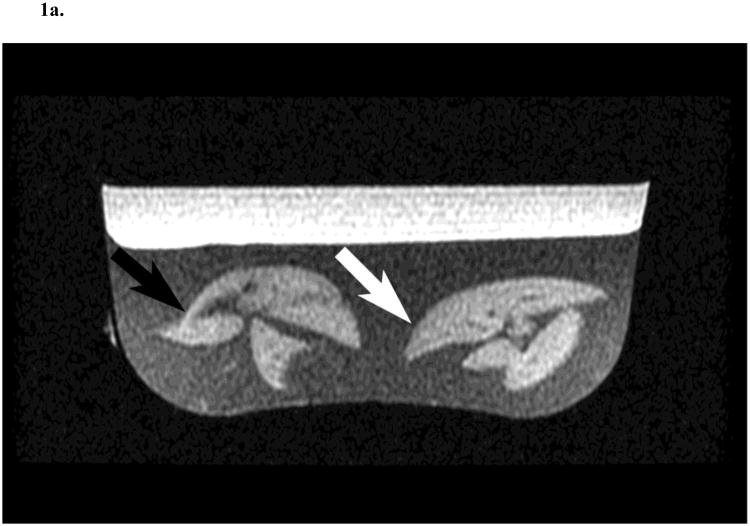
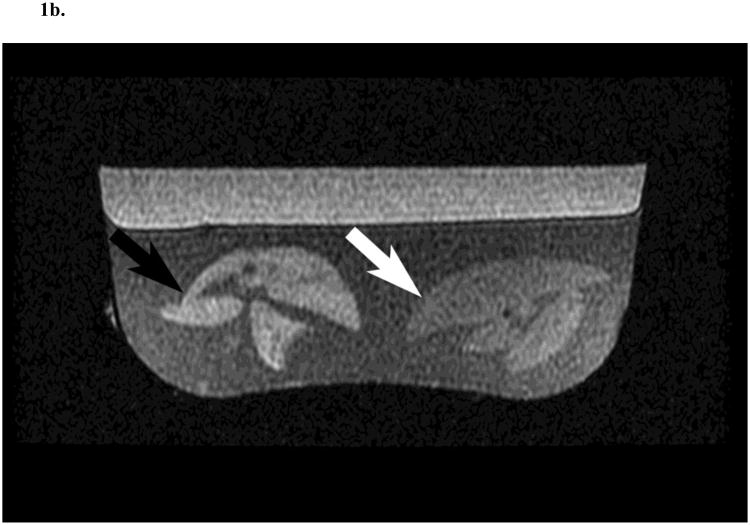
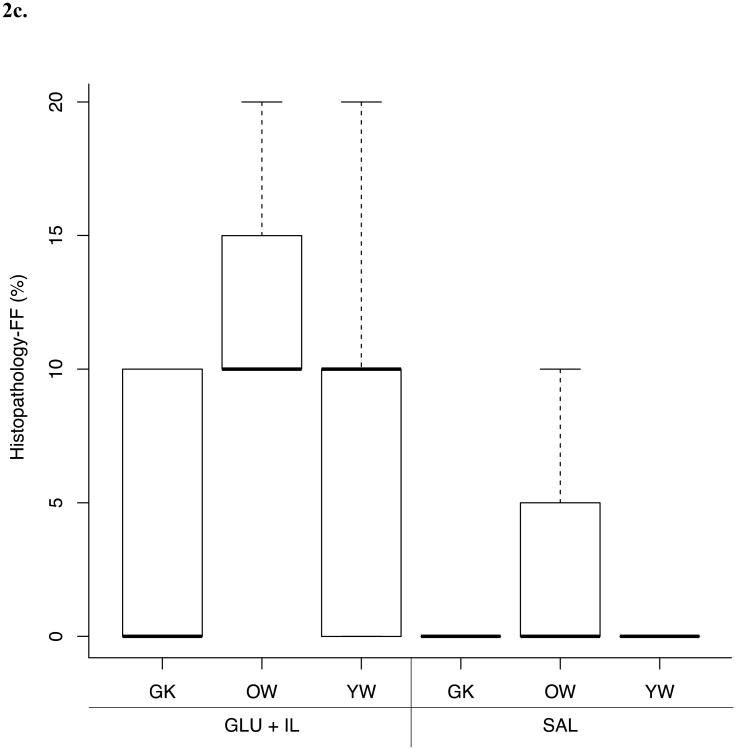
Materials and methods: This study was approved by the institutional committee for the protection of animals. Thirty-two rats (13 young Wistar, 6 old Wistar and 13 diabetic Goto-Kakizaki rats) fed a standard diet were assigned to a 72h intravenous infusion of glucose and Intralipid fat emulsion or a saline infusion. Plasma insulin levels were measured. Steatosis was quantified in ex vivo livers with gradient-recalled multi-echo MRI, MRS and histology as fat fractions (FF).

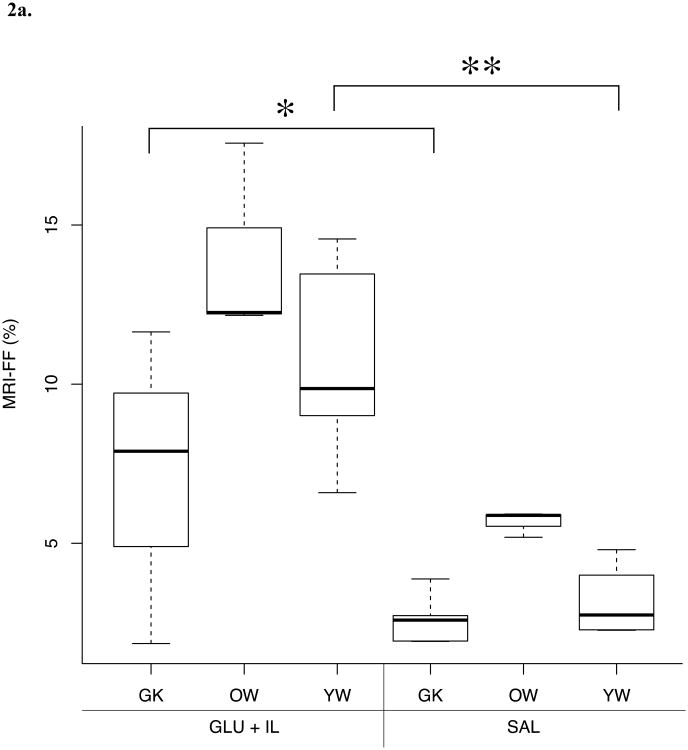
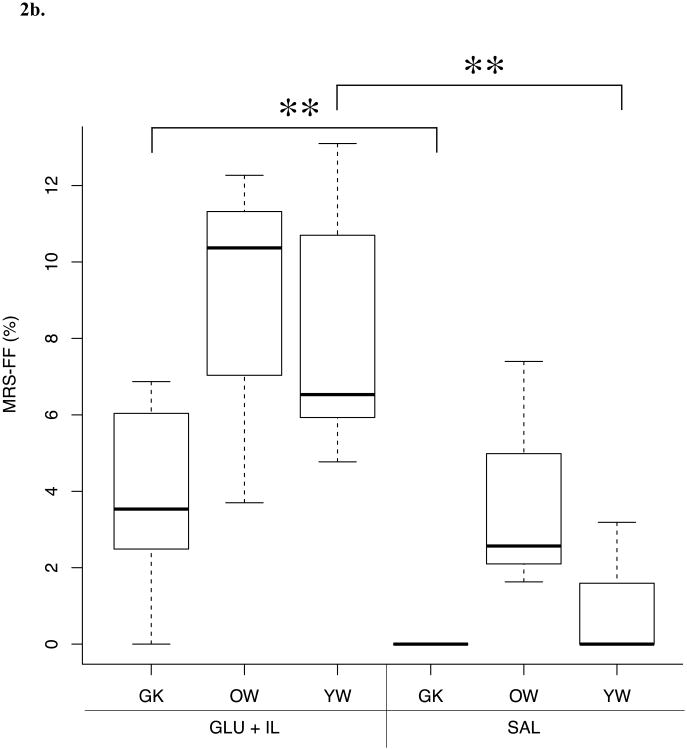
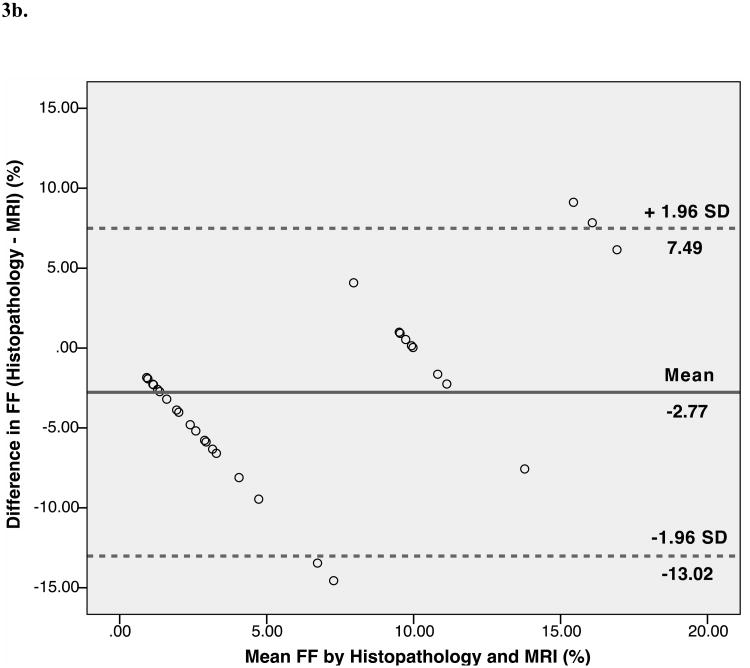
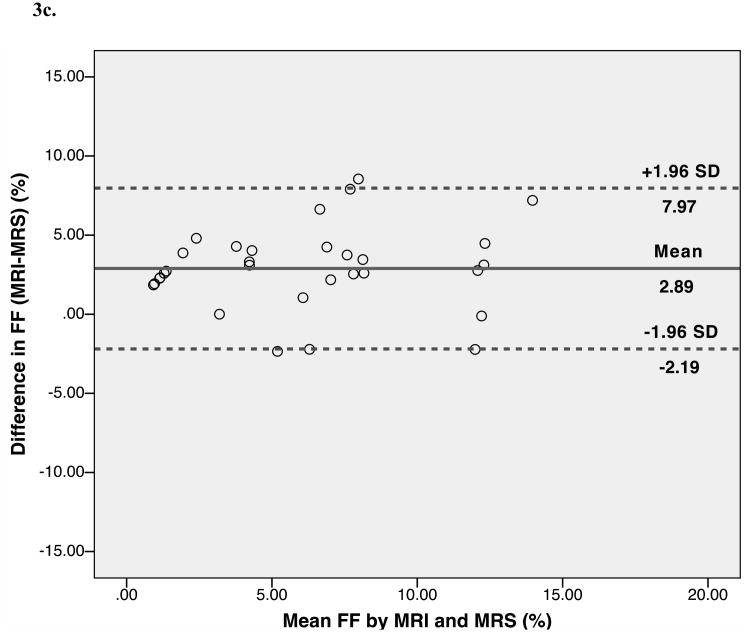
Results: A significant correlation was found between multi-echo MRI-FF and MRS-FF (r=0.81, p<0.01) and a weaker correlation was found between histology and MRS-FF (r=0.60, p<0.01). MRS and MRI accurately distinguished young Wistar and Goto-Kakizaki rats receiving the glucose+Intralipid infusion from those receiving the saline control whereas histology did not. Significant correlations were found between MRI or MRS and insulin plasma level (r=0.63, p<0.01; r=0.57, p<0.01), and between MRI or MRS and C-peptide concentration (r=0.54, p<0.01; r=0.44, p<0.02).

Conclusions: Multi-echo MRI and MRS may be more sensitive to measure early-onset liver steatosis than histology in an experimental glucolipotoxic rat model.

Keywords: Diabetes mellitus; FF; Fat fraction; GLU+IL; Glucose+Intralipid; Hepatic steatosis; IP; In-phase; Insulin; MR; MRI; MRS; Magnetic resonance; Magnetic resonance imaging; Magnetic resonance spectroscopy; NAFLD; NASH; Nonalcoholic fatty liver disease; Nonalcoholic steatohepatitis; OP; Opposed-phase; ROC; Receiver operating characteristic; SAL; Saline.


Conflict of interest statement

Disclosure statement: We have no conflict of interest to report.

Figures

Fig. 1
Fig. 1
Two rat liver specimens prepared in agar and imaged with gradient-echo in-phase (4.5 ms echo time) (A) and out-of-phase (2.2 ms echo time) (B) sequences in a clinical 1.5 T MR scanner. The rat liver on the left was collected following saline (SAL; black arrow) infusion and the other following glucose and Intralipid (GLU + IL; white arrow) fat emulsion infusion. T2* corrected fat fractions were 4.8 % for SAL and 15.9 % for GLU + IL.
Fig. 1
Fig. 1
Two rat liver specimens prepared in agar and imaged with gradient-echo in-phase (4.5 ms echo time) (A) and out-of-phase (2.2 ms echo time) (B) sequences in a clinical 1.5 T MR scanner. The rat liver on the left was collected following saline (SAL; black arrow) infusion and the other following glucose and Intralipid (GLU + IL; white arrow) fat emulsion infusion. T2* corrected fat fractions were 4.8 % for SAL and 15.9 % for GLU + IL.
Fig. 2
Fig. 2
Boxplots of liver fat fraction (%) as determined by magnetic resonance imaging (MRI) (A), magnetic resonance spectroscopy (MRS) (B) and histopathology (C) for the three rat phenotypes: young Wistar (YW), old Wistar (OW) and Goto-Kakizaki (GK) infused with two types of solution: saline control (SAL) and glucose + Intralipid fat emulsion (GLU+IL). Boxplots show median (horizontal lines in boxes) and quartiles. Whiskers extend to the most extreme observations that are not more than 1.5 × interquartile range beyond the quartiles. *p < 0.05, ** p < 0.01.
Fig. 2
Fig. 2
Boxplots of liver fat fraction (%) as determined by magnetic resonance imaging (MRI) (A), magnetic resonance spectroscopy (MRS) (B) and histopathology (C) for the three rat phenotypes: young Wistar (YW), old Wistar (OW) and Goto-Kakizaki (GK) infused with two types of solution: saline control (SAL) and glucose + Intralipid fat emulsion (GLU+IL). Boxplots show median (horizontal lines in boxes) and quartiles. Whiskers extend to the most extreme observations that are not more than 1.5 × interquartile range beyond the quartiles. *p < 0.05, ** p < 0.01.
Fig. 3
Fig. 3
Bland-Altman plots show the difference between the percentage of hepatocytes with macrovesicular steatosis as determined by histopathology and magnetic resonance spectroscopy (MRS)-determined fat fraction plotted against their mean (A), between histopathology and magnetic resonance imaging (MRI) fat fractions (B), and between the MRI and the MRS fat fractions (C) in rat livers. The central lines indicate bias, and outer lines indicate limits of agreement (±1.96 standard deviations).
Fig. 3
Fig. 3
Bland-Altman plots show the difference between the percentage of hepatocytes with macrovesicular steatosis as determined by histopathology and magnetic resonance spectroscopy (MRS)-determined fat fraction plotted against their mean (A), between histopathology and magnetic resonance imaging (MRI) fat fractions (B), and between the MRI and the MRS fat fractions (C) in rat livers. The central lines indicate bias, and outer lines indicate limits of agreement (±1.96 standard deviations).

References

    1. Shibata M, Kihara Y, Taguchi M, et al. Nonalcoholic fatty liver disease is a risk factor for type 2 diabetes in middle-aged japanese men. Diabetes Care. 2007;30(11):2940–4. - PubMed
    1. Bae JC, Rhee EJ, Lee WY, et al. Combined effect of nonalcoholic fatty liver disease and impaired fasting glucose on the development of type 2 diabetes: A 4-year retrospective longitudinal study. Diabetes Care. 2011;34(3):727–9. - PMC - PubMed
    1. Kotronen A, Juurinen L, Hakkarainen A, et al. Liver fat is increased in type 2 diabetic patients and underestimated by serum alanine aminotransferase compared with equally obese nondiabetic subjects. Diabetes Care. 2008;31(1):165–9. - PubMed
    1. Younossi ZM, Otgonsuren M, Venkatesan C, et al. In patients with non-alcoholic fatty liver disease, metabolically abnormal individuals are at a higher risk for mortality while metabolically normal individuals are not. Metabolism. 2013;62(3):352–60. - PubMed
    1. Adams LA, Talwalkar JA. Diagnostic evaluation of nonalcoholic fatty liver disease. J Clin Gastroenterol. 2006;40(3 Suppl 1):S34–8. - PubMed

Publication types

MeSH terms