. 2013 Sep 26;51(6):819-28.
doi: 10.1016/j.molcel.2013.08.016. Epub 2013 Sep 12.

Proteasomes activate aggresome disassembly and clearance by producing unanchored ubiquitin chains

Affiliations

Proteasomes activate aggresome disassembly and clearance by producing unanchored ubiquitin chains

Rui Hao et al. Mol Cell. .

Abstract

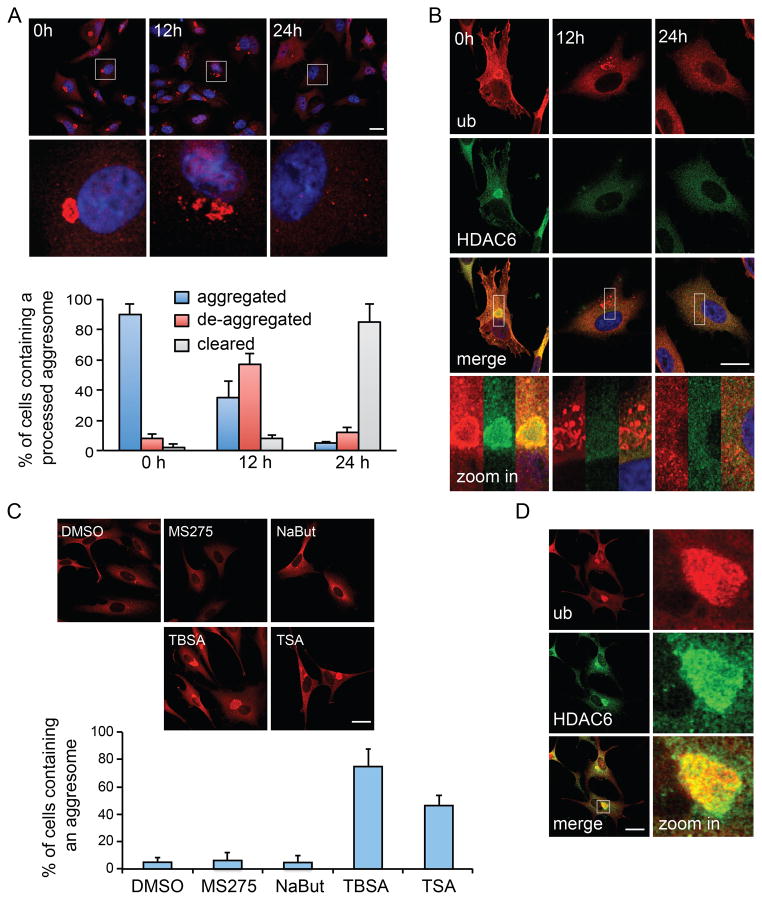
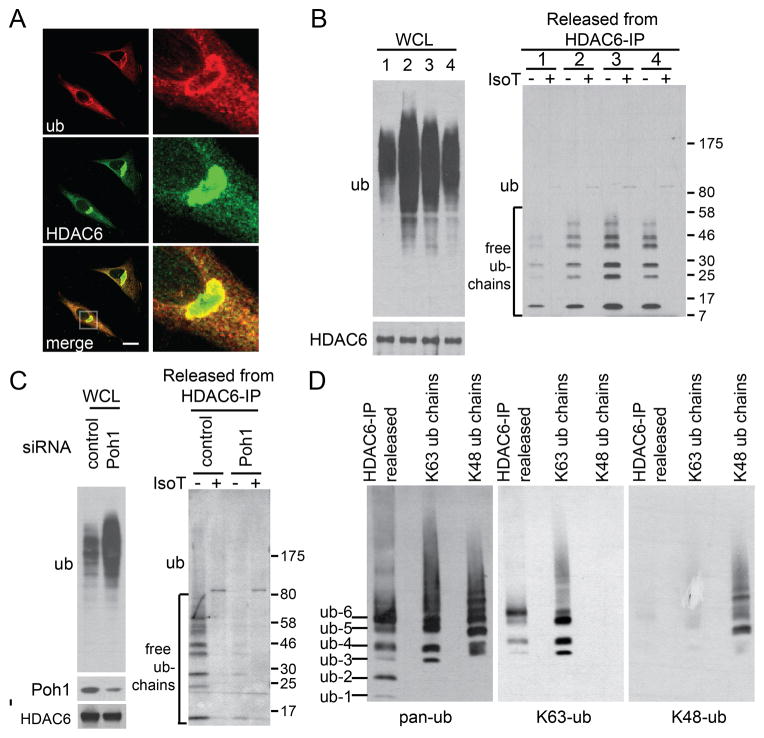
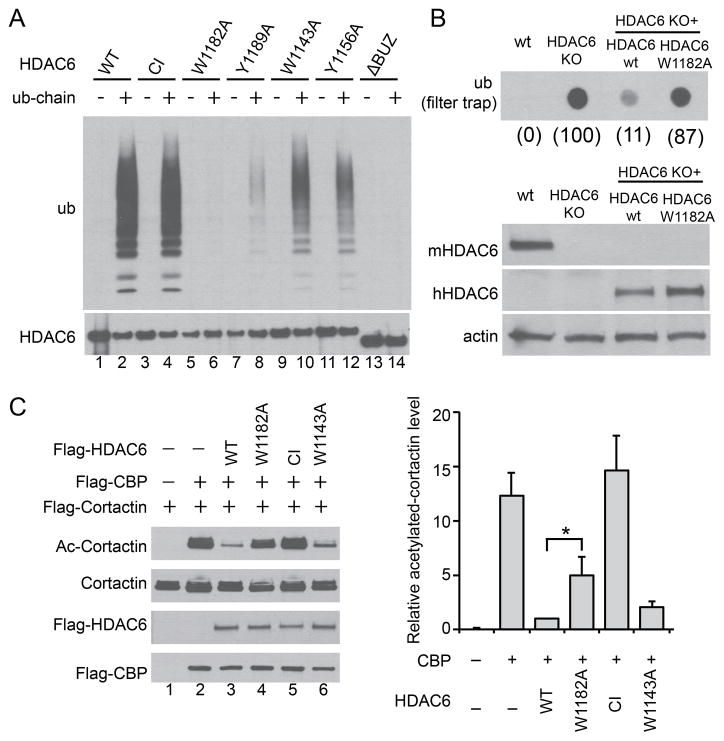
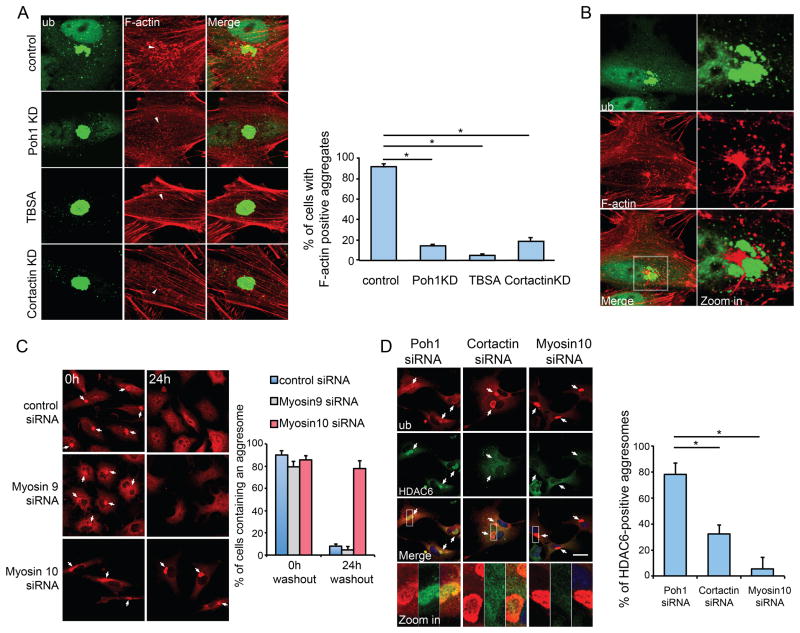
Aberrant protein aggregation is a dominant pathological feature in neurodegenerative diseases. Protein aggregates cannot be processed by the proteasome; instead, they are frequently concentrated to the aggresome, a perinuclear inclusion body, and subsequently removed by autophagy. Paradoxically, proteasomes are also concentrated at aggresomes and other related inclusion bodies prevalent in neurodegenerative disease. Here, we show that proteasomes are crucial components in aggresome clearance. The disassembly and disposal of aggresomes requires Poh1, a proteasomal deubiquitinating enzyme that cleaves ubiquitinated proteins and releases ubiquitin chains. In Poh1-deficient cells, aggresome clearance is blocked. Remarkably, microinjection of free lysine (K) 63-linked ubiquitin chains restores aggresome degradation. We present evidence that free ubiquitin chains produced by Poh1 bind and activate the deacetylase HDAC6, which, in turn, stimulates actinomyosin- and autophagy-dependent aggresome processing. Thus, unanchored ubiquitin chains are key signaling molecules that connect and coordinate the proteasome and autophagy to eliminate toxic protein aggregates.


Figures

Figure 1
Figure 1. HDAC6 is required for aggresome de-aggregation and clearance
A549 cells were treated with MG132 (5 μM) for 24h to induce aggresome formation, followed by MG132-free medium for the indicated times. Aggresomes were identified by staining with an antibody against ubiquitin (ub, clone FK1). (A) Ubiquitin immuno-staining (red) indicates that the large aggresomes (0h) were de-aggregated (12h) before final clearance (24h). Bottom panels show zoomed areas (white squares). Nuclei were stained with DAPI (blue). The status of aggresomes at different time points after MG132 washout was quantified in the histogram. (B) Representative images of HDAC6 (green) in relationship to the aggresome (red) by double-immuno-staining during MG132 washout. Bottom panels show zoomed areas (white squares). Note that protein aggregates are no longer positive for HDAC6 after 12h washout (middle panels). (C) A549 cells were treated with an HDAC6-selective inhibitor, Tubastatin A (TBSA, 10 μM), pan-HDAC inhibitor, Trichostatin A (TSA, 1 μM), or class I HDAC inhibitors, MS275 (10 μM) or sodium butyrate (NaBut, 1mM) during MG132 washout. The presence of aggresome was analyzed and quantified as described in (A). (D) Representative images of HDAC6 and the aggresome (ub) in TBSA-treated cells. For (A) and (C), three independent experiments were quantified. Error bars show ± S.E.M. Scale bar = 25 μm. See also Figure S1.
Figure 2
Figure 2. Poh1 facilitates aggresome clearance by producing unanchored ubiquitin chains
(A) Immuno-purified FLAG-HDAC6 produced in 293T cells was incubated with unanchored ubiquitin chains (K63-linked Ub 1–7) or ubiquitinated protein (ub-protein, See Methods for details). The input and bound fractions were analyzed by immuno-blotting with the indicated antibodies. (B) A549 cells were transfected with control or Poh1-specific siRNA and treated with MG132 (5 μM, 24 hr) to induce aggresome or followed by MG132 washout as indicated. Aggresomes (marked by arrows) were detected and quantified as described in Fig 1a. Values represent the mean ± S.E.M. n = 3. (C) Poh1 knockdown (KD) cells were treated with MG132 to induce aggresomes followed by MG132 washout in the presence of DMSO or 2.5 μM of nocodazole (Noc.) for 24h. Cells containing aggresomes were quantified and averaged from three independent experiments in the histogram. Note that nocodazole treatment disrupted microtubule networks (α-tubulin, green) but had no effect on aggresome clearance. (D) A549 cells stably expressing shRNA-resistant wild type (wt) or catalytically inactive (CI) H113/115A mutant Poh1 were infected with Poh1-shRNA lentivirus. The percentage of cells containing an aggresome after MG132 washout was analyzed and quantified as described in (B). (E) Poh1 KD cells were pre-treated with MG132 to induce aggresome formation. 3h after MG132 was removed, cells were microinjected with indicated ubiquitin species or BSA mixed with fluorescence-conjugated dextran. The presence of aggresomes was analyzed 21h post-injection. Injected cells were identified by dextran (green, top panels) and marked by white dotted lines (bottom panels). Aggresomes were identified by staining with an antibody specific for K48-linked ubiquitin (red, clone Apu2) and marked by white arrowheads in injected cells. Note that only Poh1 KD cells injected with the K63-linked ubiquitin chains do not contain aggresomes. Non-injected cells retained aggresomes under all conditions (yellow arrowheads) and served as an internal control. Right panel shows the quantification from three independent experiments. 50 to 100 injected cells were scored in each experiment. *, p < 0.01. Error bars indicate ± S.E.M. Scale bar = 25 μm. (F) Control and Poh1 KD A549 cells were treated with 5 μM MG132 for 24h, or MG132 followed by 24h washout in the presence or absence of 10 mM 3-MA as indicated. Detergent insoluble fractions were isolated from whole cell lysates and resolved by SDS-PAGE, followed by immuno-blotting with a K48- or K63- specific ubiquitin antibodies as indicated. Actin is used as a loading control. See also Figure S2, S3, S4 and S8.
Figure 3
Figure 3. HDAC6 binds unanchored ubiquitin chains during aggresome clearance in a Poh1-dependent manner
(A) Representative image of HDAC6 and aggresome (ub) in Poh1 KD cells 24h after MG132 washout. (B) FLAG-HDAC6 was immuno-precipitated under the following conditions: 1) no treatment, 2) 5μM MG132 for 24h, 3) 12h MG132 washout, 4) 24h MG132 washout. The immune complexes were subjected to heating, and the eluates were treated with Isopeptidase T (IsoT) as indicated (see Methods for details). Samples were analyzed by immuno-blotting with antibodies for ubiquitin or HDAC6. Note that MG132 washout (conditions 2 to 3) led to a decrease in total ubiquitinated protein levels in whole cell lysate (WCL), but an increase in HDAC6-associated free ubiquitin chains. (C) Free ubiquitin chains associated with HDAC6 in wild type and Poh1 KD cells were assessed 12h after MG132 washout. Note that Poh1 KD led to the accumulation of total ubiquitinated proteins (left panel) but a reduction of HDAC6-associated unanchored ubiquitin chains (right panel). (D) Free ubiquitins chains released from HDAC6-IP components were immuno-blotted using a pan-ubiquitin antibody (pan-ub), K63-specific ubiquitin antibody (K63-ub) and K48-specific ubiquitin antibody (K48-ub) sequentially. Recombinant K63- or K48-linked poly-ubiquitin chains were loaded onto the same gel to validate the specificity of linkage-specific ubiquitin antibodies. See also Figure S5.
Figure 4
Figure 4. Free ubiquitin chains regulate HDAC6 activity
(A) Immuno-purified FLAG-HDAC6 wild type (WT), H215A/H610A catalytic inactive (CI), and various point mutants were incubated with free ubiquitin chains as indicated. The bound fractions were detected by immuno-blotting with an ubiquitin antibody. (B) Upper panel, filter-trap analysis of SDS-insoluble ubiquitinated aggregates accumulated in wild-type (wt), HDAC6 KO, and KO MEFs stably expressing human wild type HDAC6 (wt) or W1182A mutant subject to 24h MG132 washout. The relative ubiquitin signal intensity was quantified and presented in parenthesis under each genotype where HDAC6 KO MEFs was set at 100. Lower panel, whole-cell extracts from indicated cell lines were immuno-blotted using antibodies for human HDAC6 (hHDAC6), mouse HDAC6 (mHDAC6) and actin. (C) Cortactin, the acetyltransferase CBP, and wild type or HDAC6 mutant plasmids were co-transfected into 293T cells as indicated. Cortactin was immuno-precipitated followed by immuno-blotting with an antibody for acetylated (Ac) cortactin or total cortactin. The relative cortactin-acetylation level (Ac-cortactin/cortactin) was quantified by scanning densitometry and presented in the right panel. Error bars indicate ± SD (n=3). The statistical significance was assessed using two-way ANOVA analysis with Dunnett’s test. *, p < 0.05. See also Figure S6.
Figure 5
Figure 5. De-aggregation of the aggresome requires the actinomyosin system
A549 cells were pre-treated with MG132 (5μM) for 24h to induce aggresome formation. (A) Representative images of the aggresome (ubiquitin, green) and F-actin (red, Rhodamine-Phalloidin) 12h after MG132 washout in cells with indicated treatment. In the panels of F-actin, the location of the aggresome is marked by an arrowhead. Right Panel: Cells exhibiting F-actin punctae around the aggresome were quantified from three experiments. Error bars indicate ± S.E.M. *, p < 0.01. (B) Representative staining of F-actin and a de-aggregated aggresome 12h after MG132 washout. The right panel shows the zoomed areas (white squares). (C) A549 cells transfected with the indicated siNRA were imaged 0h or 24h after MG132 washout. Aggresomes (arrows) were detected with anti-ubiquitin antibody (red) and percentage of cells retained an aggresome was quantified from three independent experiments. Error bars show S.E.M. (D) Co-staining of HDAC6 (green) and ubiquitin (red) in cells expressing indicated siRNA 24h after MG132 washout. Arrows mark aggresomes. The right panel shows the quantification of aggresomes that are positive for HDAC6 (n=3). Error bars show ± S.E.M. *, p < 0.01. See also Figure S7.

References

    1. Bennett EJ, Shaler TA, Woodman B, Ryu KY, Zaitseva TS, Becker CH, Bates GP, Schulman H, Kopito RR. Global changes to the ubiquitin system in Huntington’s disease. Nature. 2007;448:704–708. - PubMed
    1. Burnett BG, Pittman RN. The polyglutamine neurodegenerative protein ataxin 3 regulates aggresome formation. Proc Natl Acad Sci U S A. 2005;102:4330–4335. - PMC - PubMed
    1. Butler KV, Kalin J, Brochier C, Vistoli G, Langley B, Kozikowski AP. Rational design and simple chemistry yield a superior, neuroprotective HDAC6 inhibitor, tubastatin A. Journal of the American Chemical Society. 2010;132:10842–10846. - PMC - PubMed
    1. Cooper EM, Cutcliffe C, Kristiansen TZ, Pandey A, Pickart CM, Cohen RE. K63-specific deubiquitination by two JAMM/MPN+ complexes: BRISC-associated Brcc36 and proteasomal Poh1. EMBO J. 2009;28:621–631. - PMC - PubMed
    1. Gallery M, Blank JL, Lin Y, Gutierrez JA, Pulido JC, Rappoli D, Badola S, Rolfe M, Macbeth KJ. The JAMM motif of human deubiquitinase Poh1 is essential for cell viability. Molecular cancer therapeutics. 2007;6:262–268. - PubMed

Publication types

MeSH terms