. 2013 Oct 25;288(43):31370-85.
doi: 10.1074/jbc.M113.463877. Epub 2013 Sep 13.

β-Adrenergic receptors activate exchange protein directly activated by cAMP (Epac), translocate Munc13-1, and enhance the Rab3A-RIM1α interaction to potentiate glutamate release at cerebrocortical nerve terminals

Affiliations

β-Adrenergic receptors activate exchange protein directly activated by cAMP (Epac), translocate Munc13-1, and enhance the Rab3A-RIM1α interaction to potentiate glutamate release at cerebrocortical nerve terminals

Jose J Ferrero et al. J Biol Chem. .

Abstract

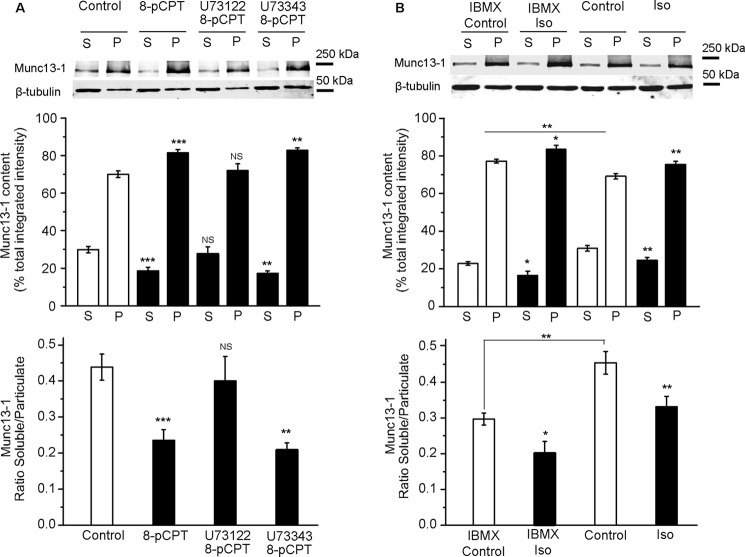
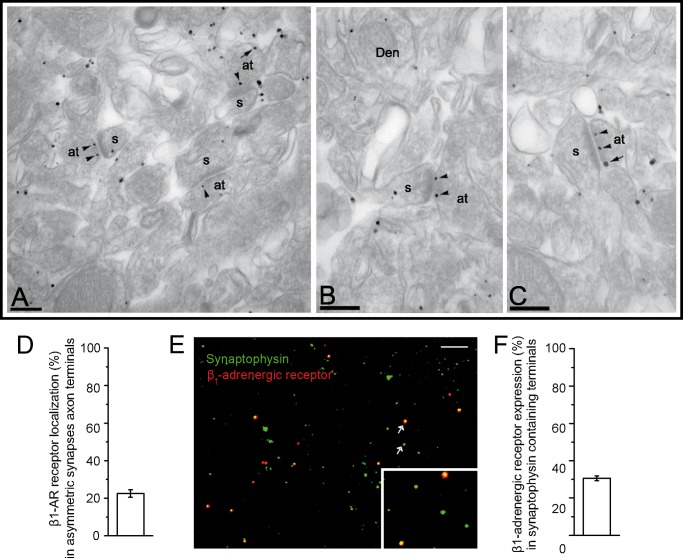
The adenylyl cyclase activator forskolin facilitates synaptic transmission presynaptically via cAMP-dependent protein kinase (PKA). In addition, cAMP also increases glutamate release via PKA-independent mechanisms, although the downstream presynaptic targets remain largely unknown. Here, we describe the isolation of a PKA-independent component of glutamate release in cerebrocortical nerve terminals after blocking Na(+) channels with tetrodotoxin. We found that 8-pCPT-2'-O-Me-cAMP, a specific activator of the exchange protein directly activated by cAMP (Epac), mimicked and occluded forskolin-induced potentiation of glutamate release. This Epac-mediated increase in glutamate release was dependent on phospholipase C, and it increased the hydrolysis of phosphatidylinositol 4,5-bisphosphate. Moreover, the potentiation of glutamate release by Epac was independent of protein kinase C, although it was attenuated by the diacylglycerol-binding site antagonist calphostin C. Epac activation translocated the active zone protein Munc13-1 from soluble to particulate fractions; it increased the association between Rab3A and RIM1α and redistributed synaptic vesicles closer to the presynaptic membrane. Furthermore, these responses were mimicked by the β-adrenergic receptor (βAR) agonist isoproterenol, consistent with the immunoelectron microscopy and immunocytochemical data demonstrating presynaptic expression of βARs in a subset of glutamatergic synapses in the cerebral cortex. Based on these findings, we conclude that βARs couple to a cAMP/Epac/PLC/Munc13/Rab3/RIM-dependent pathway to enhance glutamate release at cerebrocortical nerve terminals.

Keywords: Cyclic AMP (cAMP); Epac Proteins; G Protein-coupled Receptors (GPCR); Munc13–1; Neurotransmitter Release; Phospholipase C; RIM1α; Rab3A; Synaptosomes.


Figures

FIGURE 1.
FIGURE 1.
Tetrodotoxin isolates a PKA-independent component of forskolin-potentiated glutamate release. The Ca2+-dependent release of glutamate induced by 5 mm KCl (A and B), the spontaneous release of glutamate in the presence of 1 μm tetrodotoxin (C and D), and the glutamate release induced by the Ca2+ ionophore ionomycin (0.5–1 μm) in the presence or absence of 1 μm tetrodotoxin added 2 min prior to ionomycin (E and F) were measured in the absence and presence of forskolin and in the absence and presence of the PKA inhibitor H-89. Forskolin (15 μm) was added 1 min prior to ionomycin. In experiments with the PKA inhibitor H-89 (10 μm), synaptosomes were incubated with the drug for 30 min. B, D, and F, diagrams summarizing the data pertaining to the potentiation of release under different conditions. Control release corresponds to that induced by 5 mm KCl, tetrodotoxin, ionomycin or by tetrodotoxin plus ionomycin alone. The specific PKA activator 6-Bnz-cAMP (500 μm) was added 1 min prior to ionomycin. Data represent the mean ± S.E. (error bars). NS, not significant (p > 0.05); ***, p < 0.001, compared with the control (symbols inside the bars) or with other conditions as indicated in the figure.
FIGURE 2.
FIGURE 2.
The activation of β-adrenergic receptors and the Epac protein enhances PKA-independent glutamate release. A, glutamate release was induced by the Ca2+ ionophore ionomycin (0.5–1 μm) in the presence of tetrodotoxin (TTx; 1 μm), added 2 min prior to ionomycin. The vacuolar ATPase inhibitor bafilomycin was added at 1 μm for 45 min. The βAR agonist isoproterenol (Iso; 100 μm) and the specific Epac activator 8-pCPT (50 μm) were added 1 min prior to ionomycin. B and D, the diagrams summarize the data pertaining to glutamate release under different conditions. Control release corresponds to that induced by ionomycin alone. The cAMP analog Sp-8-Br-cAMPS (250 μm) and the phosphodiesterase-resistant 8-pCPT analog Sp-8-pCPT were added 1 min prior to ionomycin. The βAR antagonist propanolol (100 μm), the PKA inhibitor H-89 (10 μm), the HCN channel blocker ZD7288 (60 μm), and the GDP-GTP exchange inhibitor brefeldin A (BFA; 100 μm) were added 30 min prior to ionomycin. C, changes in cAMP levels induced by forskolin and isoproterenol. Results are presented as the -fold increase compared with the basal cAMP levels in control synaptosomes (3.3 ± 0.4 pmol/mg). E and F, the addition of forskolin plus 8-pCPT or isoproterenol plus 8-pCPT resulted in a subadditive response indicating occlusion. Diagrams show release induced by forskolin (15 μm), 8-pCPT (50 μm). or isoproterenol (100 μm), alone or in combination (Fsk/8-pCPT or Iso/8-pCPT). Dashed lines, the sum of individual Fsk and 8-pCPT responses or Iso and 8-pCPT responses. Solid lines represent the response when the two activators were added in combination. Data represent the mean ± S.E. (error bars). NS, p > 0.05; **, p < 0.01; ***, p < 0.001 compared with the control (symbols inside the diagram) or the other conditions indicated in the figure.
FIGURE 3.
FIGURE 3.
β-Adrenergic receptors and Epac proteins activate PLC. A, glutamate release was induced by the Ca2+ ionophore ionomycin (0.5–1 μm) in the presence of tetrodotoxin (TTx; 1 μm) added 2 min prior to ionomycin. The βAR agonist isoproterenol (Iso; 100 μm) was added 1 min prior to ionomycin. The PLC inhibitor U73122 (2 μm), the PKC inhibitor calphostin C (0.1 μm), and bisindolylmaleimide (1 μm) were added 30 min prior to the ionomycin. B and C, the diagrams summarize the data pertaining to release potentiation under different conditions. Control release corresponds to that induced by ionomycin alone. The specific Epac activator 8-pCPT (50 μm) was added 1 min prior to ionomycin. The inactive PLC inhibitor U73343 (2 μm) and the calmodulin antagonist calmidazolium (1 μm) were added 30 min prior to ionomycin. D, isoproterenol and 8-pCPT increased the accumulation of IP1. Synaptosomes were incubated for 10 min with isoproterenol (100 μm) and 8-pCPT (50 μm). The PLC inhibitor U73122 (2 μm) was added 30 min prior to isoproterenol or 8-pCPT. The results are presented as the -fold increase relative to the basal IP1 levels in control nerve terminals (4.6 ± 0.4 pmol/mg) and in U73122-treated synaptosomes (2.4 ± 0.3 pmol/mg). The data represent the mean ± S.E. (error bars). NS, p > 0.05; **, p < 0.01; ***, p < 0.001, compared with the control (symbols inside the diagram) or other conditions indicated in the figure.
FIGURE 4.
FIGURE 4.
The activation of β-adrenergic receptors and the Epac protein promotes the translocation of the Munc13-1 protein. Shown is Munc13-1 protein content in the soluble (S) and particulate (P) fractions of control synaptosomes and those stimulated with the specific Epac activator 8-pCPT (50 μm, 10 min) (A) or isoproterenol (100 μm, 10 min) (B) in the presence or absence of active U73122 (2 μm, 30 min) or inactive U73343 (2 μm, 30min). When indicated, the phosphodiesterase inhibitor IBMX (1 mm, 30 min) was added. The top diagrams show the quantification of Munc-13-1 content in the soluble and particulate fractions of the synaptosomes. The sum of the soluble and particulate fraction values was taken as 100%. The ratio of Munc13-1 content in soluble versus particulate fractions was calculated in each experiment and is shown in the bottom panels. The data represent the mean ± S.E. (error bars). NS, p > 0.05; *, p < 0.05; **, p < 0.01; ***, p < 0.001 compared with either the soluble or particulate fraction or the soluble/particulate ratio in control synaptosomes.
FIGURE 5.
FIGURE 5.
Epac activation enhances Rab3A-RIM1α interaction in cerebrocortical synaptosomes. A, co-immunoprecipitation of Rab3A and RIM1α. Cerebrocortical synaptosomes were incubated in the absence or the presence of 8-pCPT (50 μm) and in the absence and presence of the PLC inhibitor U73122 (2 μm), solubilized and subjected to immunoprecipitation with mouse anti-FLAG antibody (4 μg; IP: IgGm), mouse anti-Rab3A antibody (4 μg; IP: Rab3A), rabbit anti-FLAG antibody (4 μg; IP: IgGr), and rabbit anti-RIM1α antibody (4 μg; IP: Rim1α). Extracts (Crude) and immunoprecipitates (IP) were analyzed in Western blots (IB) probed with mouse anti-Rab3A antibody (1 μg/ml). Immunoreactive bands were detected as described under “Experimental Procedures.” B, quantification of 8-pCPT-induced Rab3A-Rim1α interaction in the absence and presence of U73122. The ratio between Rab3A immunoprecipitated with anti-Rim1α and anti-Rab3A (IP ratio) was calculated and normalized to the IP ratio found in the untreated cerebrocortical synaptosomes (Control). Data are expressed as the mean ± S.E. of three independent experiments. Asterisks indicate data significantly different from the control condition. NS, p > 0.05; *, p < 0.01.
FIGURE 6.
FIGURE 6.
β-Adrenergic receptor and Epac activators increase the proportion of synaptic vesicles close to the active zone. Shown are electron micrographs of cortical synaptosomes in control conditions (A) and after treatment with isoproterenol (100 μm, 10 min) (B) or 8-pCPT (50 μm, 10 min) (C). D, mean number of total SVs per active zone. Shown are quantifications of the spatial distribution of SVs per active zone in synaptosomes treated with isoproterenol (E) or 8-pCPT (F). Scale bar, 150 nm. G, cumulative probability of the isoproterenol and 8-pCPT effects on the percentage of SVs closer than 10 nm to the active zone plasma membrane. Data represent the mean ± S.E. (error bars). NS, p > 0.05; *, p < 0.05; **, p < 0.01; ***, p < 0.001 compared with the corresponding control values.
FIGURE 7.
FIGURE 7.
β1-Adrenergic receptor subunits are mainly localized at presynaptic sites in the cortex. A–C, representative images of the βAR in layers III–V of the cortex detected by pre-embedding immunogold staining. Immunoparticles for the β1AR were mainly detected at the active zone (arrowheads) and along the extrasynaptic membrane (arrows) of axon terminals (at), where they established excitatory synapses with dendritic spines (s) and at postsynaptic sites on both the spines and dendritic shafts (Den) of cortical pyramidal cells. Scale bars, 0.2 μm. D, quantification of the localization of β1AR subunits (percentage) to asymmetric synapses at axon terminals. E, images show synaptosomes fixed onto polylysine-coated coverslips and double-stained with antisera against the β1AR and the vesicular marker synaptophysin. Data represent the mean ± S.E. (error bars). Scale bar, 10 μm. F, quantification of βAR expression in synaptophysin-containing nerve terminals.
FIGURE 8.
FIGURE 8.
β-Adrenergic receptors potentiate glutamate release at cerebrocortical nerve terminals. Shown is a scheme illustrating the putative signaling pathway activated by βARs. The βAR agonist isoproterenol stimulates the Gs protein, adenylyl cyclase thereby increasing cAMP levels. cAMP in turn activates Epac, which can promote PLC-dependent PIP2 hydrolysis to produce DAG. This DAG activates and translocates Munc13-1, an active zone protein essential for synaptic vesicle priming. Activation of the Epac protein also enhances the interaction between the GTP-binding protein Rab3A and the active zone protein Rim1α. These events promote the subsequent release of glutamate in response to Ca2+ influx. AC, adenylate cyclase.

Similar articles

Cited by

References

    1. Chavez-Noriega L. E., Stevens C. F. (1994) Increased transmitter release at excitatory synapses produced by direct activation of adenylate cyclase in rat hippocampal slices. J. Neurosci. 14, 310–317 - PMC - PubMed
    1. Weisskopf M. G., Castillo P. E., Zalutsky R. A., Nicoll R. A. (1994) Mediation of hippocampal mossy fiber long-term potentiation by cyclic AMP. Science 265, 1878–1882 - PubMed
    1. Capogna M., Gähwiler B. H., Thompson S. M. (1995) Presynaptic enhancement of inhibitory synaptic transmission by protein kinases A and C in the rat hippocampus in vitro. J. Neurosci. 15, 1249–1260 - PMC - PubMed
    1. Herrero I., Sánchez-Prieto J. (1996) cAMP-dependent facilitation of glutamate release by β-adrenergic receptors in cerebrocortical nerve terminals. J. Biol. Chem. 271, 30554–30560 - PubMed
    1. Sakaba T., Neher E. (2001) Preferential potentiation of fast-releasing synaptic vesicles by cAMP at the calyx of Held. Proc. Natl. Acad. Sci. U.S.A. 98, 331–336 - PMC - PubMed

Publication types

MeSH terms