. 2013 Nov:236:15-25.
doi: 10.1016/j.jmr.2013.08.004. Epub 2013 Aug 20.

Moving difference (MDIFF) non-adiabatic rapid sweep (NARS) EPR of copper(II)

Affiliations

Moving difference (MDIFF) non-adiabatic rapid sweep (NARS) EPR of copper(II)

James S Hyde et al. J Magn Reson. 2013 Nov.

Abstract

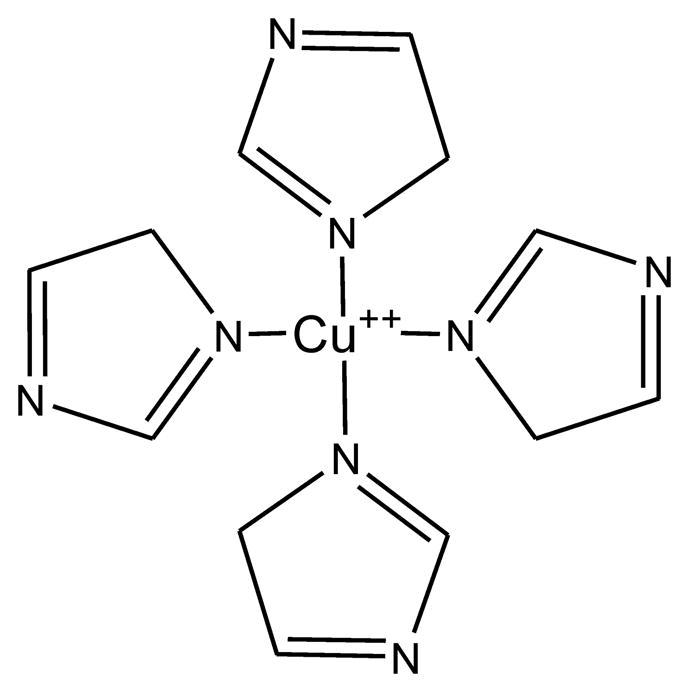
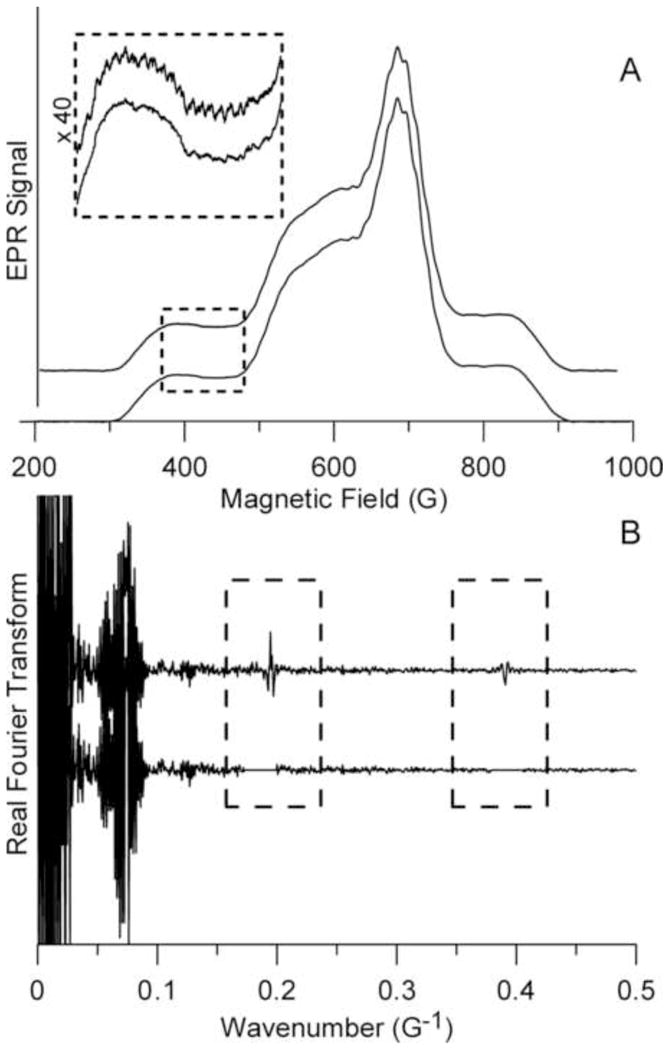
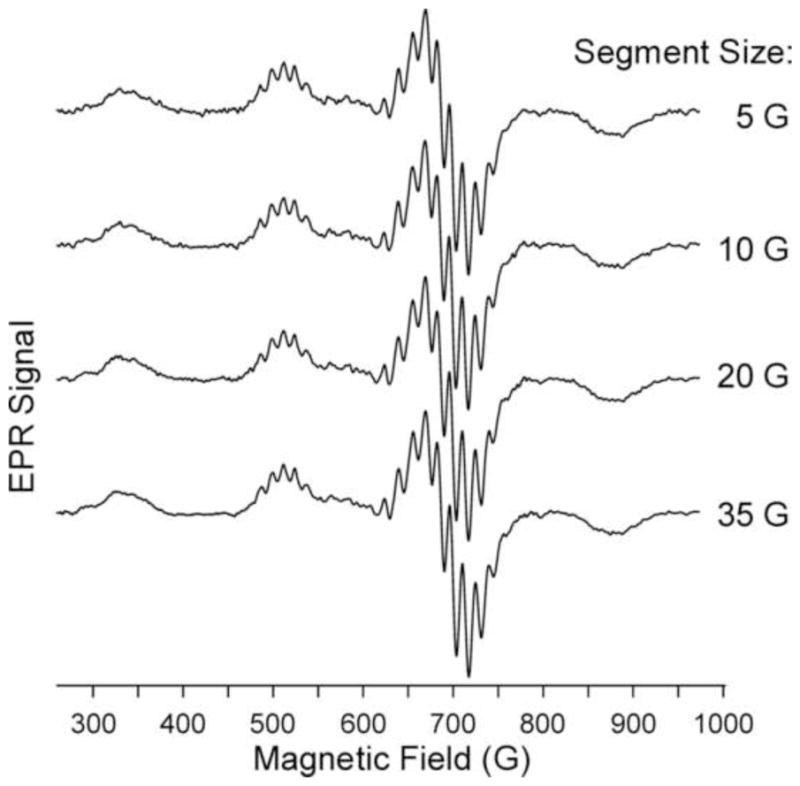
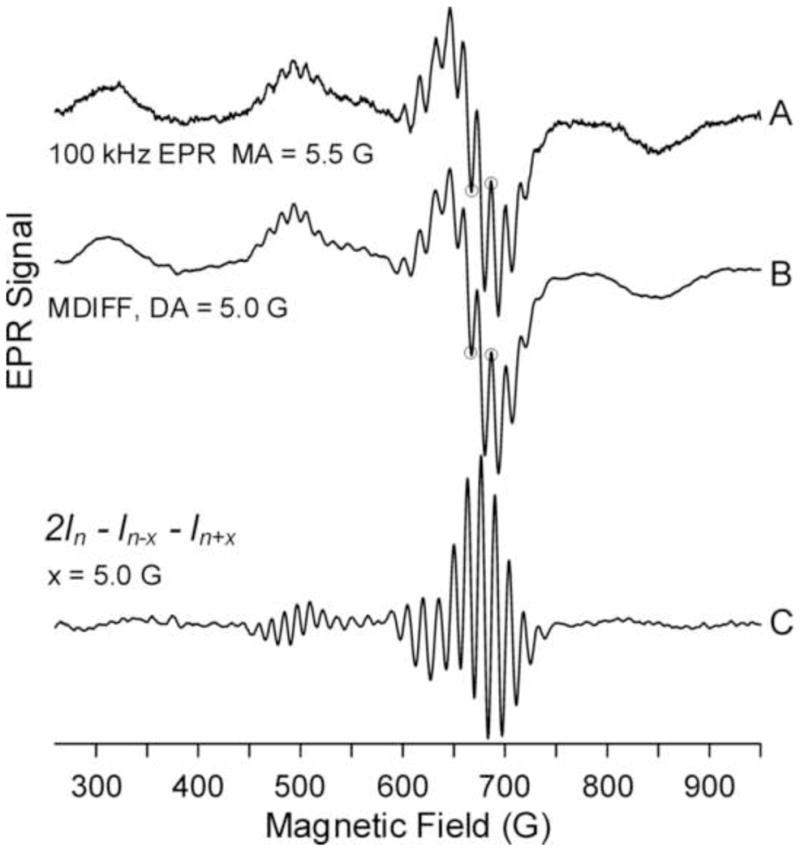
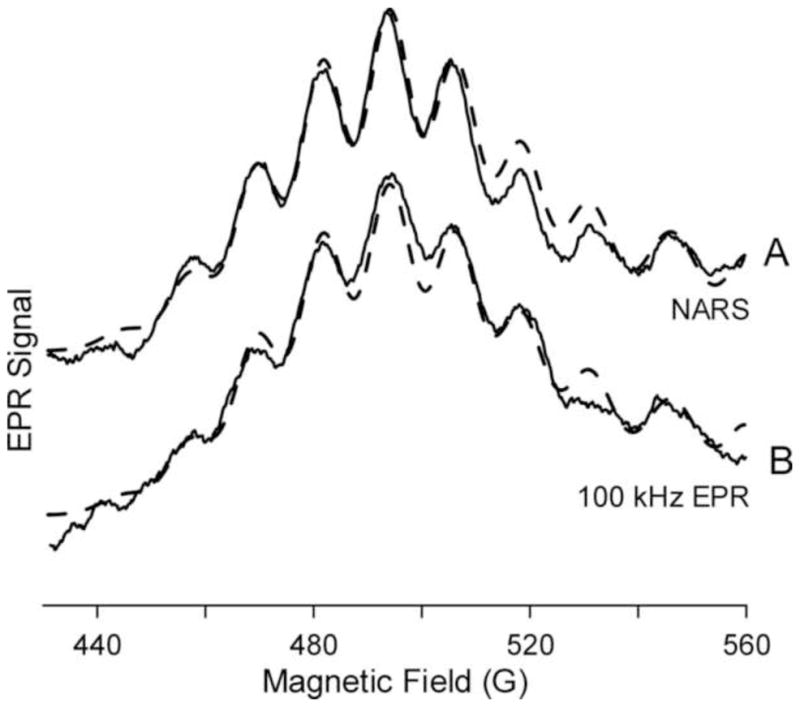
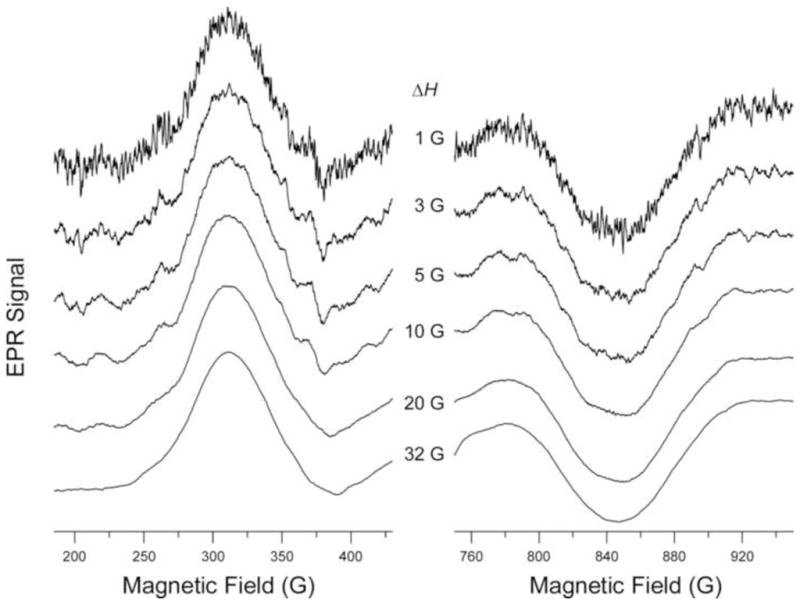
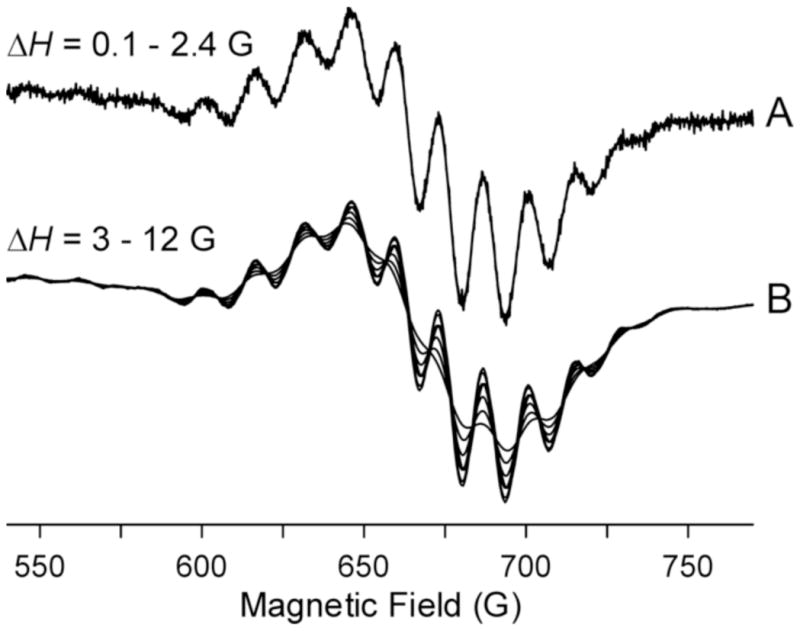
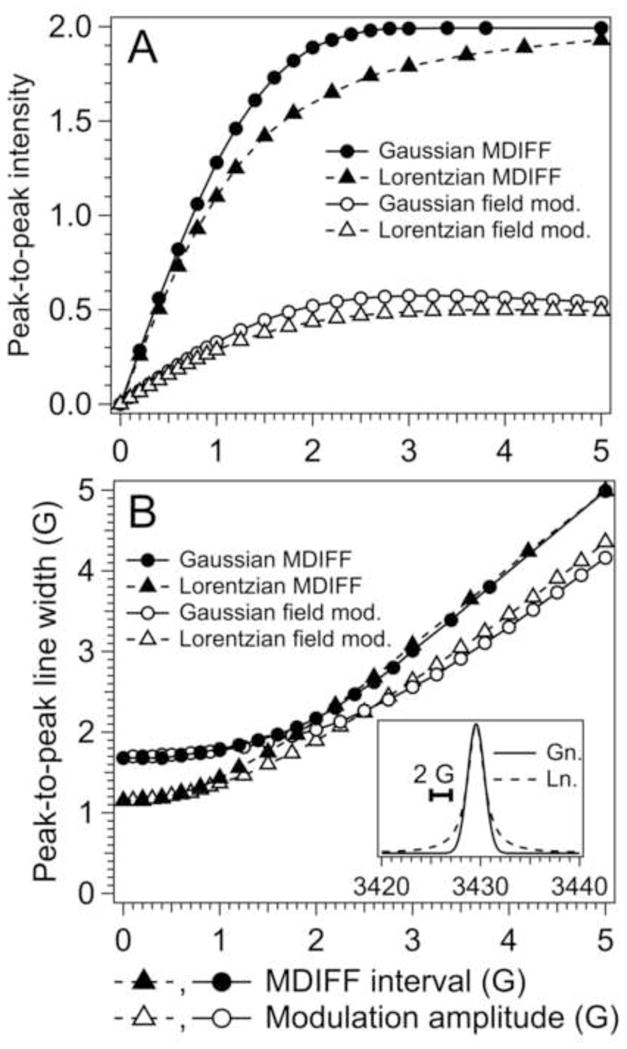
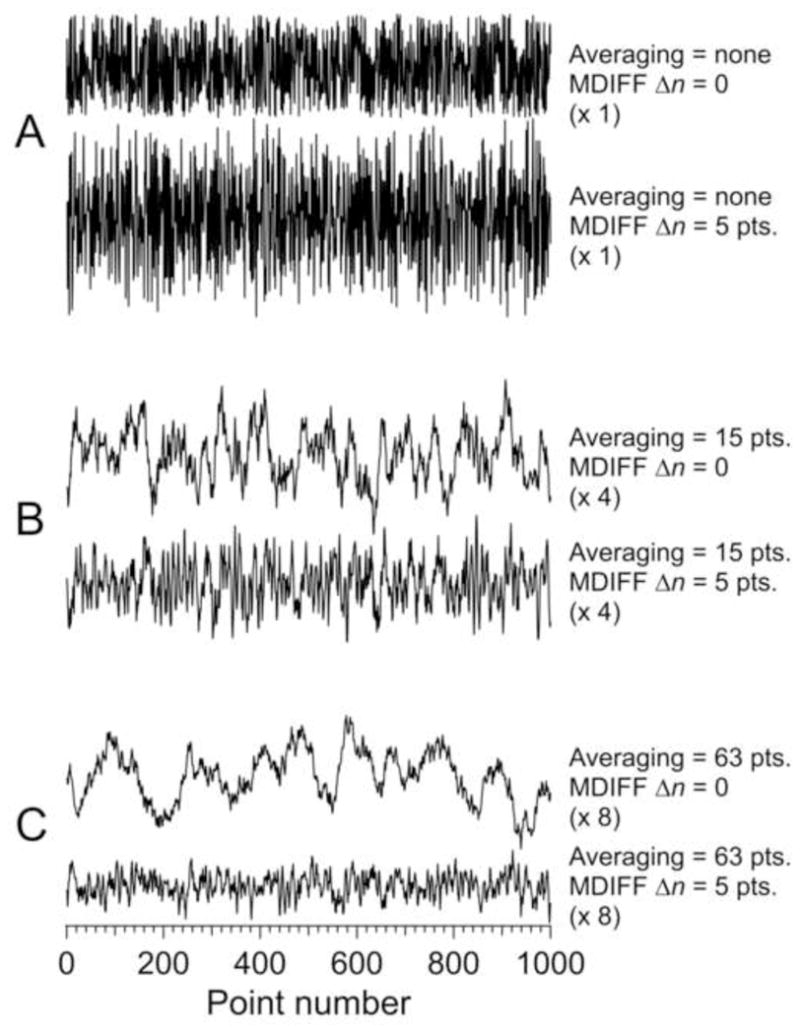
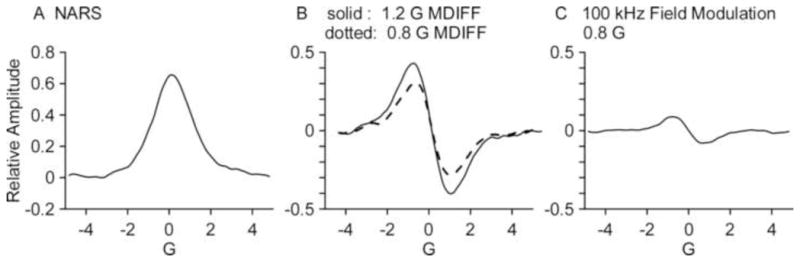
Non-adiabatic rapid sweep (NARS) EPR spectroscopy has been introduced for application to nitroxide-labeled biological samples (Kittell et al., 2011). Displays are pure absorption, and are built up by acquiring data in spectral segments that are concatenated. In this paper we extend the method to frozen solutions of copper-imidazole, a square planar copper complex with four in-plane nitrogen ligands. Pure absorption spectra are created from concatenation of 170 5-gauss segments spanning 850 G at 1.9 GHz. These spectra, however, are not directly useful since nitrogen superhyperfine couplings are barely visible. Application of the moving difference (MDIFF) algorithm to the digitized NARS pure absorption spectrum is used to produce spectra that are analogous to the first harmonic EPR. The signal intensity is about four times higher than when using conventional 100 kHz field modulation, depending on line shape. MDIFF not only filters the spectrum, but also the noise, resulting in further improvement of the SNR for the same signal acquisition time. The MDIFF amplitude can be optimized retrospectively, different spectral regions can be examined at different amplitudes, and an amplitude can be used that is substantially greater than the upper limit of the field modulation amplitude of a conventional EPR spectrometer, which improves the signal-to-noise ratio of broad lines.

Keywords: Biological copper; Direct detection; EPR; ESR; MDIFF; Moving average; NARS; Non-adiabatic rapid sweep.


Figures

Figure 1
Figure 1
The schematic shows CuIm, the equatorial coordination of Cu(II) by imidazole. One or more axially coordinated water or imidazole moieties may also be present, but are not shown.
Figure 2
Figure 2
NARS-EPR spectra of CuIm. Trace A (upper) is the raw NARS spectrum, and Trace B (upper) is the Fourier transform. Trace B (lower) is the Fourier-filtered NARS spectrum, generated by editing the FT as indicated. The dashed box of A shows a low-field region of the raw (upper trace) and Fourier-filtered (lower trace) spectra expanded for clarity. The MDIFF algorithm was applied to Trace A, lower, to produce Figures 3, 4, 5A, 6, and 7.
Figure 3
Figure 3
Three G-MDIFF NARS spectra of CuIm. The segment size used to generate these spectra is indicated. MDIFF NARS was applied to the baseline-subtracted and Fourier-filtered data of Figure 2.
Figure 4
Figure 4
Comparison of NARS and 100 kHz EPR spectra of CuIm. (A) 100 kHz field modulation with PSD. (B) MDIFF NARS. (C) Second finite element derivative.
Figure 5
Figure 5
The MI = −1/2 g|| resonance of CuIm. The solid traces are the 5 G-MDIFF NARS spectrum (A) and the 5 G-field modulated 100 kHz spectrum of CuIm (B). Overlaid upon each is a portion of a complete simulation assuming four equivalent equatorially coordinated nitrogen atoms (dashed traces).
Figure 6
Figure 6
The MI = −3/2 and MI = +3/2 g|| resonances of CuIm. Traces for the low and high field MI = −3/2 and MI = +3/2 features are shown on the left and right, respectively. MDIFF NARS spectra of CuIm with various MDIFF amplitudes, ΔH, are shown. Spectra were divided by the digital difference.
Figure 7
Figure 7
MDIFF NARS spectra on the perpendicular region of CuIm with variable MDIFF amplitudes, ΔH. The figure shows the effect of the difference amplitude on the spectra. Spectra were divided by the digital difference.
Figure 8
Figure 8
Computer simulation of EPR lines as a function of modulation or difference amplitudes. See the insert in B. (A) intensities, (B) line widths. Triangles are Lorentzian and circles are Gaussian lines, each of unit height and unit half-width at half-height. Filled points are MDIFF and open points are field modulation.
Figure 9
Figure 9
Effect of MDIFF on raw and averaged simulated noise. The upper of the A traces shows simulated noise and the lower shows noise after application of the MDIFF algorithm. Traces B show the effect of 15 point smoothing on traces A. Similarly, traces C show the effect of 63 point smoothing on traces A. Some traces were scaled relative to the raw noise. The multiplication factor is shown in parentheses.
Figure 10
Figure 10
Comparison of physical field modulation EPR of the central line of a nitroxide at L-band using 0.8 G modulation amplitude (C) with the NARS spectrum (A) and MDIFF spectra using 0.8 and 1.2 G modulation amplitude (B). Data for A and C are from Ref. [16], but have been further filtered at high frequencies following Figure 9C.

References

    1. Kittell AW, Camenisch TG, Ratke JJ, Sidabras JW, Hyde JS. Detection of undistorted continuous wave (CW) electron paramagnetic resonance (EPR) spectra with non-adiabatic rapid sweep (NARS) of the magnetic field. J Magn Reson. 2011;211:228–233. - PMC - PubMed
    1. Hyde JS, Pasenkiewicz-Gierula M, Jesmanowicz A, Antholine WE. Pseudo field modulation in EPR spectroscopy. Appl Magn Reson. 1990;1:483–496.
    1. Klein MP, Barton GW. Enhancement of signal-to-noise ratio by continuous averaging: application to magnetic resonance. Rev Sci Instrum. 1963;34:754–759.
    1. Ernst RR. Sensitivity enhancement in magnetic resonance. I. Analysis of the method of time averaging. Rev Sci Instrum. 1965;36:1689–1695.
    1. Ernst RR, Anderson WA. Sensitivity enhancement in magnetic resonance. ii. Investigation of intermediate passage conditions. Rev Sci Instrum. 1965;36:1696.

Publication types

LinkOut - more resources