. 2013:4:2469.
doi: 10.1038/ncomms3469.

Human gut microbiota community structures in urban and rural populations in Russia

Affiliations
Free PMC article

Human gut microbiota community structures in urban and rural populations in Russia

Alexander V Tyakht et al. Nat Commun. 2013.
Free PMC article

Abstract

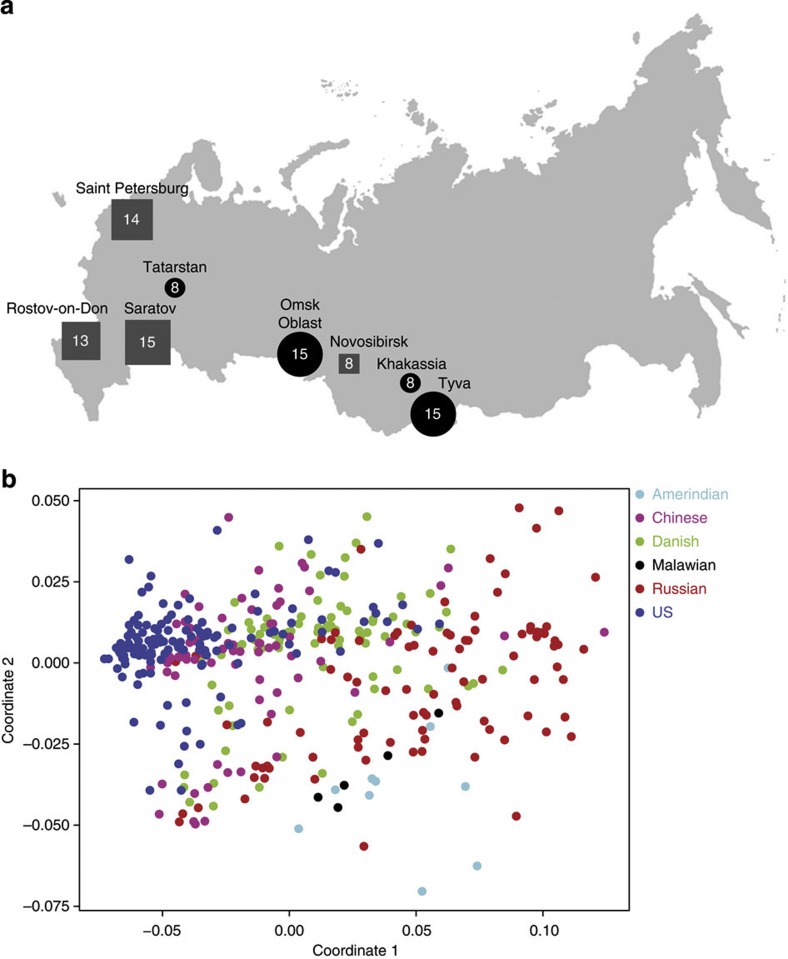
The microbial community of the human gut has a crucial role in sustaining host homeostasis. High-throughput DNA sequencing has delineated the structural and functional configurations of gut metagenomes in world populations. The microbiota of the Russian population is of particular interest to researchers, because Russia encompasses a uniquely wide range of environmental conditions and ethnogeographical cohorts. Here we conduct a shotgun metagenomic analysis of gut microbiota samples from 96 healthy Russian adult subjects, which reveals novel microbial community structures. The communities from several rural regions display similarities within each region and are dominated by the bacterial taxa associated with the healthy gut. Functional analysis shows that the metabolic pathways exhibiting differential abundance in the novel types are primarily associated with the trade-off between the Bacteroidetes and Firmicutes phyla. The specific signatures of the Russian gut microbiota are likely linked to the host diet, cultural habits and socioeconomic status.


Figures

Figure 1
Figure 1. Country-wide sampling highlights distinct features of Russian gut microbiota.
(a) Sampling sites in Russia (n=8). Square and round bullets denote urban and rural areas, with the corresponding size and number inside representing the number of samples obtained at the site. (b) Two dimensional non-metric multidimensional scaling plot based on modified weighted UniFrac metric reveals a gradient structure of taxonomic composition in which Chinese (magenta) and Danish (green) occupy intermediate positions between Russian (red) and US (blue) samples. Two outliers (SAR_274 and NOV_283) with high proportions of Methanobrevibacter, Akkermansia or Escherichia/Shigella were excluded.
Figure 2
Figure 2. Hosts from the same villages form subgroups with similar microbiota.
Heat map showing the relative abundance of major genera (contributing >1% of the total abundance in at least one sample) for three compact subgroups, which are separated by white lines. Clustering was performed using a Spearman’s correlation-based dissimilarity metric and Ward linkage. Row-side label colours denote the samples from the prevalent regions: green–Tatarstan, blue–Omsk, magenta–Tyva and black–other.
Figure 3
Figure 3. Two dimensional non-metric multidimensional scaling (NMDS) plot of Russian metagenomes by taxonomic composition.
UniFrac distances of 96 Russian samples were used in generating the NMDS. Point colour denotes sampling site, whereas shape denotes settlement size.
Figure 4
Figure 4. Assessment of clustering quality for Russian cohort.
There is a dependency between number of clusters in Russian cohort, calculated from three distance matrices (Bray–Curtis, UniFrac and Jensen–Shannon distances) and three quality indices: Calinski–Harabasz (CH), ASW and Prediction Strength (PS). The CH index is plotted, suggesting two as the optimal number of clusters for each distance matrix. For all of the metrics, the ASW values are rather low (below 0.5, which is the suggested threshold value for meaningful clustering5), although the prediction strength is high (above 0.8). The suggested thresholds are plotted in grey.
Figure 5
Figure 5. Overrepresentation of phosphotransferase system genes in Russian samples compared with US and Danish samples.
Overrepresented pathways were identified using Mann–Whitney’s one-sided test with false-discovery rate-adjusted P-values as described in Methods. The KO terms that are differentially abundant between the groups are indicated in colour.

References

    1. O'Hara A. M. & Shanahan F. The gut flora as a forgotten organ. EMBO Rep. 7, 688–693 (2006). - PMC - PubMed
    1. Lagier J.-C., Million M., Hugon P., Armougom F. & Raoult D. Human gut microbiota: repertoire and variations. Front Cell Infect. Microbiol. 2, 136 (2012). - PMC - PubMed
    1. Qin J. et al. A human gut microbial gene catalogue established by metagenomic sequencing. Nature 464, 59–65 (2010). - PMC - PubMed
    1. Wu G. D. et al. Linking long-term dietary patterns with gut microbial enterotypes. Science 334, 105–108 (2011). - PMC - PubMed
    1. Human Microbiome Project Consortium. Structure, function and diversity of the healthy human microbiome. Nature 486, 207–214 (2012). - PMC - PubMed

Publication types