Comparative Study
. 2014 Apr;16(2):235-45.
doi: 10.1007/s11307-013-0686-z.

Comparison of 4D-microSPECT and microCT for murine cardiac function

Affiliations
Comparative Study

Comparison of 4D-microSPECT and microCT for murine cardiac function

Nicholas T Befera et al. Mol Imaging Biol. 2014 Apr.

Abstract

Purpose: The objective of this study was to compare a new generation of four-dimensional micro-single photon emission computed tomography (microSPECT) with microCT for the quantitative in vivo assessment of murine cardiac function.

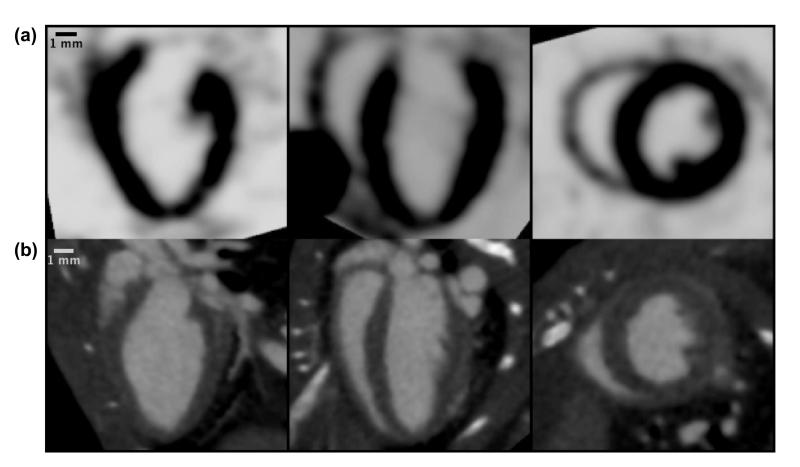
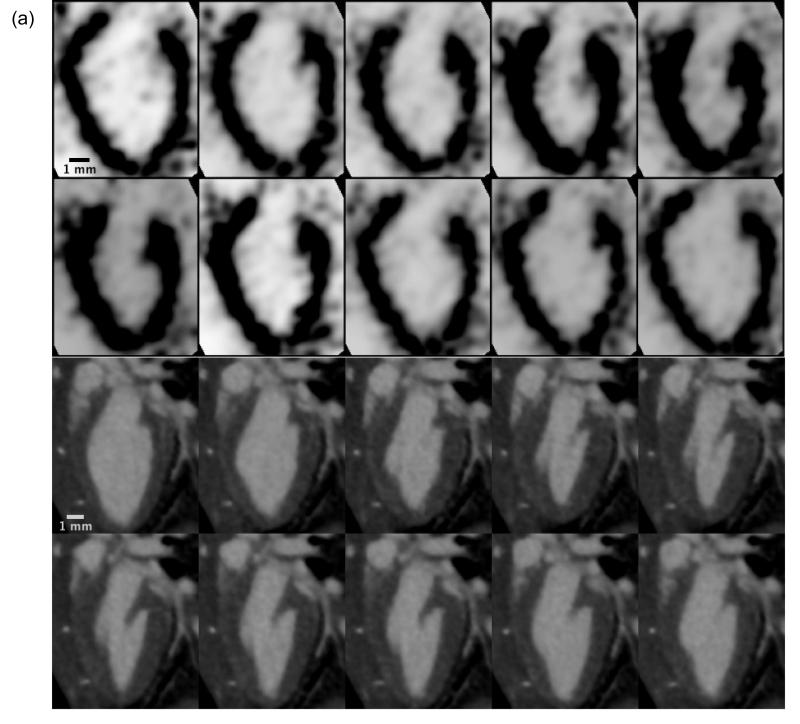
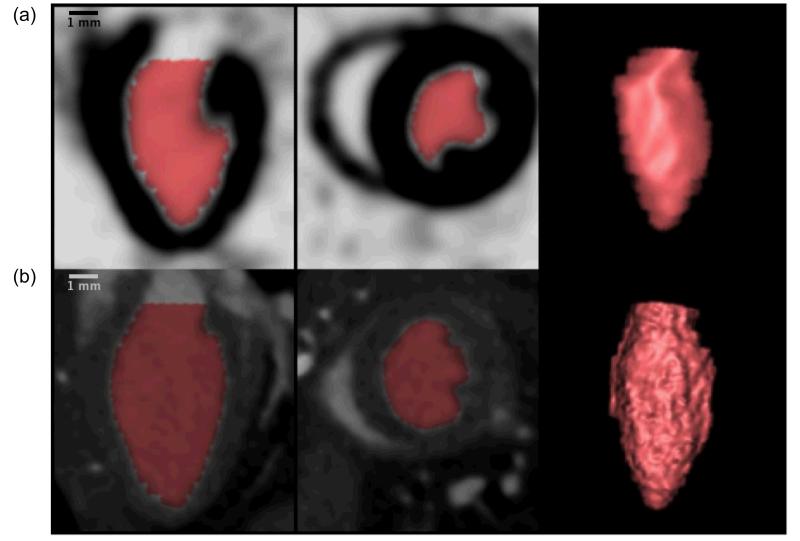
Procedures: Four-dimensional isotropic cardiac images were acquired from anesthetized normal C57BL/6 mice with either microSPECT (n = 6) or microCT (n = 6). One additional mouse with myocardial infarction (MI) was scanned with both modalities. Prior to imaging, mice were injected with either technetium tetrofosmin for microSPECT or a liposomal blood pool contrast agent for microCT. Segmentation of the left ventricle (LV) was performed using Vitrea (Vital Images) software, to derive global and regional function.

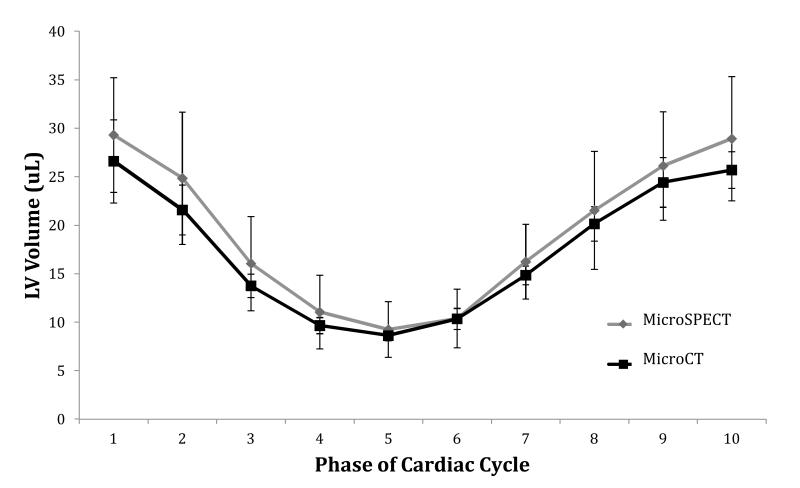
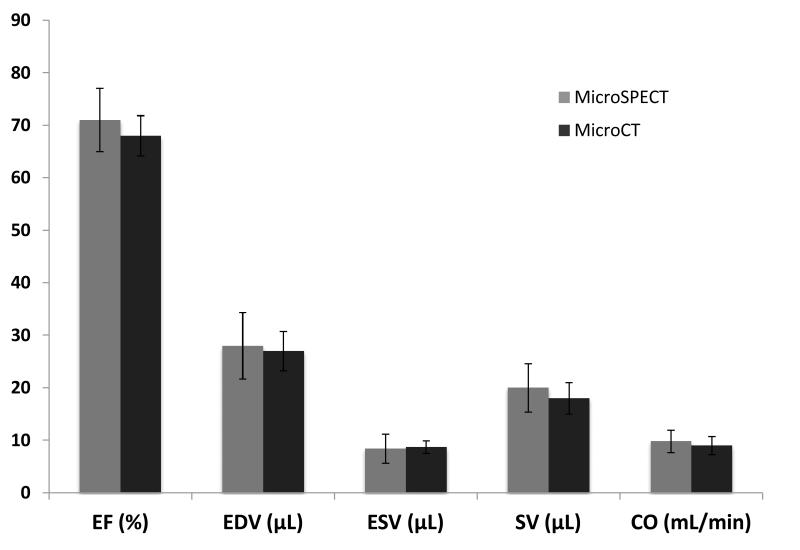
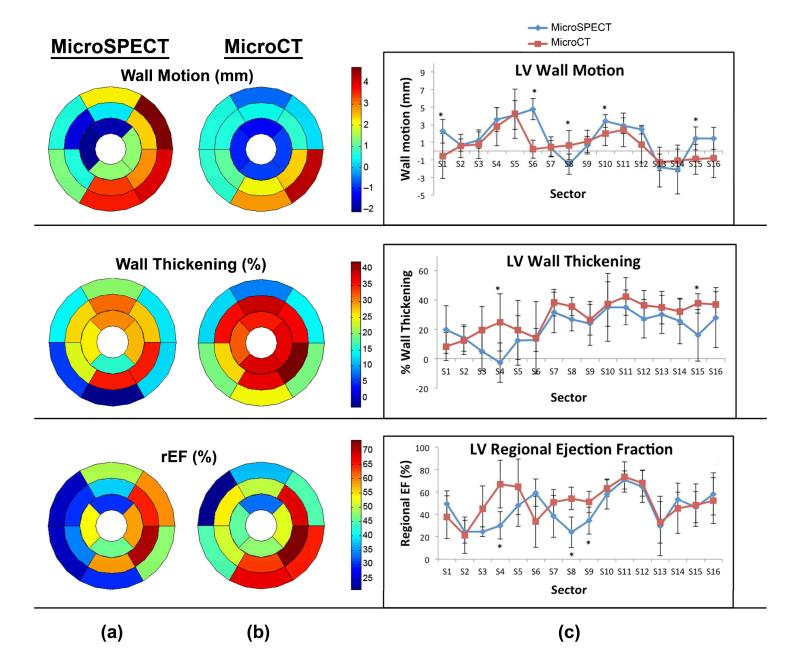
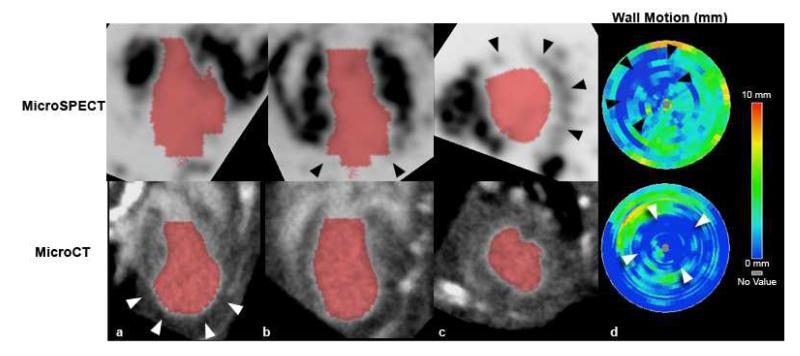
Results: Measures of global LV function between microSPECT and microCT groups were comparable (e.g., ejection fraction = 71 ± 6 % microSPECT and 68 ± 4 % microCT). Regional functional indices (wall motion, wall thickening, regional ejection fraction) were also similar for the two modalities. In the mouse with MI, microSPECT identified a large perfusion defect that was not evident with microCT.

Conclusions: Despite lower spatial resolution, microSPECT was comparable to microCT in the quantitative evaluation of cardiac function. MicroSPECT offers an advantage over microCT in the ability to evaluate simultaneously myocardial radiotracer distribution and function, simultaneously. MicroSPECT should be considered as an alternative to microCT and magnetic resonance for preclinical cardiac imaging in the mouse.


Figures

Figure 1
Figure 1
Comparison of isotropic microSPECT (a) and microCT (b) cardiac datasets as displayed in the Vitrea software, showing three orthogonal views of the mouse heart acquired during diastole. The isotropic datasets are used by Vitrea for volumetric segmentation of the left ventricle.
Figure 2
Figure 2
Dynamic 4D cardiac microSPECT (a) and microCT (b) images showing a single long-axis slice of the murine left ventricle in a sagittal orientation over 10 phases of the cardiac cycle (10 time bins). Each phase represents a distinct 3D isotropic dataset, which are each compiled via retrospective cardiac gating and then used in the 4D volumetric segmentation process in Vitrea.
Figure 3
Figure 3
Sagittal long axis view, axial short axis view, and 3D-rendering of the left ventricle in the mouse from microSPECT (a) and microCT (b) datasets, demonstrating volumetric segmentation of the left ventricle using Vitrea LV functional analysis software. Note the increased detail in the microCT-based 3D rendering, reflective of higher spatial resolution compared with microSPECT.
Figure 4
Figure 4
Comparison of average left ventricle (LV) volume at each of 10 phases of the cardiac cycle in microSPECT and microCT groups. Plotted values represent the mean LV volume of all animals (n=6) in that study group. Error bars represent ± one standard deviation. No significant differences in mean LV chamber volumes were found between the two study groups at any phase of the cardiac cycle.
Figure 5
Figure 5
Comparison of global cardiac functional indices in microSPECT (n=6) and microCT (n=6) groups based on volumetric analysis of the left ventricle (LV) in Vitrea software; bars respresent the average of all animals (n=6) in that study group. No statistically significant differences were found. Error bars represent ± one standard deviation. Mean heart rate was 485±10 for microSPECT and 490±17 for microCT (p=0.53). (EF=ejection fraction; EDV= end-diastolic volume; ESV=end systolic volume: SV=stroke volume; CO=cardiac output)
Figure 6
Figure 6
Regional parameter quantification and comparisons in microSPECT (n=6) and microCT (n=6) groups using Vitrea software. (a, b) Composite bullseye plots for wall motion, wall thickening, and regional ejection fraction are shown, and represent the average values for for all mice in that study group (n=6). (c) Intercomparison of regional functional indices, calculated from 17-sector bullseye plot representations of the left ventricle according to American Heart Association guidelines [33]. Asterisks indicate that a statistically significant difference was found between the two modalities in that sector (p≤.05).
Figure 7
Figure 7
(a-c) MicroSPECT (top) and microCT (bottom) images of the same mouse heart, acquired at approximately 14 days after left-anterior descending (LAD) coronary artery ligation procedure, with resultant myocardial infarction. The infarcted area is visible as a large anterolateral perfusion defect in the microSPECT images (black arrowheads in [b,c]), which is not evident in the microCT images. The microCT images do, however, show some apparent dilation of the apical portion of the left ventricle (white arrowheads in [a]). (d) Bullseye plots of LV regional wall motion for this mouse show distinct apical and LAD territory wall motion abnormalities (arrowheads) in both modalities, consistent with myocardial infarction. These areas of decreased wall motion correspond to the perfusion defect identified by microSPECT (black arrowheads), and the apical dilation seen by microCT (white arrowheads).

References

    1. Abel ED, Litwin SE, Sweeney G. Cardiac remodeling in obesity. Physiol Rev. 2008;88(2):389–419. - PMC - PubMed
    1. Breckenridge R. Heart failure and mouse models. Dis Models Mech. 2010;3(3-4):138–143. - PubMed
    1. Bucholz E, Ghaghada K, Qi Y, Mukundan S, Rockman HA, Johnson GA. Cardiovascular phenotyping of the mouse heart using a 4D radial acquisition and liposomal Gd-DTPA-BMA. Magn Reson Med. 2010;63(4):979–987. - PMC - PubMed
    1. Zaragoza C, Lavin B, Egido J, et al. Animal models of cardiovascular diseases. J Biomed Biotechnol. 20112011:497841. - PMC - PubMed
    1. Constantinides C. Study of the Murine Cardiac Mechanical Function Using Magnetic Resonance Imaging: The Current Status, Challenges, and Future Perspectives. In: Andrade A, editor. Practical Applications in Biomedical Engineering. 2013. ISBN: 978-953-51-0924-2, InTech.

Publication types

LinkOut - more resources