. 2013 Nov;10(11):1108-15.
doi: 10.1038/nmeth.2651. Epub 2013 Sep 15.

Network-based stratification of tumor mutations

Affiliations

Network-based stratification of tumor mutations

Matan Hofree et al. Nat Methods. 2013 Nov.

Abstract

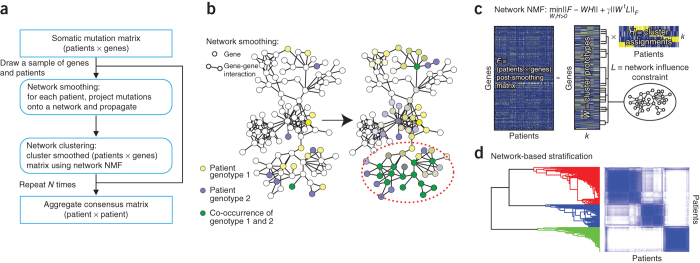
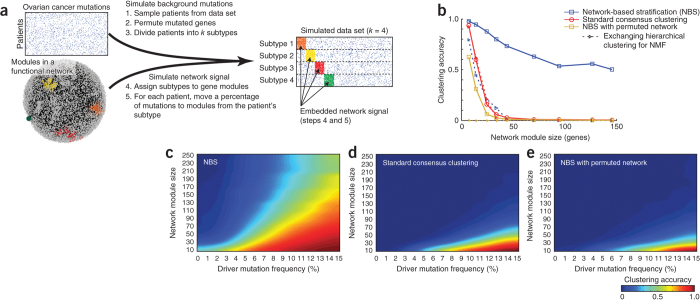
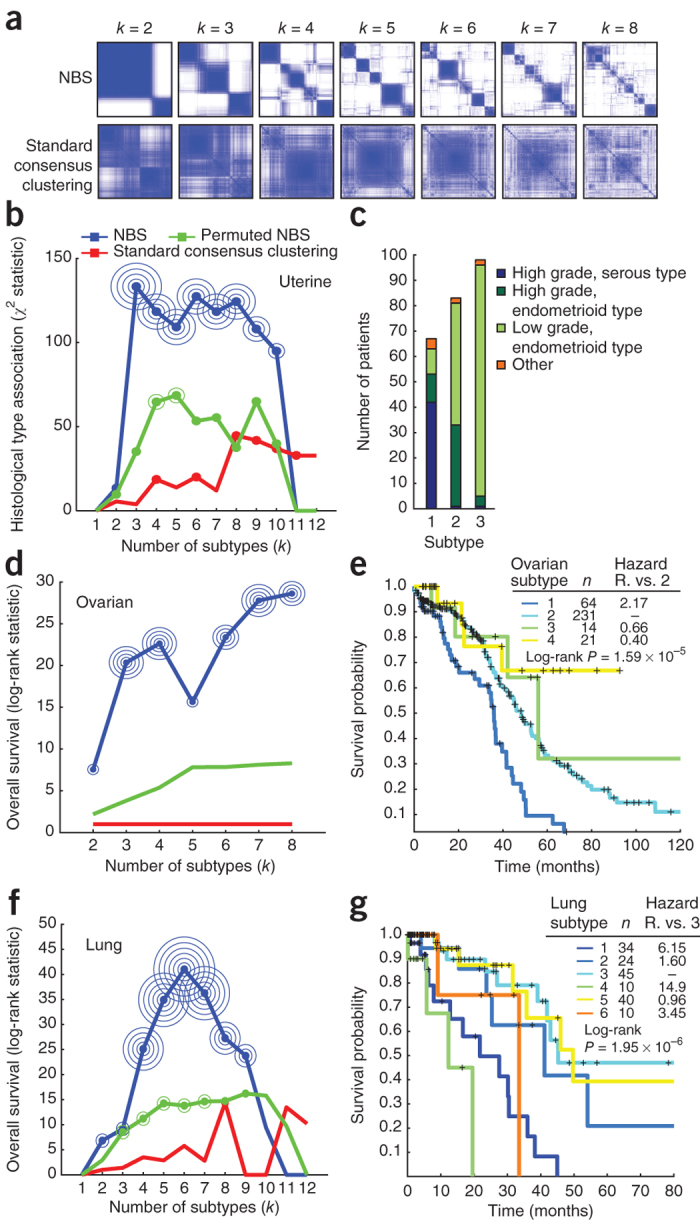
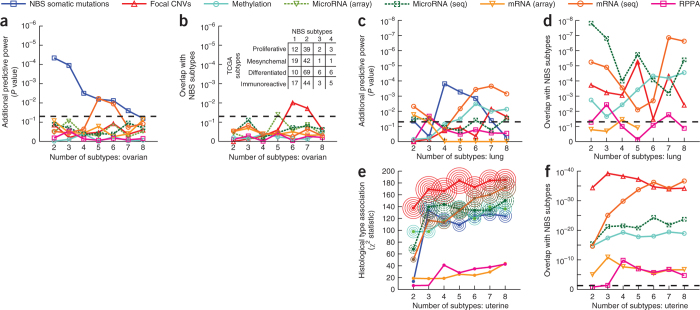
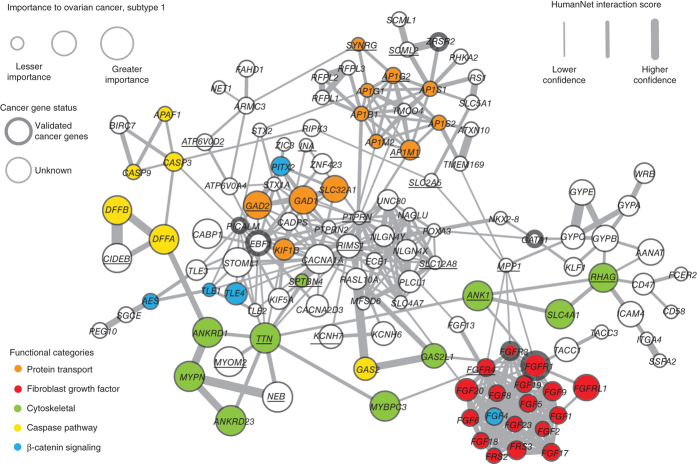
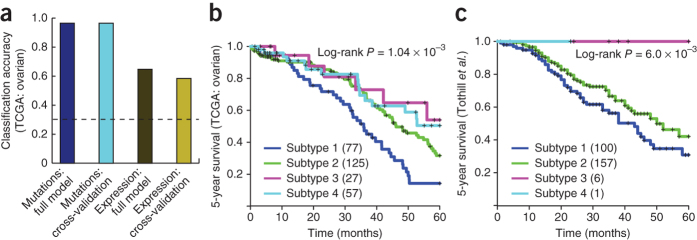
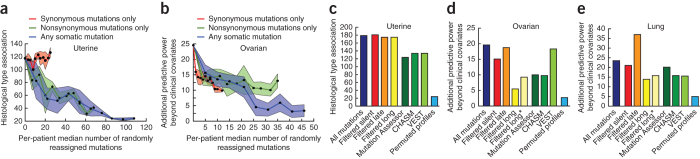
Many forms of cancer have multiple subtypes with different causes and clinical outcomes. Somatic tumor genome sequences provide a rich new source of data for uncovering these subtypes but have proven difficult to compare, as two tumors rarely share the same mutations. Here we introduce network-based stratification (NBS), a method to integrate somatic tumor genomes with gene networks. This approach allows for stratification of cancer into informative subtypes by clustering together patients with mutations in similar network regions. We demonstrate NBS in ovarian, uterine and lung cancer cohorts from The Cancer Genome Atlas. For each tissue, NBS identifies subtypes that are predictive of clinical outcomes such as patient survival, response to therapy or tumor histology. We identify network regions characteristic of each subtype and show how mutation-derived subtypes can be used to train an mRNA expression signature, which provides similar information in the absence of DNA sequence.


Conflict of interest statement

The authors declare no competing financial interests.

Figures

Figure 1
Figure 1. Overview of network-based stratification (NBS).
(a) Flowchart of the approach. (b) Example illustrating smoothing of patient somatic mutation profiles over a molecular interaction network. Mutated genes are shown in yellow (patient 1) and blue (patient 2) in the context of a gene interaction network. Following smoothing, the mutational activity of a gene is a continuous value reflected in the intensity of yellow or blue; genes with high scores in both patients appear in green (dashed oval). (c) Clustering mutation profiles using non-negative matrix factorization (NMF) regularized by a network. The input data matrix (F) is decomposed into the product of two matrices: one of subtype prototypes (W) and the other of assignments of each mutation profile to the prototypes (H). The decomposition attempts to minimize the objective function shown, which includes a network influence constraint L on the subtype prototypes. k, predefined number of subtypes. (d) The final tumor subtypes are obtained from the consensus (majority) assignments of each tumor after 1,000 applications of the procedures in b and c to samples of the original data set. A darker blue color in the matrix coincides with higher co-clustering for pairs of patients.
Figure 2
Figure 2. Exploring performance of NBS through simulation.
(a) TCGA somatic mutations for ovarian cancer (top left) are combined with the STRING human protein interaction network (bottom left) to generate simulated mutation data sets embedded with known network structure (right). (b) Accuracy with which NBS clusters recover simulated subtype assignments, evaluated with and without network smoothing and using non-negative matrix factorization (NMF) versus hierarchical clustering. Accuracy is calculated as the Adjusted Rand Index of overlap between the clusters and correct subtype assignments, for which a score of 0 represents random overlap and 1 represents perfect overlap. Simulation was performed with a driver mutation frequency f = 7.5% with a single network module assigned to each subtype. (c) Accuracy landscape of NBS across varying driver mutation frequency and module size. (d) As in c, for a standard non-network–based clustering approach. (e) As in c, using a permuted network.
Figure 3
Figure 3. NBS of somatic tumor mutations.
(a) Co-clustering matrices for uterine cancer patients, comparing NBS (STRING) (top) to standard consensus clustering (bottom). (b,c) Association of NBS subtypes with histology (b) and composition of NBS subtypes in terms of histological type and tumor grade (c) for uterine cancer. (d,e) Association of NBS subtypes (HumanNet) with patient survival time (d) and Kaplan-Meier survival plots for NBS subtypes (e) for ovarian cancer. (f,g) Association of NBS subtypes (HumanNet) with patient survival time (f) and Kaplan-Meier survival plots for NBS subtypes (g) for lung cancer. (b,d,f) P value of significance of 10k is indicated by k concentric circles surrounding a data point (for example, three concentric circles indicate P < 0.001); in the case of uterine a significance of 10−5k is indicated by k concentric circles (for example, one circle indicates P < 10−5). Hazard R., hazard ratio, the ratio of fatalities between the two indicated subtypes over the studied time interval.
Figure 4
Figure 4. Predictive power and overlap of subtypes derived from different TCGA datasets.
(a) Predictive power in ovarian cancer. For each data type (line color), the power for predicting patient survival time beyond clinical indicators is shown as a function of number of subtypes. (b) Significance of overlap of ovarian cancer subtypes identified by each data type (line color) with subtypes identified by NBS. The table shows the number of patients shared between each NBS subtype and those defined by the TCGA using gene expression. (c) Predictive power in lung cancer, as for a. (d) Significance of overlap of lung cancer subtypes with NBS, as for b. (e) Association between uterine cancer subtype and tumor histology (y axis) as a function of the number of subtypes. P value of significance is indicated by concentric circles as in Figure 3. Colors are as in other panels, symbols have been omitted for clarity. (f) Significance of overlap of uterine cancer subtypes with NBS, as for b. Dashed horizontal lines indicate the P = 0.05 threshold of significance.
Figure 5
Figure 5. Network view of genes with high network-smoothed mutation scores in HumanNet ovarian cancer subtype 1 (relative to scores of other subtypes).
Subtype 1 had the lowest survival and highest platinum-resistance rates amongst the four recovered subtypes. Node size corresponds to smoothed mutation scores. Node color corresponds to a set of functional classes of interest recovered through manual examination of the resulting network with the aid of the GeneMania Cytoscape plug-in. Thickened node outlines indicate genes that are known cancer genes included in the COSMIC cancer-gene census. An underlined gene symbol in the network indicates that somatic mutations were found for that gene in the examined cohort.
Figure 6
Figure 6. From mutation-derived subtypes to expression signatures.
(a) Classification accuracy (fraction of correctly classified patients) when using a supervised learning method trained to learn a signature on the basis of either somatic mutation profiles or gene expression, showing training error and cross-validation error. Dashed line shows the accuracy for a random predictor. (b) Kaplan-Meier survival plots for the TCGA ovarian cancer patients using a classifier trained on subtypes from NBS of mutation data in TCGA. (c) Results of the same classifier applied to serous ovarian cancer samples from an independent data set (Tothill et al.).
Figure 7
Figure 7. Effects of different types of mutations on stratification.
(a,b) Effects of permuting a progressively larger fraction of mutations per patient for different types of somatic mutation, for the uterine (a) and ovarian (b) tumor cohorts. Lines show the median performance, and colored regions represent the median absolute deviation. (ce) Different types of filters were applied as a preprocessing step before NBS was run on the uterine (c), ovarian (d) and lung (e) cohorts. In blue is the full data set; in red we filter all synonymous mutations; in orange and yellow we filter the top 2% late-to-replicate and long genes, respectively (long*: top 2% long genes, with any COSMIC cancer gene census genes included in the analysis). In green are three types of filters based on predictors of the functional effect of mutation; in light blue is the performance we observed after permuting all mutations within each patient separately as a control. (ae) For uterine cancer, we report the median χ2 statistic; for ovarian and lung cancer, we report the median likelihood difference of a full model to a base model including just clinical covariates (age, grade, stage, mutation rate and residual tumor after surgery).

Comment in

References

    1. The International Cancer Genome Consortium. International network of cancer genome projects. Nature464, 993–996 (2010). - PMC - PubMed
    1. The Cancer Genome Atlas Research Network. Integrated genomic analyses of ovarian carcinoma. Nature474, 609–615 (2011). - PMC - PubMed
    1. The Cancer Genome Atlas Research Network. Integrated genomic characterization of endometrial carcinoma. Nature497, 67–73 (2013). - PMC - PubMed
    1. Brunham LR, Hayden MR. Whole-genome sequencing: the new standard of care? Science. 2012;336:1112–1113. doi: 10.1126/science.1220967. - DOI - PubMed
    1. Chin L, Andersen JN, Futreal PA. Cancer genomics: from discovery science to personalized medicine. Nat. Med. 2011;17:297–303. doi: 10.1038/nm.2323. - DOI - PubMed

Publication types