. 2013 Oct;20(10):1227-35.
doi: 10.1038/nsmb.2665. Epub 2013 Sep 15.

MicroRNA-based discovery of barriers to dedifferentiation of fibroblasts to pluripotent stem cells

Affiliations

MicroRNA-based discovery of barriers to dedifferentiation of fibroblasts to pluripotent stem cells

Robert L Judson et al. Nat Struct Mol Biol. 2013 Oct.

Abstract

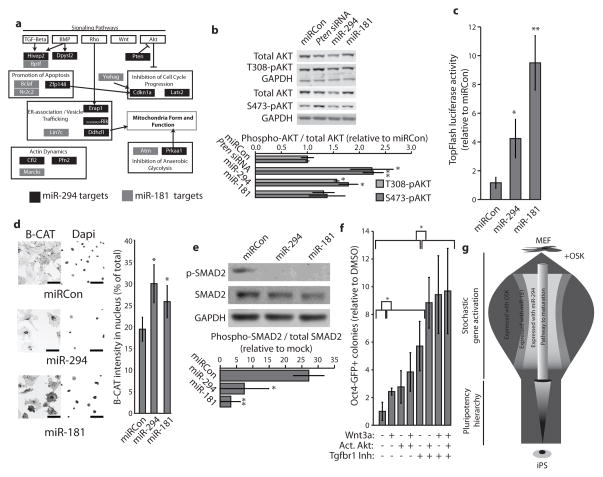
Individual microRNAs (miRNAs) can target hundreds of mRNAs forming networks of presumably cooperating genes. To test this presumption, we functionally screened miRNAs and their targets in the context of dedifferentiation of mouse fibroblasts to induced pluripotent stem cells (iPSCs). Along with the miR-302-miR-294 family, the miR-181 family arose as a previously unidentified enhancer of the initiation phase of reprogramming. Endogenous miR-181 miRNAs were transiently elevated with the introduction of Pou5f1 (also known as Oct4), Sox2 and Klf4 (referred to as OSK), and miR-181 inhibition diminished iPSC colony formation. We tested the functional contribution of 114 individual targets of the two families, revealing 25 genes that normally suppress initiation. Coinhibition of targets cooperatively promoted both the frequency and kinetics of OSK-induced reprogramming. These data establish two of the largest functionally defined networks of miRNA-mRNA interactions and reveal previously unidentified relationships among genes that act together to suppress early stages of reprogramming.


Figures

Figure 1
Figure 1. A genome-wide screen identifies verified and novel miRNA enhancers of OSK reprogramming
a) Schematic representation of screen for miRNA enhancers of OSK-reprogramming, and mimic duration (details in Supp. Fig. 1). b) Results of biological duplicate genome-wide screens for miRNA mimics that enhance OSK-reprogramming. Data points represent SSMD between the number of Oct4-GFP+ colonies on day 16 in the presence of an exogenous miRNA mimic compared to 16 mock transfections per plate (shown as orange dots). Significance defined as strong (SSMD>2), moderate (SSMD>1), or weak (SSMD <1). Large dots represent SSMD >2 in at least one experiment with purple being strong in both and green being strong in one and moderate in second experiment (miRNAs corresponding to purple and green dots are shown in inlay). All significant results listed in Supplentary Table 1a. c) Verification of two miRNA families. MiRNA mimics transfected at days 1 and 7. Data represents number of day 16 Oct4-GFP+ colonies from OSK-reprogramming supplemented with indicated miRNA, relative to OSK + non-targeting miRNA mimic (MirCon). Error bars, s.e.m. (n = 3 biological replicates). Replicates performed with separate preparations of virus and MEFs. *=p<0.05, **=p<0.005 by two-tailed Student’s t-test.
Figure 2
Figure 2. The miR-181 family is an OSK-activated positive regulator of reprogramming
a) RT-qPCR analysis for individual members of miR-181 family during reprogramming. (n = 3 biological replicates). b) Quantification of flow cytometric analysis measuring GFP expression from miRNA reporters as in Supp. Fig. 1. Endogenous miRNA during OSK-reprogramming was measured. High GFP expression indicates low miRNA expression and vice versa. (n = 3 biological replicates). c) OSK-reprogramming as in Fig. 1d, but with miRNA family inhibitors introduced on days 1 and 5. (n = 3 biological replicates). For all experiments replicates Error bars, s.e.m. Replicates performed with separate preparations of virus and MEFs. *=p<0.05 by two-tailed Student’s t-test.
Figure 3
Figure 3. miR-294 and miR-181 enhance reprogramming during the early initiation phase
a) RT-qPCR analysis for markers of completed initiation in OSK-infected MEFs. (n = 4 biological replicates). B) Representative Cdh1-negative or Cdh1-positive immuno-fluorescent cells in OSK-infected MEFs on indicated days. c) Area of Cdh1-positive staining per well. (n = 4 biological replicates). d) Representation of reprogramming phases, heterogeneity of reprogramming populations, and duration of mimic function when transfected at different time points. e) Mimics were transfected at either day 1, 5, 9 or 13 post-OSK infection of MEFs. Day 20 Oct4-GFP+ colonies relative to miRCon shown for each day. (n = 4 biological replicates). g) MEFs were sorted into Ecad+ and Ecad- populations on day 8 post OSK-infection and transfected with mimic 24 hours later. Day 20 Oct4-GFP+ colonies relative to OSK+miRCon shown. (n = 3 biological replicates). h) Representation of array data comparing MEFs, MEFs infected with OSK +/− indicated mimic transfection, and iPSCs. MEF RNA collected three days after OSK-infection and 48 hours after mimic transfection. Changes in expression with an adjusted p<0.05 represented. (n = 3 biological replicates). Percentage of all genes activated (top) or repressed (bottom) in iPSCs as compared to MEFs shown. i) OSK-reprogramming with two miRNAs or controls (SiRCon1 or SiRCon2) transfected on day 1. Day 16 Oct4-GFP+ colonies relative to SiRCon1+SiRCon2. (n = 7 biological replicates). For all experiments replicates Error bars, s.e.m. Replicates performed with separate preparations of virus and MEFs. *=p<0.05, **=p<0.005 by two-tailed Student’s t-test.
Figure 4
Figure 4. An unbiased screen reveals novel direct targets of miR-294 and miR-181 that inhibit reprogramming initiation
a) Effect of day 1 transfected siRNAs against miRNA targets on reprogramming efficiency. SSMD and p-values compare wells transfected with siRNA to 4 different control siRNA (grey dots) (n = 3 biological replicates). Black dots indicate significant hits (SSMD>2, p-value<0.01). b) RT-qPCR analysis of MEFs on day 3 post-OSK infection and day 2 post-transfection of OnTargetPlus (dark) or siGenome (light) siRNA pools. N.E. = no detectable expression with or without siRNA. (n = 3 biological replicates). c) Verification of hits using independent pools of siRNA transfected on day 1 of OSK-reprogramming. Number of day 16 Oct4-GFP+ colonies relative to non-targeting siRNA control (siRCon1). (n = 4 biological replicates). d) Luciferase reporter assays verifying miRNA-mediated translational repression of functional targets. Luciferase activity in cells transfected with reporters expressing either wildtype or mutant UTRs, (Supplementary Figure 4) +/− co-transfection of indicated miRNAs normalized to transfection with control miRNA (miRCon). (n = 4 technical replicates). e) RT-qPCR analysis 48 hours post-transfection with either miR-294 or miR-181 in reprogramming MEFs. (n = 3 biological replicates). f) Representative images (top) and quantification (bottom) of Westerns detecting PTEN and DPYSl2 protein +/− miR-294 during OSK-mediated reprogramming of MEFs compared to miRCon. (n = 4 biological replicates). For all experiments, biological replicates contained separate preparations of virus and MEFs. Technical replicates were independent wells and transfections. Error bars, s.e.m. *=p<0.05, **=p<0.005 by two-tailed Student’s t-test.
Figure 5
Figure 5. miR-294 and miR-181 alter both distinct and common properties of reprogramming
a) Colony number (top) and colony area (bottom) on days 10, 12, 14 and 16 post-OSK infection +/− miR-294, miR-181 or control (miRCon). Plots indicate 2.5, 50, and 97.5 percent tiles and range. (n = 3 biological replicates) b) Schematics (top row), examples (second row) and categorization (bottom two rows) of miRNAs and siRNAs based upon effects on colony formation. Heatmaps depict SSMD comparing experimental wells to controls (siRCon1-4). (n = 3 biological replicates). c) Average area of iPSC colonies followed over time, seeded as single cells and transfected with miRNAs on day 2. Averages of all colonies (~500 per experiment) of three independent iPSC lines each measured in technical quadruplicate. d) Average area of Oct4-GFP+ colonies during OSK-reprogramming transfected with miRNAs. Wells imaged every 2 days and area measured for 96 hours after the first day colony was visible. Averages of ten individual colonies across five biological replicate experiments. e) Scatter plot of colony area in relation to days after single cell colony seeding as in c). f) Scatter plot depicting of average Oct4-GFP+ colony area during OSK-reprogramming in relation to number of days post-infection colony first detectable as in d). For all experiments, biological replicates contained separate preparations of virus and MEFs. Technical replicates were independent wells and transfections. Error bars, s.e.m. *=p<0.05, **=p<0.005 by two-tailed Student’s t-test.
Figure 6
Figure 6. miRNA-targeted genes cooperate to reduce both frequency and rate of reprogramming
a) Heatmaps depicting screens for functional cooperation between siRNAs. For any combination of two siRNA, day 16 Oct4-GFP colony number or area in wells containing both siRNA, were compared to the set of wells containing only the single siRNAs or each individual siRNA in combination with control siRNA (siRCon) using SSMD. SSMD is indicated by color of box at intersection of two siRNA listed on axis. Left depicts changes in colony number. Right indicates changes in colony area. SSMD>1 (cooperative relationship) are highlighted in red borders. SSMD<-1 (disruptive relationship) are highlighted in blue borders. Screens performed in technical duplicate with independent wells and transfections. b) Quantification of relationships in a). Bars indicate every potential relationship between siRNAs against two miR-294 (left) or miR-181 (right) targets (black bars) or between single siRNAs against targets and control siRNAs (purple bars).
Figure 7
Figure 7. MiR-294 and miR-181 targets converge on cooperating pathways and processes to enhance reprogramming
a) Schematic of signaling pathways and cellular processes enriched in miR-294 and miR-181 targets. Pathways identified by predicted target enrichment are boarded in black. Functional targets shown to inhibit reprogramming known to be involved in these categories are shown in grey and black. b) Representative Western blot (top) detecting total and phoshpo-Akt levels in reprogramming MEFs +/− indicated siRNA and miRNA, serum starved for 24 hours, and treated with IGF. Quantification (bottom) (n = 3 biological replicates). c) Relative luciferase units from TopFlash reporter co-transfected into serum starved and Wnt3a-treated reprogramming MEFS with indicated miRNAs. (n = 3 biological replicates). d) Representative images (left) and quantification (right) of immuno-fluorescent B-cat staining in reprogramming MEFs treated with indicated miRNA as in c). (n = 3 biological replicates). e) Representative images (top) and quantification (bottom) of Westerns detecting SMAD2 and phospho-SMAD2 in reprogramming MEFs treated with miRNA after 24 hours serum starvation. (n = 4 biological replicates). f) Day 16 colony count of MEFs infected with OSK and treated with indicated combinations of recombinant Wnt3a, Tgfbr1 Inh and M+Akt:ER+Tamoxifen (Act. Akt) on days 2–8. (n = 4 biological replicates). g) Schematic representation of the role of miR-181 and miR-294 as inhibiting stochastic gene expression during initiation and funneling the transcriptome toward successful reprogramming. For all experiments, biological replicates contained separate preparations of virus and MEFs. Error bars, s.e.m. *=p<0.05, **=p<0.005 by two-tailed Student’s t-test.

References

    1. Fabian MR, Sonenberg N. The mechanics of miRNA-mediated gene silencing: a look under the hood of miRISC. Nature Structural Molecular Biology. 2012;19:586–593. - PubMed
    1. Bartel DP. Review MicroRNAs: Target Recognition and Regulatory Functions. Cell. 2009;136:215–233. - PMC - PubMed
    1. Baek D, et al. The impact of microRNAs on protein output. Nature. 2008;455:64–71. - PMC - PubMed
    1. Selbach M, et al. Widespread changes in protein synthesis induced by microRNAs. Nature. 2008;455:58–63. - PubMed
    1. Guo H, Ingolia NT, Weissman JS, Bartel DP. Mammalian microRNAs predominantly act to decrease target mRNA levels. Nature. 2010;466:835–840. - PMC - PubMed

Publication types