Comparative Study
. 2013 Dec;12(12):3778-92.
doi: 10.1074/mcp.M113.029587. Epub 2013 Sep 13.

Comparative secretome analysis of epithelial and mesenchymal subpopulations of head and neck squamous cell carcinoma identifies S100A4 as a potential therapeutic target

Affiliations
Comparative Study

Comparative secretome analysis of epithelial and mesenchymal subpopulations of head and neck squamous cell carcinoma identifies S100A4 as a potential therapeutic target

Kati Rasanen et al. Mol Cell Proteomics. 2013 Dec.

Abstract

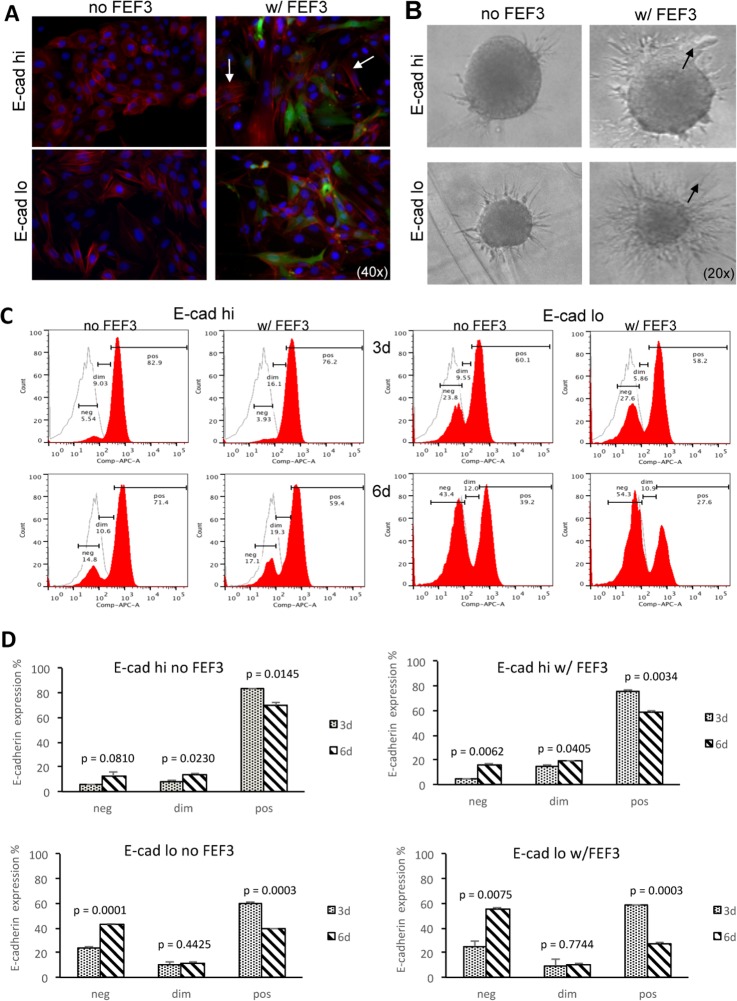
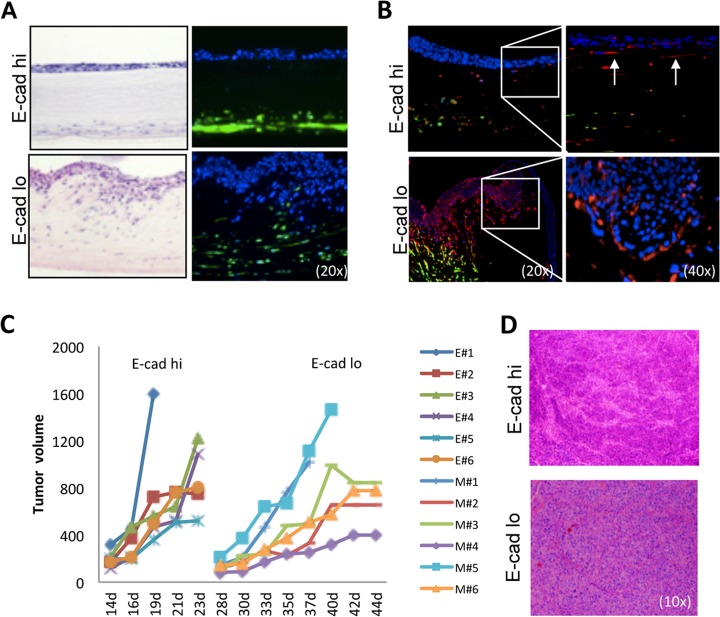
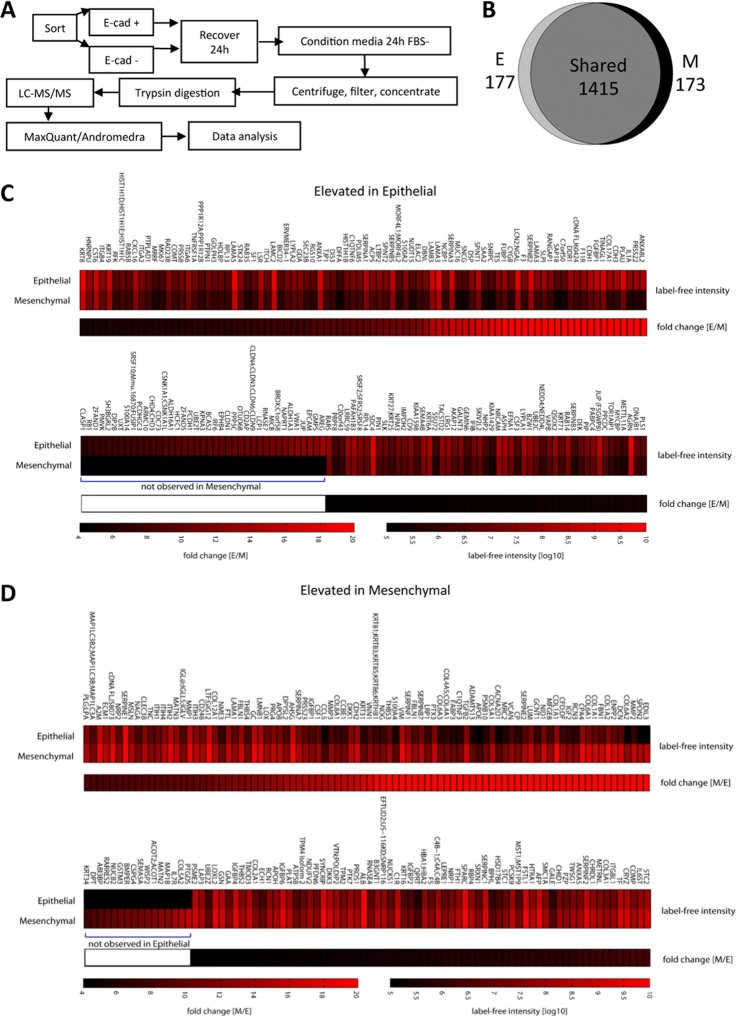
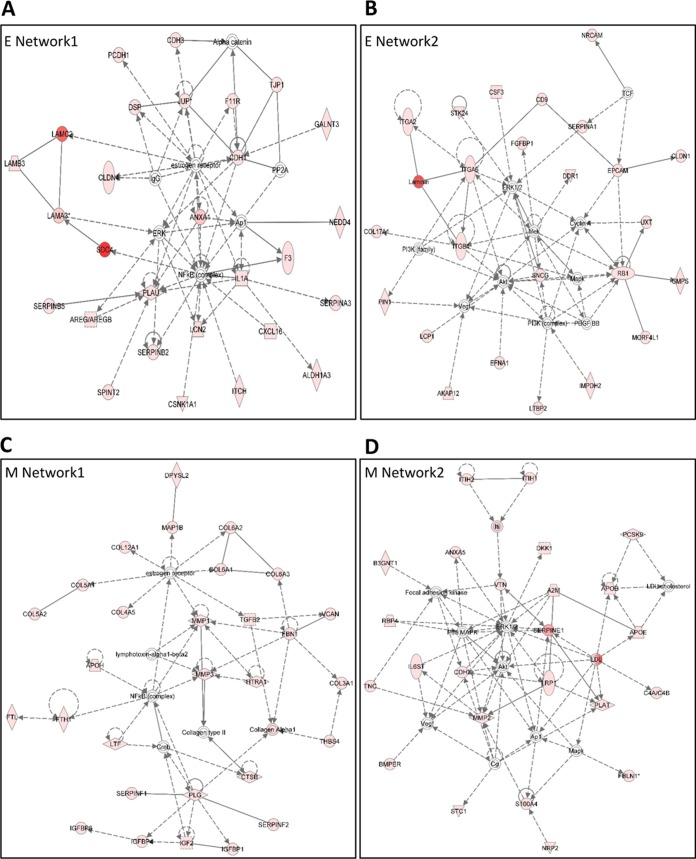
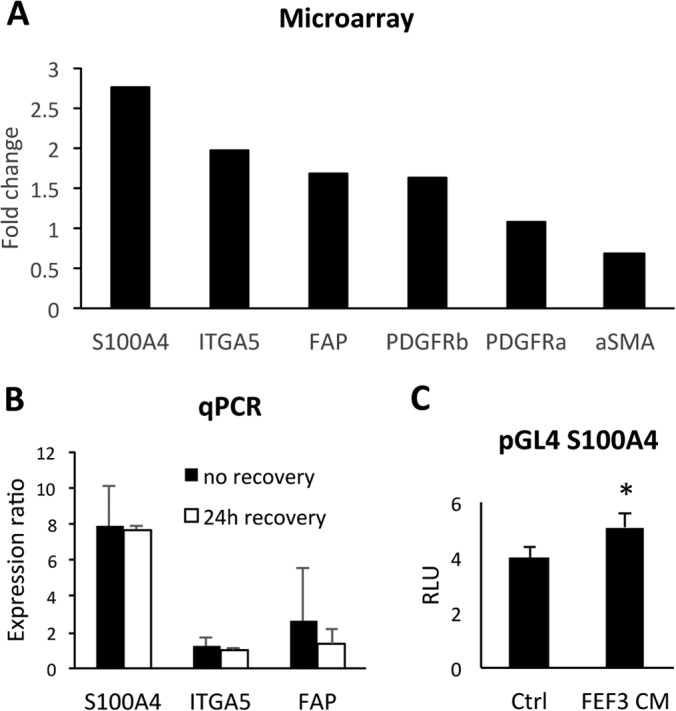
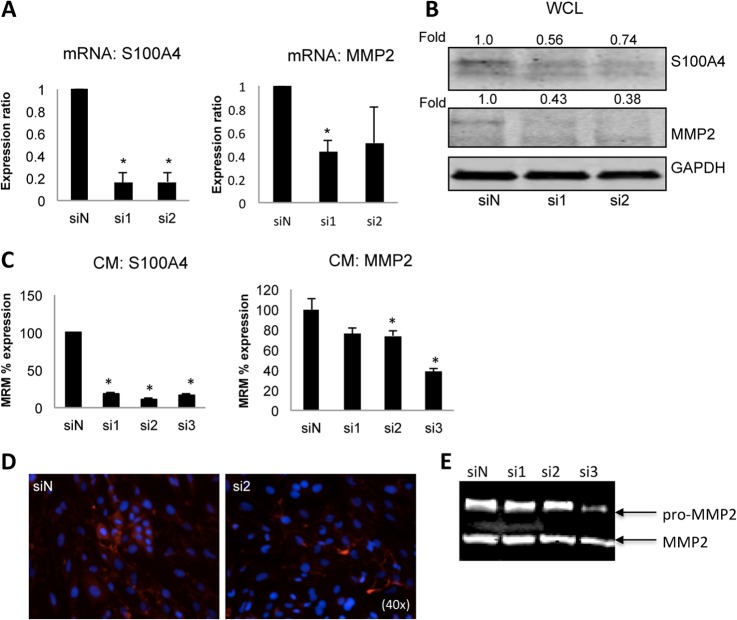
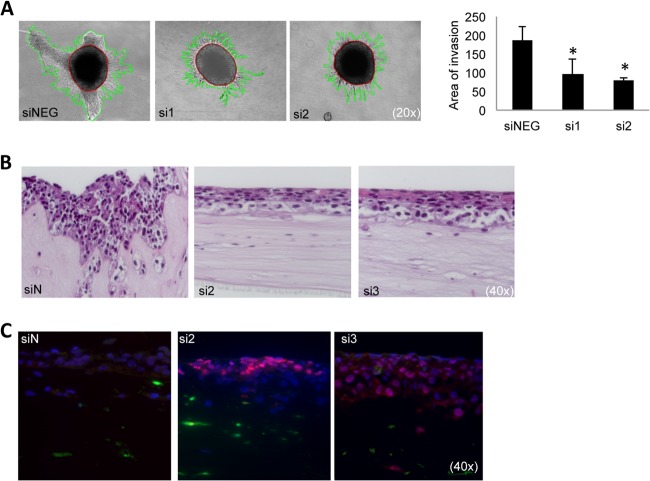
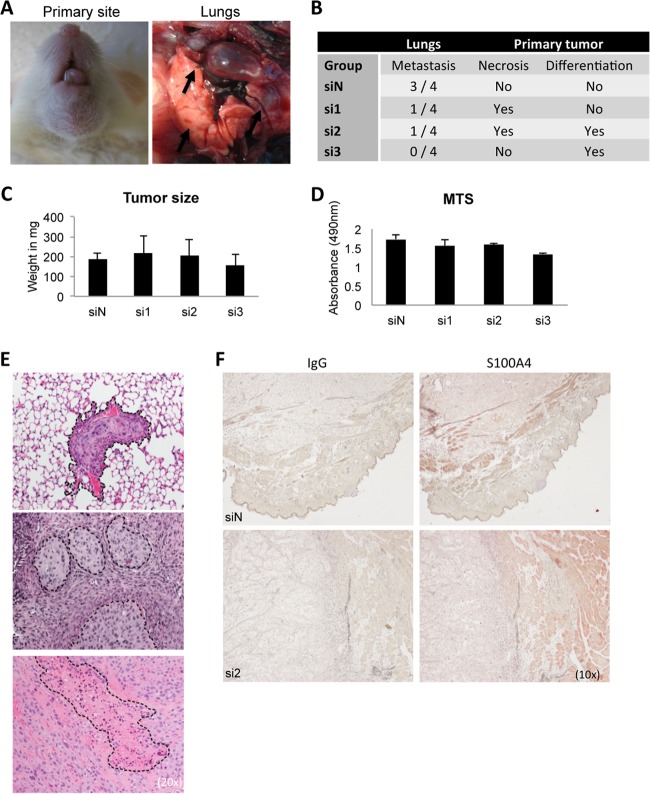
Epithelial-mesenchymal transition (EMT) is a key contributor in tumor progression and metastasis. EMT produces cellular heterogeneity within head and neck squamous cell carcinomas (HNSCC) by creating a phenotypically distinct mesenchymal subpopulation that is resistant to conventional therapies. In this study, we systematically characterized differences in the secretomes of E-cadherin high epithelial-like and E-cadherin low mesenchymal-like subpopulations using unbiased and targeted proteomics. A total 1765 proteins showed significant changes with 177 elevated in the epithelial subpopulation and 173 elevated in the mesenchymal cells. Key nodes in affected networks included NFκB, Akt, and ERK, and most implicated cellular components involved various aspects of the extracellular matrix. In particular, large changes were observed in multiple collagens with most affected collagens at much higher abundance levels in the mesenchymal subpopulation. These cells also exhibited a secretome profile resembling that of cancer-associated fibroblastic cells (CAF). S100A4, a commonly used marker for cancer-associated fibroblastic cells, was elevated more than 20-fold in the mesenchymal cells and this increase was further verified at the transcriptome level. S100A4 is a known mediator of EMT, leading to metastasis and EMT has been proposed as a potential source of cancer-associated fibroblastic cells in solid tumors. S100A4 knockdown by small interfering RNA led to decreased expression, secretion and activity of matrix metalloproteinase 2, as verified by quantitative PCR, multiple reaction monitoring and zymography analyses, and reduced invasion in collagen-embedded spheroids. Further confirmation in three-dimensional organotypic reconstructs showed less invasion and advanced differentiation in the S100A4 RNA interference samples. Orthotopic metastasis model, developed to validate the findings in vivo, demonstrated a decrease in spontaneous metastasis and augmented differentiation in the primary tumor in siS100A4 xenografts. These results demonstrate the value of secretome profiling to evaluate phenotypic conversion and identify potential novel therapeutic targets such as S100A4.


Conflict of interest statement

Conflict of interest: The authors declare no conflict of interest.

Figures

Fig. 1.
Fig. 1.
Fibroblast-derived factors promote EMT and invasion. A, Stress fiber formation was induced in FACS-segregated E-cad hi OCTT2 cells c0cultured with FEF3 fibroblasts for 24 h. Representative image of three independent experiments (blue Hoechst, red phalloidin, green GFP).) B, Fibroblast-CM induced phenotypic migration modes of collective invasion in epithelial subpopulation and single-cell invasion in mesenchymal subset of E-cadherin expression-based segregated cells (arrows). Representative 48 h images of three independent experiments. C, Expression of E-cadherin was down-modulated both in E-cad high and low subpopulations cocultured with FEF3 fibroblasts for 3 and 6 days, as shown by representative flow cytometry histograms. D, Statistical comparison of 3 and 6 day cultures, with and without fibroblasts (n = 3).
Fig. 2.
Fig. 2.
Role of the three-dimensional tumor microenvironment on epithelial and mesenchymal subpopulation growth and invasion properties. A, In organotypic reconstructs, H&E staining (left panels) showed a clear separation of the epithelial cells from the fibroblasts, whereas the MSP was highly invasive. Direct GFP-fluorescence of FEF3 cells (right panels) revealed bi-directional migration of MSP cells and fibroblasts (blue Hoechst, green GFP). Representative image of three independent experiments. B, Immunofluorescence staining of organotypic reconstructs indicated that epithelial cells, which have lost polarization, stain positive for vimentin (top panels, 40× magnification of the 20× image shown in right side). In the MSP (bottom panels) vimentin-positive red cells were observed mainly in the invasive front. The FEF3 fibroblasts are seen as yellow, copositive for GFP and vimentin. Representative image of three independent experiments. C, Growth curves of the subcutaneous xenografts of 1 × 10⁵ cells sorted based on E-cadherin expression demonstrated a clear difference in the tumor growth kinetics. At day 14, the epithelial tumors started to form, whereas tumors containing MSP cells start forming at day 28 (n = 6/group, E = epithelial subset, M = mesenchymal subset). D, H&E images of respective tumors.
Fig. 3.
Fig. 3.
Comparative secretome analysis of the epithelial and mesenchymal subpopulations. A, Schematic workflow of the LC-MS/MS secretome analysis of the cell subpopulations. B, Area-proportional Venn diagram depicting total protein distribution; 1415 proteins were not significantly different between subpopulations, 177 were elevated in the epithelial subpopulation and 173 were elevated in the MSP using a fourfold cutoff for significant differences. C, Heat maps of the significantly elevated proteins in the epithelial subset. D, Heat maps of the proteins significantly elevated in the mesenchymal cells.
Fig. 4.
Fig. 4.
IPA-generated network analyses of proteins found in epithelial and mesenchymal secretomes. A, epithelial network 1, B, epithelial network 2, C, mesenchymal network 1, and D, mesenchymal network 2. The analysis settings were 35 focus molecules per network, score above 20.
Fig. 5.
Fig. 5.
Verification of selected CAF markers on transcriptome level. A, Expression of genes up-regulated in E-cad lo MSP displayed as fold-change relative to E-cad high epithelial cells using Illumina HumanHT-12v3 Beadchips microarray in OCTT2 cells. S100A4 (2.77-fold, p = 1.32 × 10⁹), ITGA5 (1.98-fold, p = 4.99 × 10¹⁰), FAP (1.69-fold, p = 4.22 × 10⁷), and PDGFRβ (1.63-fold, p = 8.46 × 10⁸). B, Validation of S100A4, ITGA5 and FAP mRNA expression by real-time qPCR. Epithelial and mesenchymal subsets from OCTT2 cell line were FASC-segregated and RNA was isolated either directly after cell sort (solid bars) or after 24 h recovery period (open bars). GAPDH was used for normalization, and relative gene expression in MSP was compared with the epithelial subpopulation using REST-MSC software. (S100A4 = 7.89- and 7.77-fold; ITGA5 = 1.2- and 0.99-fold; FAP = 2.59- and 1.35-fold). C, OCTT2 cells transfected with S100A4 promoter construct for 24h, after which culture media was changed to either control or FEF3-CM. Luciferase activity was measured after 48h and normalized to Renilla expression. n = 3, *p < 0.05.
Fig. 6.
Fig. 6.
S100A4 knockdown by siRNA leads to MMP2 down-regulation. Unsorted OCTT2 cells were transfected either with nontargeting siRNA (siN) or siS100A4 oligos si1 and si2, respectively. Knockdown of S100A4 was quantitated by qPCR (A, left graph), Western blot of whole cell lysates (WCL) (B), MRM analysis (C) and immunofluorescence (D) 72 h after transfection. Down-regulation of S100A4 led to concomitant decrease in MMP2 expression, as measured by qPCR (A, right graph) Western blot (B), and MRM (C). For the MRM analysis a third siS100A4 oligo was included (si3). MRM confirmed that the amount of soluble S100A4 was significantly decreased in the siS100A4 samples compared with the siN oligo, and MMP2 was significantly decreased with si2 and si3. Representative zymographic analysis shows decreased proteolytic activity in CM collected from si3-transfected cells. n = 3, *p < 0.05.
Fig. 7.
Fig. 7.
Functional validation of S100A4 knockdown in vitro. A, OCTT2 cells were transfected with siS100A4 for 48 h, after which spheroids were formed for 72 h and embedded into type I collagen. Invasion was significantly repressed at 72 h time point compared with control, as quantified in the graph (right panel). Representative 20× images of three independent experiments. ImagePro was used to quantitate the area of invasion (mm2). B, OCTT2 cells transfected with siS100A4 (48 h) were over-laid on top of FEF3-GFP 3-D organotypic matrix. Reconstructs were grown for 2 weeks. 40× images of representative H&E slides. C, Reconstructs stained with involucrin showed increased differentiation in the siS100A4 samples. Representative image of three independent experiments. n = 3, *p < 0.05.
Fig. 8.
Fig. 8.
In vivo characterization of S100A4 knockdown using an orthotopic spontaneous mouse model. OCTT2 cells were transfected with siS100A4 or siN for 48 h, after which 2 × 10⁵ cells were injected into the base of the tongue of NSG mice. Tumors were grown for 3 weeks, mice were sacrificed, and primary tumors and lungs were collected. A, Representative images of the primary tumor and metastatic lungs. B, Results of the blinded histopathological analysis of H&E slides. C, Weight of the primary tumors, n = 4 per group. No significant differences in the growth of the primary tumor were observed between the groups. D, In vitro cell proliferation assay of OCTT2 cells transfected with siS100A4 showed no significant differences in proliferation rate between siRNA oligos, correlating with in vivo tumor volumes. n = 3. E, Representative images of lung metastasis, necrosis and advanced squamous differentitation. 20× images of the H&E slides. F, Representative images of S100A4 immunohistochemistry of the primary tumors, 10×.

References

    1. Masuda M., Toh S., Wakasaki T., Suzui M., Joe A. K. (2013) Somatic evolution of head and neck cancer – biological robustness and latent vulnerability. Mol. Oncol. 1, 14–28 - PMC - PubMed
    1. Worsham M. J., Ali H., Dragovic J., Schweitzer V. P. (2012) Molecular characterization of head and neck cancer: How close to personalized targeted therapy? Mol. Diagn. Ther. 16, 209–222 - PMC - PubMed
    1. Basu D., Nguyen T. T., Montone K. T., Zhang G., Wang L. P., Diehl J. A., Rustgi A. K., Lee J. T., Weinstein G. S., Herlyn M. (2010) Evidence for mesenchymal-like sub-populations within squamous cell carcinomas possessing chemoresistance and phenotypic plasticity. Oncogene 29, 4170–4182 - PMC - PubMed
    1. Basu D., Montone K. T., Wang L., Gimotty P. A., Hammond R., Diehl J. A., Rustgi A. K., Lee J. T., Rasanen K., Weinstein G. S., Herlyn M. (2011) Detecting and targeting mesenchymal-like subpopulations within squamous cell carcinomas. Cell Cycle 10, 2008–2016 - PMC - PubMed
    1. Kalluri R., Weinberg R. A. (2009) The basics of epithelial-mesenchymal transition. J. Clin. Invest. 119, 1420–1428 - PMC - PubMed

Publication types

MeSH terms