Comparative Study
. 2014 Apr;29(4):902-10.
doi: 10.1002/jbmr.2089.

A comparison of calcium to zoledronic acid for improvement of cortical bone in an animal model of CKD

Affiliations
Comparative Study

A comparison of calcium to zoledronic acid for improvement of cortical bone in an animal model of CKD

Sharon M Moe et al. J Bone Miner Res. 2014 Apr.

Abstract

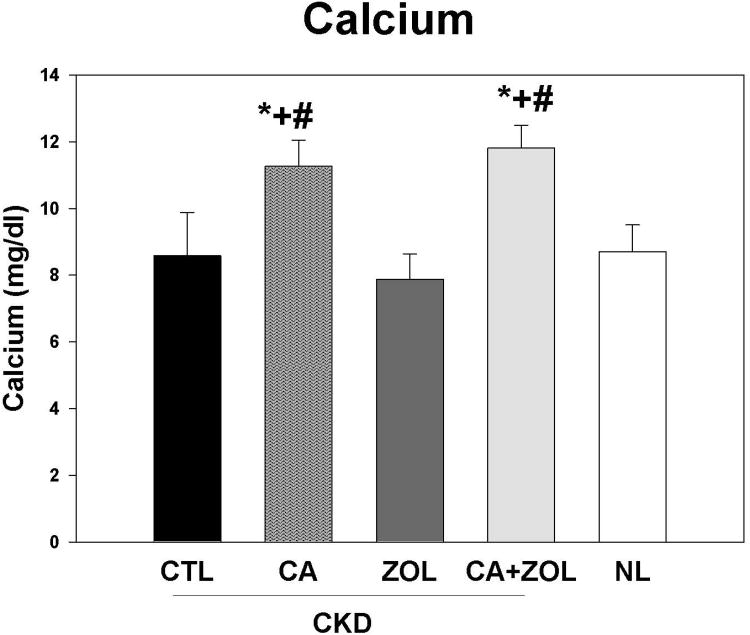
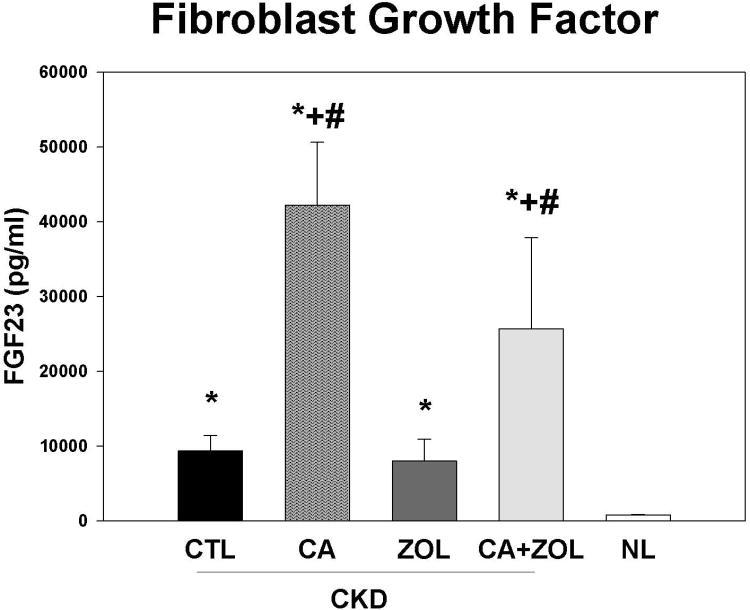
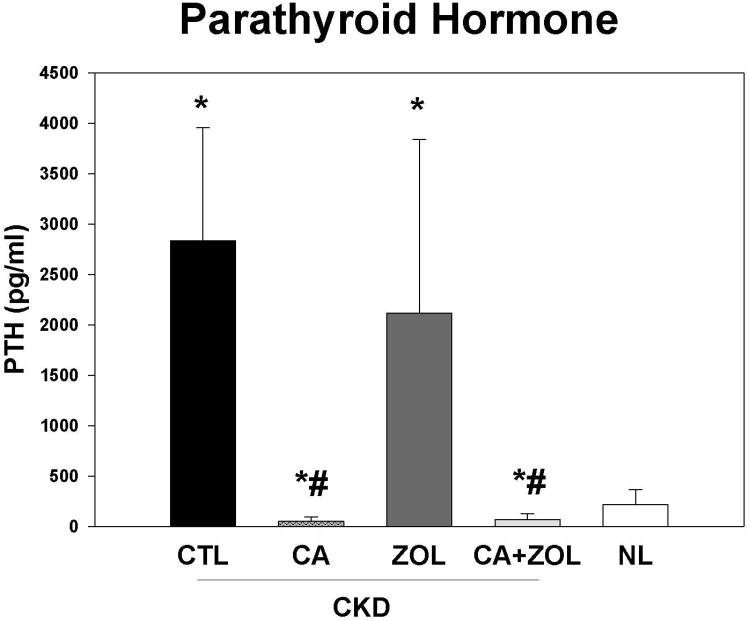
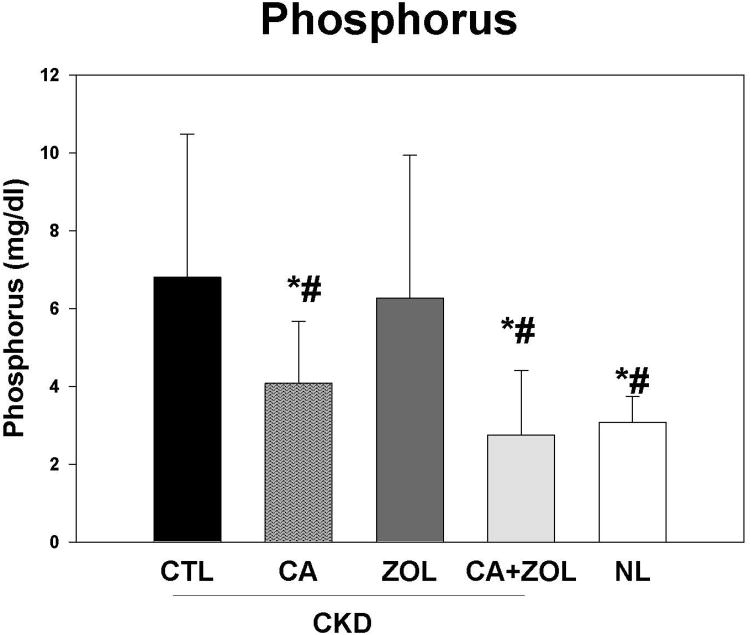
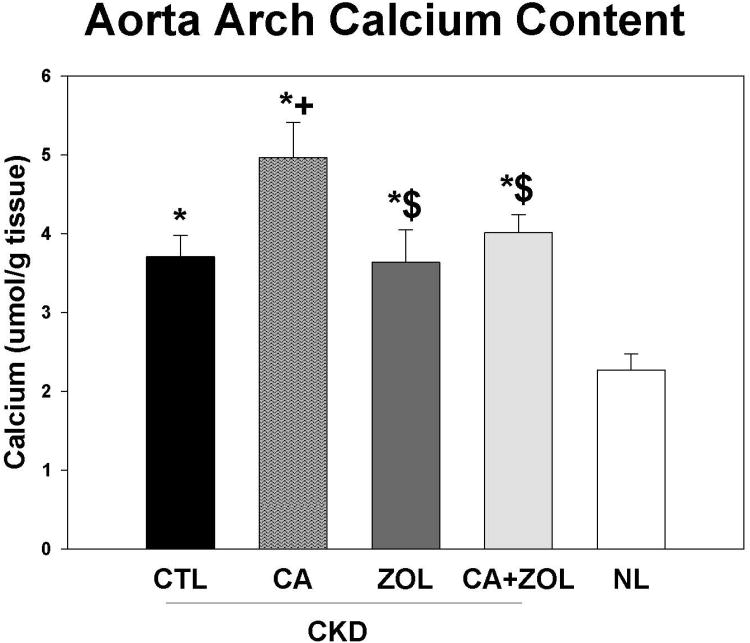
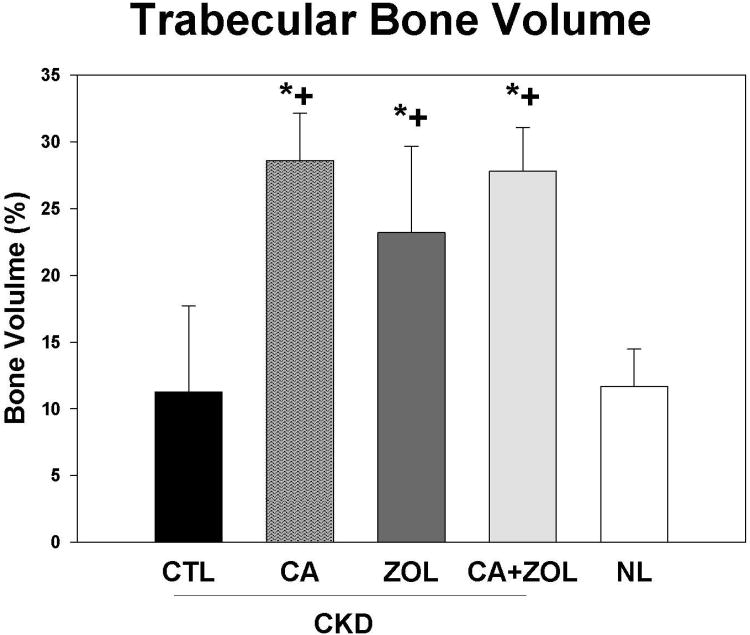
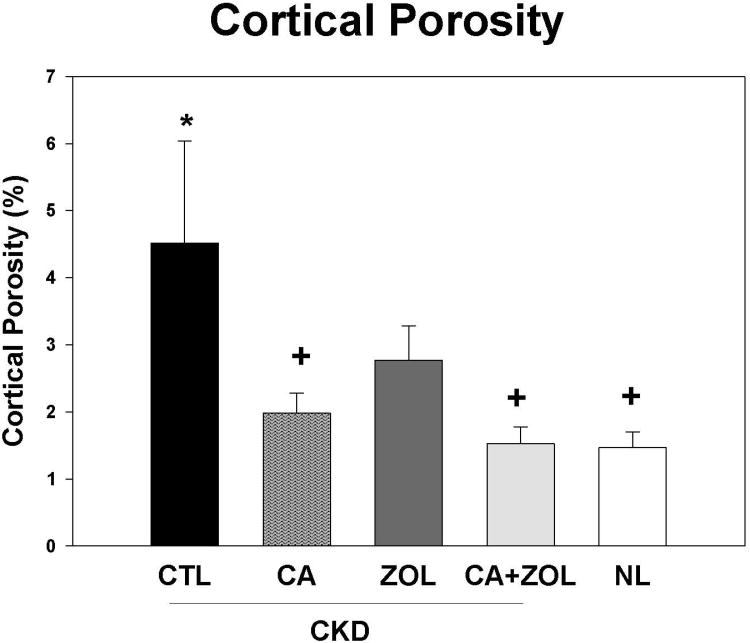
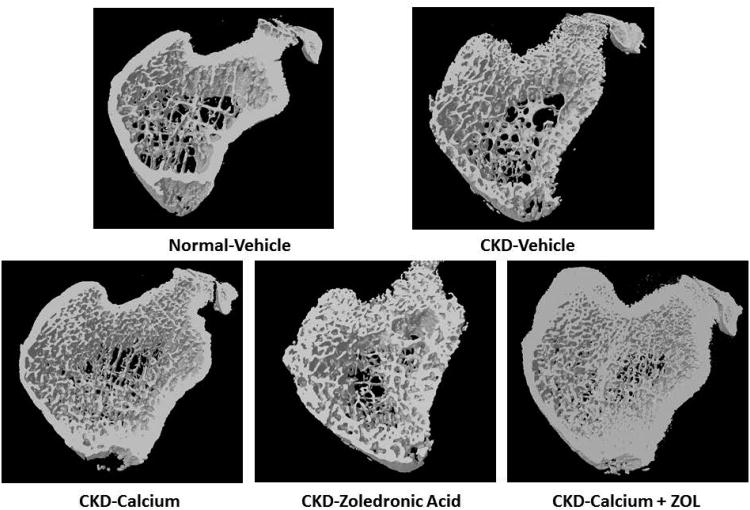
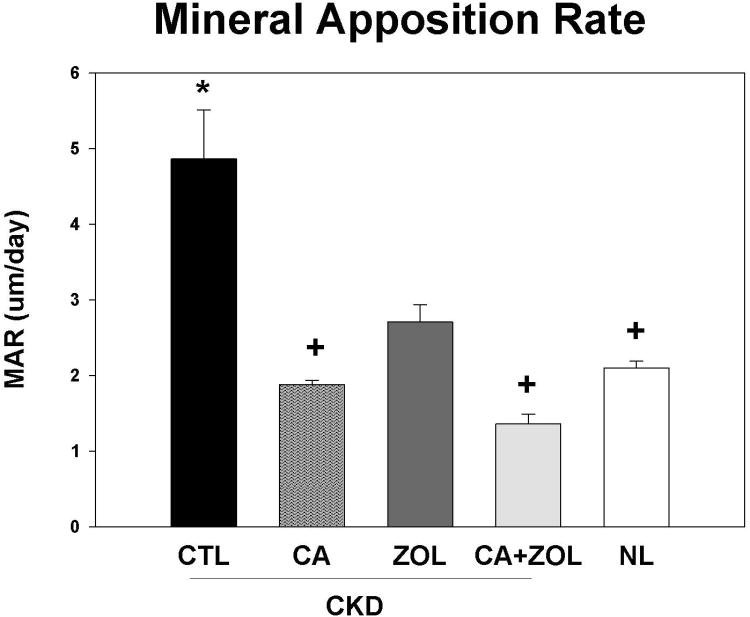
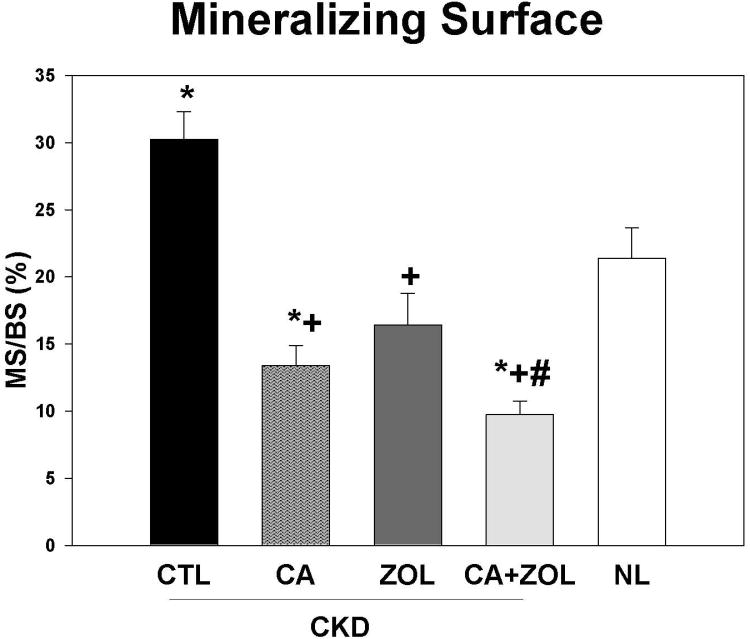
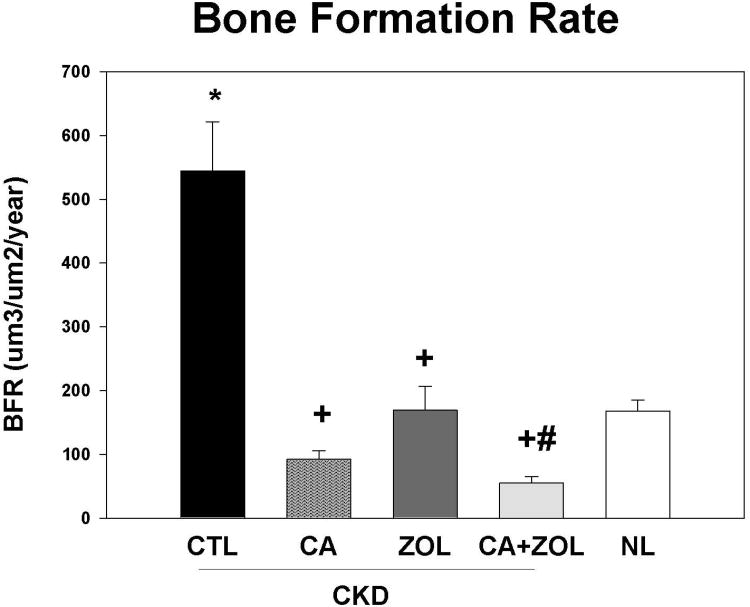
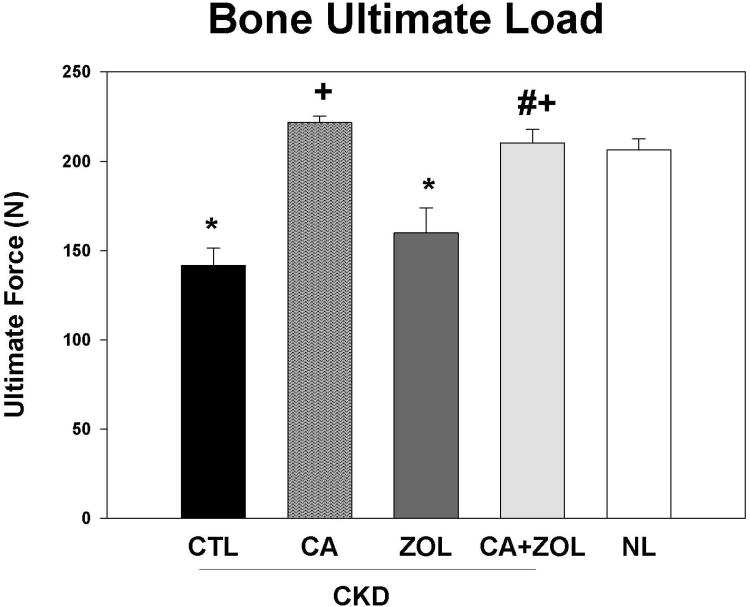
Patients with chronic kidney disease (CKD) have increased risk of fractures, yet the optimal treatment is unknown. In secondary analyses of large randomized trials, bisphosphonates have been shown to improve bone mineral density and reduce fractures. However, bisphosphonates are currently not recommended in patients with advanced kidney disease due to concern about oversuppressing bone remodeling, which may increase the risk of developing arterial calcification. In the present study we used a naturally occurring rat model of CKD with secondary hyperparathyroidism, the Cy/+ rat, and compared the efficacy of treatment with zoledronic acid, calcium given in water to simulate a phosphate binder, and the combination of calcium and zoledronic acid. Animals were treated beginning at 25 weeks of age (approximately 30% of normal renal function) and followed for 10 weeks. The results demonstrate that both zoledronic acid and calcium improved bone volume by micro-computed tomography (µCT) and both equally suppressed the mineral apposition rate, bone formation rate, and mineralizing surface of trabecular bone. In contrast, only calcium treatment with or without zoledronic acid improved cortical porosity and cortical biomechanical properties (ultimate load and stiffness) and lowered parathyroid hormone (PTH). However, only calcium treatment led to the adverse effects of increased arterial calcification and fibroblast growth factor 23 (FGF23). These results suggest zoledronic acid may improve trabecular bone volume in CKD in the presence of secondary hyperparathyroidism, but does not benefit extraskeletal calcification or cortical biomechanical properties. Calcium effectively reduces PTH and benefits both cortical and trabecular bone yet increases the degree of extra skeletal calcification. © 2014 American Society for Bone and Mineral Research.

Keywords: BIOMECHANICS; BONE; CALCIUM; CKD; FGF23; PARATHYROID HORMONE; VASCULAR CALCIFICATION; ZOLEDRONIC ACID.


Conflict of interest statement

Disclosures: SM has received honoraria and grant support from Sanofi, and stock in Eli Lilly. All other authors report no conflicts of interest. MRA has received consultation honoraria from Merck and research support from Merck and Eli Lilly.

Figures

Figure 1
Figure 1. Biochemical changes in response to therapies
CKD animals were treated beginning at 25 weeks of age with control vehicle (CTL), calcium in drinking water daily for 10 weeks (Ca), zoledronic acid 20 ug/kg given subcutaneously once at 25 weeks (ZOL), or the combination of Ca + ZOL. The results were compared to normal animals (NL) treated with vehicle. Blood was drawn at 35 weeks of age. The results demonstrate that treatment with calcium, with or without zoledronic acid, led to increased calcium levels (A), increased fibroblast growth factor 23 (B), decreased parathyroid hormone levels to those in normal animals (C), and decreased phosphorus levels (D). *= different than NL; + = different than CKD-CTL; # = different than CKD + ZOL; all p < 0.05. Graphs are mean ± SEM, n = 8 to 10 per group.
Figure 2
Figure 2. Aorta arch calcification in response to therapies
CKD animals were treated beginning at 25 weeks of age with control vehicle (CTL), calcium in drinking water daily for 10 weeks (Ca), zoledronic acid 20 ug/kg given subcutaneously once at 25 weeks (ZOL), or the combination of Ca + ZOL. The results were compared to normal animals (NL) treated with vehicle. The aorta calcium content was determined biochemically. The results demonstrated that CKD animals given any treatment had increased aorta calcification compared to NL animals, and that the treatment with calcium increased calcification further among the CKD animals. The co-administration of calcium with zoledronic acid led to a reduction of the calcium induced arterial calcification compared to calcium alone. *= different than NL; + = different than CKD-CTL; $ = different than CKD + Ca; all p < 0.05. Graphs are mean ± SEM, n = 8 to 10 per group.
Figure 3
Figure 3. Trabecular bone volume and cortical porosity in response to therapies
CKD animals were treated beginning at 25 weeks of age with control vehicle (CTL), calcium in drinking water daily for 10 weeks (Ca), zoledronic acid 20 ug/kg given subcutaneously once at 25 weeks (ZOL), or the combination of Ca + ZOL. The results were compared to normal animals (NL) treated with vehicle. At sacrifice at 35 weeks, the tibiae were assessed by microCT for trabecular bone volume (A) and cortical porosity (B). The results demonstrate that there was no difference in trabecular bone volume between CKD and NL animals treated with vehicle. However, all of the treatments led to higher bone volume in the CKD animals compared to CKD-vehicle. In contrast, the cortical porosity was increased in vehicle treated CKD animals compared to NL animals. Treatment with calcium, or calcium plus zoledronic acid, but not ZOL alone, reduced cortical porosity to NL levels. The 3D reconstructions (C) provide visualization of these trabecular and cortical effects across groups.*= different than NL; + = different than CKD-CTL; all p < 0.05. Graphs are mean ± SEM, n = 7 to 10 per group.
Figure 4
Figure 4. Bone histomorphometry in response to therapies
CKD animals were treated beginning at 25 weeks of age with control vehicle (CTL), calcium in drinking water daily for 10 weeks (Ca), zoledronic acid 20 ug/kg given subcutaneously once at 25 weeks (ZOL), or the combination of Ca + ZOL. The results were compared to normal animals (NL) treated with vehicle. At sacrifice at 35 weeks, the tibiae were processed for bone histomorphometry. The results for mineral apposition rate (MAR; A), mineralizing surface as a percentage of bone surface (MS/BS; B), and bone formation rate (BFR; C). The results demonstrate that there was higher MAR, BFR, and MS/BS in the CKD animals treated with vehicle compared to NL animals. Treatment with calcium orzoledronic acid reduced all parameters to levels similar in the NL animals with additive reduction in the calcium plus zoledronic acid group. The *= different than NL; + = different than CKD-CTL; # = different than CKD + ZOL; all p < 0.05. Graphs are mean ± SEM, n = 7 to 10 per group.
Figure 5
Figure 5. Bone biomechanics in response to therapies
CKD animals were treated beginning at 25 weeks of age with control vehicle (CTL), calcium in drinking water daily for 10 weeks (Ca), zoledronic acid 20 ug/kg given subcutaneously once at 25 weeks (ZOL), or the combination of Ca + ZOL. The results were compared to normal animals (NL) treated with vehicle. At sacrifice at 35 weeks, the femora were tested via three-point bending. The results demonstrate that the CKD animals had reduced ultimate load (fracture predisposition) than normal animals and this was improved by calcium treatment with or without zoledronic acid The *= different than NL; + = different than CKD-CTL; # = different than CKD + ZOL; all p < 0.05. Graphs are mean ± SEM, n = 7 to 10 per group.

Similar articles

Cited by

References

    1. Moe S, Drueke T, Cunningham J, Goodman W, Martin K, Olgaard K, Ott S, Sprague S, Lameire N, Eknoyan G. Definition, evaluation, and classification of renal osteodystrophy: A position statement from Kidney Disease: Improving Global Outcomes (KDIGO) Kidney Int. 2006;69(11):1945–53. - PubMed
    1. Nickolas TL, Leonard MB, Shane E. Chronic kidney disease and bone fracture: a growing concern. Kidney Int. 2008;74(6):721–31. - PMC - PubMed
    1. Nickolas T, Stein E, Cohen A, Staron R, McMahon DJ, Leonard MB, Shane E. Bone mass and microarchitecture in CKD patients with fracture. Journal of the American Society of Nephrology 2010 - PMC - PubMed
    1. Lindberg JS, Moe SM. Osteoporosis in end-state renal disease. Semin Nephrol. 1999;19(2):115–22. - PubMed
    1. Miller PD, Roux C, Boonen S, Barton IP, Dunlap LE, Burgio DE. Safety and efficacy of risedronate in patients with age-related reduced renal function as estimated by the Cockcroft and Gault method: a pooled analysis of nine clinical trials. J Bone Miner Res. 2005;20(12):2105–15. - PubMed

Publication types

MeSH terms