. 2014 Jan 29;10(2):385-98.
doi: 10.1002/smll.201301597. Epub 2013 Aug 27.

Use of coated silver nanoparticles to understand the relationship of particle dissolution and bioavailability to cell and lung toxicological potential

Affiliations

Use of coated silver nanoparticles to understand the relationship of particle dissolution and bioavailability to cell and lung toxicological potential

Xiang Wang et al. Small. .

Abstract

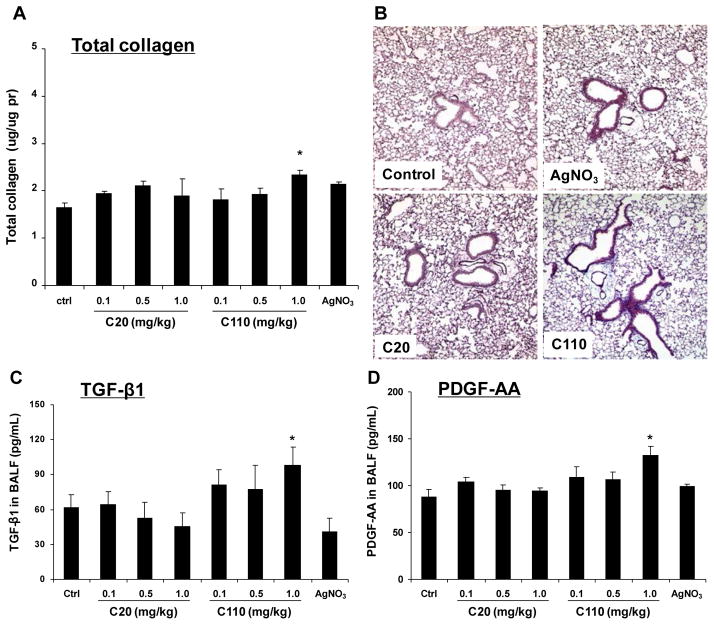
Since more than 30% of consumer products that include engineered nanomaterials contain nano-Ag, the safety of this material is of considerable public concern. In this study, Ag nanoparticles (NPs) are used to demonstrate that 20 nm polyvinylpyrrolidone (PVP or P) and citrate (C)-coated Ag NPs induce more cellular toxicity and oxidative stress than larger (110 nm) particles due to a higher rate of dissolution and Ag bioavailability. Moreover, there is also a higher propensity for citrate 20 nm (C20) nanoparticles to generate acute neutrophilic inflammation in the lung and to produce chemokines compared to C110. P110 has less cytotoxic effects than C110, likely due to the ability of PVP to complex released Ag(+) . In contrast to the more intense acute pulmonary effects of C20, C110 induces mild pulmonary fibrosis at day 21, likely as a result of slow but persistent Ag(+) release leading to a sub-chronic injury response. Interestingly, the released metallic Ag is incorporated into the collagen fibers depositing around airways and the lung interstitium. Taken together, these results demonstrate that size and surface coating affect the cellular toxicity of Ag NPs as well as their acute versus sub-chronic lung injury potential.

Keywords: cytotoxicity; dissolution; lung inflammation; nanoparticle; silver.


Figures

Figure 1
Figure 1
Physicochemical characterization of Ag NPs. (A) TEM images of the Ag NPs used in this study. The images were taken with a JEOL 1200 EX TEM microscope and demonstrate that each particle type exhibited well-defined single crystalline structures. (B) UV-vis and ICP-OES analysis to study Ag release from the Ag NPs in water. The graph in lower left panel shows the UV-vis profile of the C20 suspension (at 12.5 μg/mL) and the supernatant, following centrifugation at 15,000 rpm for 1 h. The absence of a UV-vis spectrum of the supernatant demonstrates that all Ag NPs were spun down following centrifugation. The inserted images for C20 and P20 showed that centrifugation of these suspensions results in visible particle pellets at bottom of the centrifuge tube, while the supernatants are transparent. The supernatants were used for ICP-OES to assess the Ag content as shown in the graph in the lower right panel. (C) ICP-OES analysis to study time-dependent Ag release in BEGM. 12.5 μL of the Ag NP stock solution (1 mg/mL) were added to 985.5 μL of BEGM before sonication. The particle suspension was incubated at 37 °C. Aliquots were withdrawn at 0, 6, and 24 h, centrifuged at 15,000 rpm, and each supernatant collected for acid digestion and ICP-OES analysis. * Statistically different from control (p < 0.05); # p < 0.05 for pairwise comparisons as shown.
Figure 2
Figure 2
In vitro evidence of Ag NP toxicity in BEAS-2B cells. (A) MTS assay to show the cytotoxicity of Ag NPs in BEAS-2B cells. These cells were exposed to particles at 6.25, 12.5, 25 and 50 μg/mL for 24 h and then incubated with MTS reagent for 1 h. Afterwards, the cells were centrifuged at 2000 g for 10 min, and 80 μL of the supernatant transferred to a new plate. The plate was read at 490 nm in a UV-vis spectrometer (SpectroMax M5e, Molecular Devices Corp., Sunnyvale, CA, USA). All the MTS values were normalized according to the non-treated control, which exhibited ~100 % cell viability. TiO2 P25 and ZnO nanoparticles were used as negative and positive controls. (B) Heat map to assess the toxic oxidative stress potential in the same cells, using a multi-parameter HTS assay. The heat maps were established using SSMD statistical analysis to evaluate the supra-threshold cellular responses by automated epifluorescence microscopy. The response parameters included assessment of surface membrane permeability (PI), intracellular calcium flux (Fluo-4), ROS generation (MitoSox Red and DCF), and mitochondrial membrane depolarization (JC-1). Cells were treated with similar particle doses as for the MTS assay. Epifluorescence images were collected hourly for the 6 h and then again that 24 h. The rationale of the assay and the composition of the fluorescent dye cocktails, to perform the assay are explained in supporting Materials and Methods. (C) Total cellular Ag content in BEAS-2B cells as determined by ICP-OES. BEAS-2B cells were exposed to Ag NPs at 10 μg/mL for 24 h, following which the cells were recovered, sonicated and used for acid digestion. The concentration in each sample was expressed as μg Ag per mg of cellular protein. (D) Cytotoxicity of the supernatants obtained from Ag NPs that were incubated for 24 h in BEGM. 50 μL of Ag NPs stock solution (1 mg/mL in water) was added to 950 μL of BEGM before sonication. The Ag NPs suspension was incubated at 37 °C for 24 h and then centrifuged at 15,000 rpm for 1 h to obtain supernatants for each particle. Subsequently, MTS assays were performed in BEAS-2B cells exposed to the supernatants from each particle. (E) PVP and citrate affect the cytotoxic potential of Ag ions differently. BEAS-2B cells were exposed to AgNO3 alone or or an equivalent amount of the same solution to which 10 kDa and 40 kDa PVP polymers at 100 μg/mL or 2 mM citrate, were added. Subsequently a MTS assay was performed. * Statistically different from control (p < 0.05), # p < 0.05 for comparisons of Ag++10 k PVP or Ag++40 k PVP versus Ag+.
Figure 3
Figure 3
Dose-dependent acute pulmonary effects of C20 or C110 in mice. Anesthetized C57BL/6 mice were exposed one time to C20 or C110 Ag NPs at 0.1, 0.5 and 1.0 mg/kg by oropharyngeal aspiration. There were 6 animals per group. Animals were euthanized after 40 h, and BALF was collected to determine neutrophil cell counts (A), LIX (B) and MCP-1 (C) levels. AgNO3 at 1.0 mg/kg was used as a comparative control. The experiment was reproduced a second time; * p < 0.05 compared to control.
Figure 4
Figure 4
Lung histology and Ag distribution in mice exposed to C20 or C110 for 40 h. (A) Representative H&E-stained histological images (100 ×) of the lungs of mice exposed to C20 or C110 at 0.1, 0.5 and 1.0 mg/kg. AgNO3 solution at 1.0 mg/kg was used as a control. There is a clear dose-dependent increase in acute inflammatory infiltrates in the lungs of animals exposed to C20, but only mild inflammation in mice exposed to 1.0 mg/kg C110. (B) Distribution of Ag in lungs 40 h post-exposure to C20 or C110. The same animal lungs as in (A) were stained with the Silver Enhancing Kit and counterstained with Nuclear Fast Red. The black dots indicate the localization of Ag NPs in the lung (400 ×). (C) Ag content in lungs as determined by ICP-OES. Three mice in each group received C20 or C110 installation at 1.0 mg/kg and within sacrificed at 40 h. The intact lungs were collected and digested by concentrated nitric acid and hydrogen peroxide before determining the total Ag content by ICP-OES. (D) Comparison of the Ag content in different organs after C20 or C110 exposure. The heart, liver, spleen, lungs, kidneys, brain and blood were collected from the same mice in (C) and digested by concentrated nitric acid and hydrogen peroxide for the analysis of total Ag content by ICP-OES.
Figure 5
Figure 5
Comparison of the pulmonary effects of C20 or C110 in mice 21 d post-exposure. The experiment was performed as in Figure 4, except that the animals were sacrificed 21 days after the oropharyngeal aspiration of C20 or C110 at doses of 0.1, 0.5 and 1.0 mg/kg. BALF was collected to determine neutrophil cell counts (A), LIX (B) and MCP-1 (C) levels. AgNO3 solution at 1.0 mg/kg was used as a control. * p < 0.05 compared to control.
Figure 6
Figure 6
Assessment of the sub-chronic lung injury potential of C20 or C110, 21 days after oropharyngeal aspiration. (A) The total collagen content of the lung tissues collected in Figure 5 was determined by the Sircol soluble collagen kit (Biocolor Ltd., Carrickfergus, U.K.). (B) Lung sectioning and staining with Masson’s trichrome. Concentrated blue color development represents collagen staining. Lungs from AgNO3 exposed animals served as control. The images shown at 100× magnification are representative of these responses in each group. The BALF collected for the experiments in Figure 5 was used to determine TGF-β1 (C) and PDGF-AA (D) levels by ELISA. * p < 0.05 compared to control.
Figure 7
Figure 7
Comparison of Ag content and lung distribution 21 d post-exposure. (A) The lung Ag content was determined by ICP-OES. (B) Ag distribution in the lung was determined by the silver staining method described in Figure 4. The black dots and linear wavy lines in the middle and the right panel show the localization of Ag in lung tissue (100 ×). We also compared the Ag content of the lung to other organs (C), as determined by ICP-OES.
Figure 8
Figure 8
Schematic to explain the difference between the biological outcomes of exposure to 20 and 110 nm particles as a function of surface area and rates of dissolution.

References

    1. Wijnhoven SWP, Peijnenburg WJGM, Herberts CA, Hagens WI, Oomen AG, Heugens EHW, Roszek B, Bisschops J, Gosens I, Van de Meent D, Dekkers S, De Jong WH, Van Zijverden M, Sips AJAM, Geertsma RE. Nanotoxicology. 2009;3:109–U178.
    1. Glover RD, Miller JM, Hutchison JE. Acs Nano. 2011;5:8950–8957. - PubMed
    1. Liu JY, Sonshine DA, Shervani S, Hurt RH. Acs Nano. 2010;4:6903–6913. - PMC - PubMed
    1. Kim WY, Kim J, Park JD, Ryu HY, Yu IJ. J Toxicol Environ Health Part A. 2009;72:1279–1284. - PubMed
    1. Sung JH, Ji JH, Yoon JU, Kim DS, Song MY, Jeong J, Han BS, Han JH, Chung YH, Kim J, Kim TS, Chang HK, Lee EJ, Lee JH, Yu IJ. Inhal Toxicol. 2008;20:567–574. - PubMed

Publication types