

Mapping temporal dynamics in social interactions with unified structural equation modeling: A description and demonstration revealing time-dependent sex differences in play behavior
- PMID: 24039386
- PMCID: PMC3772550
- DOI: 10.1080/10888691.2013.805953
Mapping temporal dynamics in social interactions with unified structural equation modeling: A description and demonstration revealing time-dependent sex differences in play behavior
Abstract
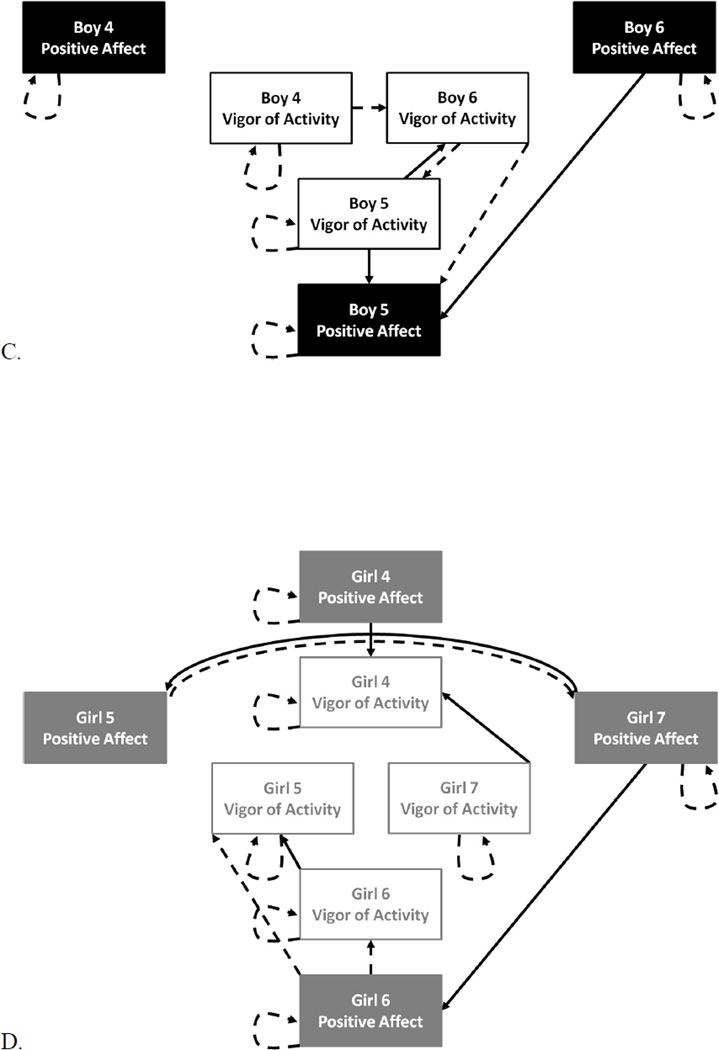
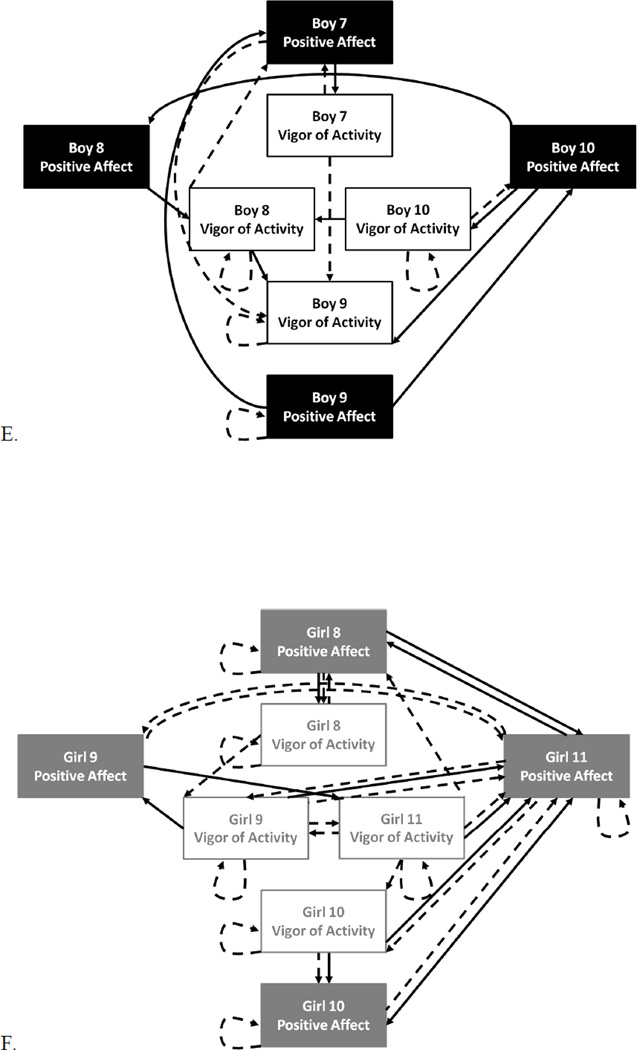
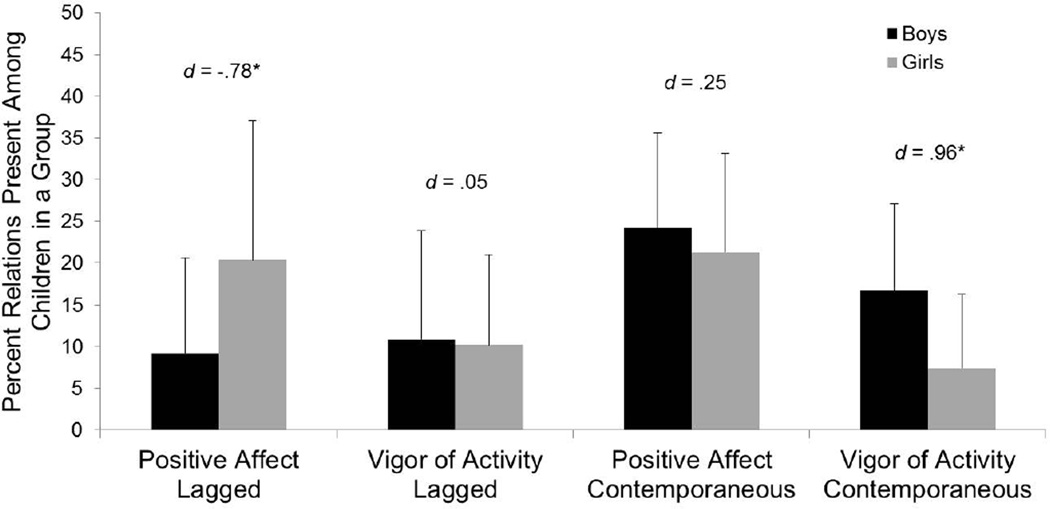
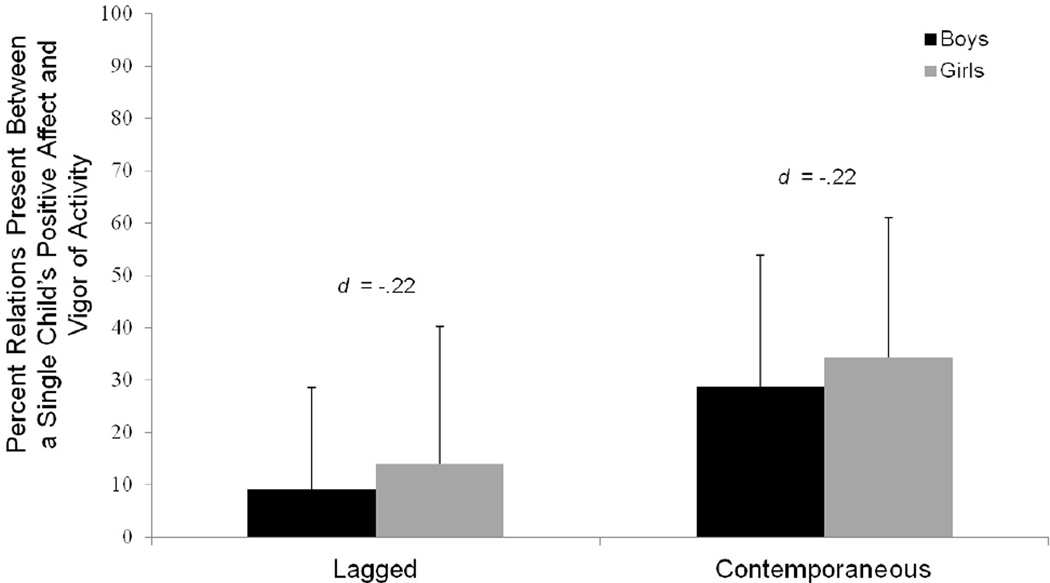
Developmental science is rich with observations of social interactions, but few available methodological and statistical approaches take full advantage of the information provided by these data. The authors propose implementation of the unified structural equation model (uSEM), a network analysis technique, for observational data coded repeatedly across time; uSEM captures the temporal dynamics underlying changes in behavior at the individual level by revealing the ways in which a single person influences - concurrently and in the future - other people. To demonstrate the utility of uSEM, the authors applied it to ratings of positive affect and vigor of activity during children's unstructured laboratory play with unfamiliar, same-sex peers. Results revealed the time-dependent nature of sex differences in play behavior. For girls more than boys, positive affect was dependent upon peers' prior positive affect. For boys more than girls, vigor of activity was dependent upon peers' current vigor of activity.
Keywords: gender differences; interpersonal interaction; networks; observational methodology; play; socio-temporal dynamics.
Figures
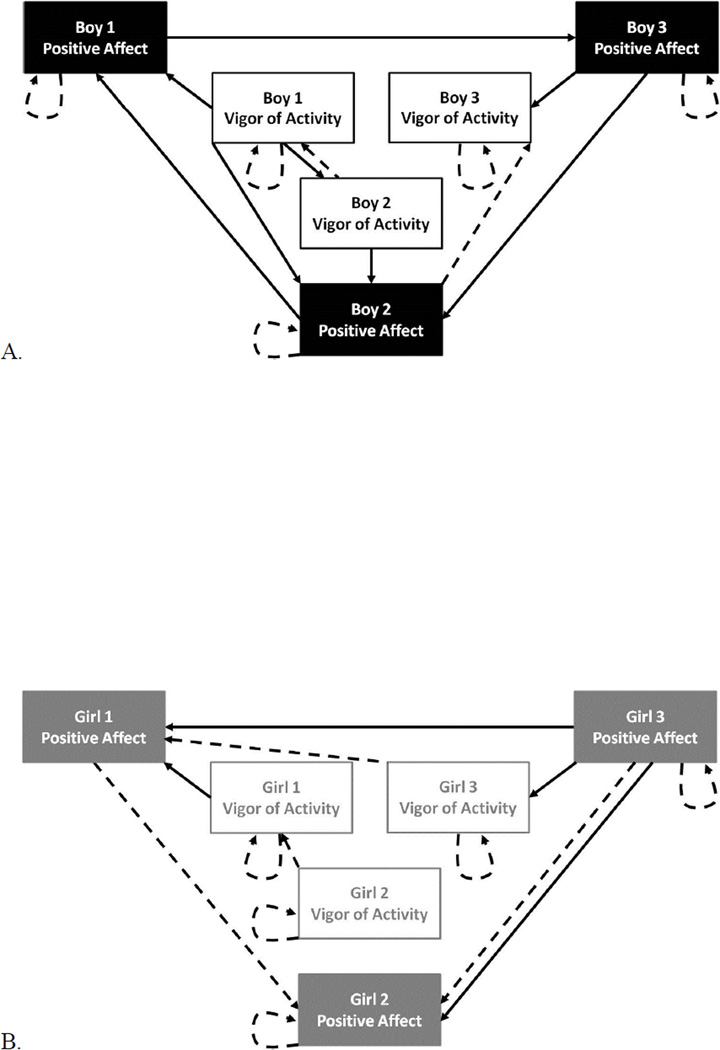
χ2(36, N=98) = 26.87, p = .860, CFI=1.00, TLI=1.00, SRMR=.048, RMSEA=.000;
χ2(37, N=86) = 29.00, p = .820, CFI=1.00, TLI=1.00, SRMR=.055, RMSEA=.000;
χ2(40, N=91) = 37.10, p = .600, CFI=1.00, TLI=1.00, SRMR=.076, RMSEA=.000;
χ2(77, N=92) = 64.22, p = .820, CFI=1.00, TLI=1.00, SRMR=.061, RMSEA=.000;
χ2(73, N=74) = 55.70, p = .930, CFI=1.00, TLI=1.00, SRMR=.061, RMSEA=.000;
χ2(60, N=87) = 82.22, p = .0300, CFI=.98, TLI=.97, SRMR=.039, RMSEA=.066.
References
-
- Bakeman R, Gottman JM. Observing inter-action: An introduction to sequential analysis. 2nd ed. New York: Cambridge University Press; 1997.
-
- Bakeman R, Quera V. Behavioral observation. In: Cooper H, editor. APA handbook of research methods in psychology: Vol. 1: Foundations, planning, methods, and psychometrics. Washington D.C.: American Psychological Association; 2012.
-
- Blakemore JEO, Berenbaum SA, Liben LS. Gender development. New York: Psychology Press / Taylor & Francis; 2009.
Grants and funding
LinkOut - more resources
Full Text Sources
Other Literature Sources