

Spike triggered covariance in strongly correlated gaussian stimuli
- PMID: 24039563
- PMCID: PMC3764020
- DOI: 10.1371/journal.pcbi.1003206
Spike triggered covariance in strongly correlated gaussian stimuli
Abstract
Many biological systems perform computations on inputs that have very large dimensionality. Determining the relevant input combinations for a particular computation is often key to understanding its function. A common way to find the relevant input dimensions is to examine the difference in variance between the input distribution and the distribution of inputs associated with certain outputs. In systems neuroscience, the corresponding method is known as spike-triggered covariance (STC). This method has been highly successful in characterizing relevant input dimensions for neurons in a variety of sensory systems. So far, most studies used the STC method with weakly correlated Gaussian inputs. However, it is also important to use this method with inputs that have long range correlations typical of the natural sensory environment. In such cases, the stimulus covariance matrix has one (or more) outstanding eigenvalues that cannot be easily equalized because of sampling variability. Such outstanding modes interfere with analyses of statistical significance of candidate input dimensions that modulate neuronal outputs. In many cases, these modes obscure the significant dimensions. We show that the sensitivity of the STC method in the regime of strongly correlated inputs can be improved by an order of magnitude or more. This can be done by evaluating the significance of dimensions in the subspace orthogonal to the outstanding mode(s). Analyzing the responses of retinal ganglion cells probed with [Formula: see text] Gaussian noise, we find that taking into account outstanding modes is crucial for recovering relevant input dimensions for these neurons.
Conflict of interest statement
The authors have declared that no competing interests exist.
Figures
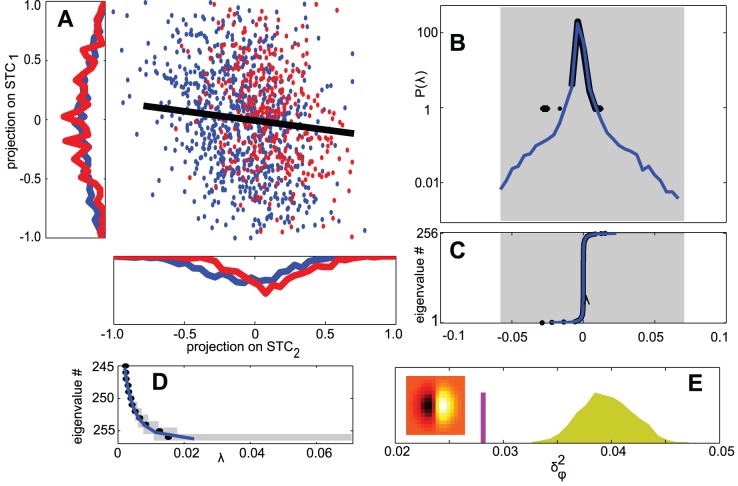
 (in units of pixel illumination). Marginal distributions are plotted for each dimension. Inputs that elicited a spike are shown in red, and those that did not in blue. By construction, the change in variance is larger along the first dimension. (B) The empirical eigenvalue distribution of
  (black) compared to the null distribution (blue). No eigenvalues of
  are found to be significant (shaded area indicates
  % confidence intervals for the support of the null distribution) (C) Rank ordered eigenvalues (black) plotted with the null distribution (blue). (D) Nested rank-wise significance testing. The highest ranked eigenvalues of
  are within the
  % confidence intervals derived from the null distribution constructed for each rank separately (see Materials and Methods for details). (E) For each random spike train we computed
  , the variance of the projection of the spike-triggered stimulus on the relevant feature
  (distribution shown in yellow). The purple line indicates
  for the real spike train, suggesting the spike train contains enough signal to determine the relevant feature as significant. Inset shows the relevant feature, a
  image patch (
 ). Simulation details:
  ,
,  ,
,  repetitions to find
  .
.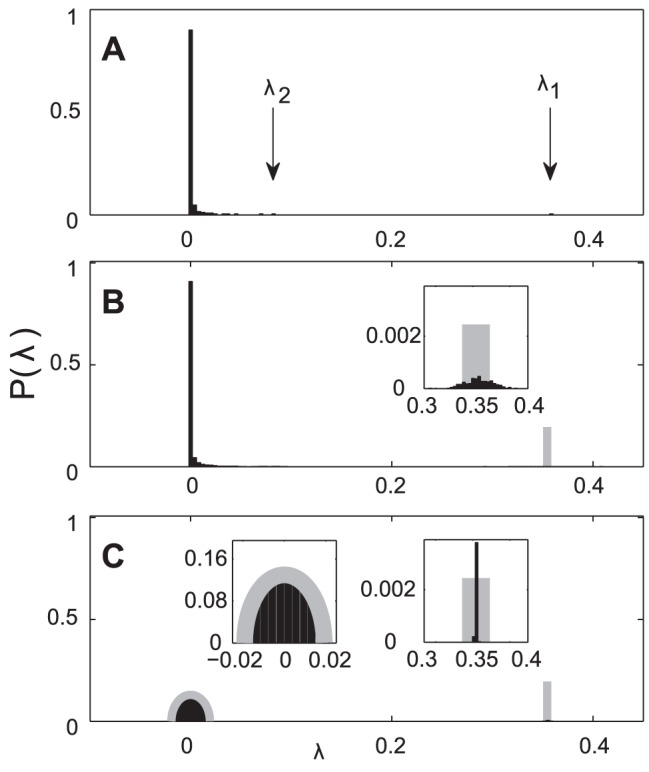
 (
( ) computed from the van Hateren data set. The largest eigenvalue (marked with an arrow) corresponds to an eigenvector with only positive components, and is
  times larger than the second largest eigenvalue (also marked) and
  times larger than the mean eigenvalue. (B) Eigenvalue distribution of a collection of sample covariance matrices computed from stimuli randomly drawn from a multivariate Gaussian distribution
  . In gray is the analytic prediction for the outstanding eigenvalue. The spread of these eigenvalues (black, inset) is in agreement with the prediction in Eq. (8). (C) Eigenvalue distribution of symmetric random matrices with elements randomly drawn from a distribution given by the elements in the sample covariance matrices. In gray is the complete prediction (semicircle and outstanding eigenvalue) given by Eq. (5). Diagonal and off-diagonal elements are drawn separately from the distribution of matrix elements in panel B.
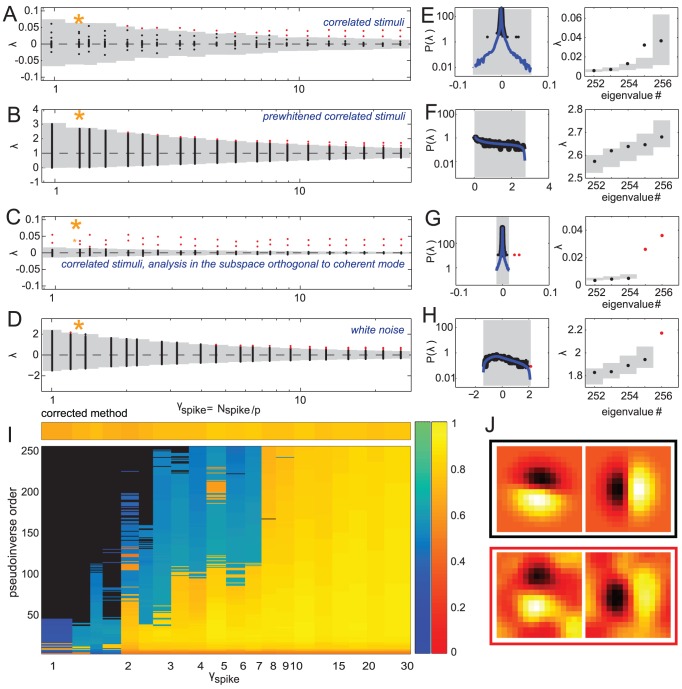
 for increasing dataset size in the case of strongly correlated Gaussian noise (A–C) and white noise (D). (A–D) The range of spikes covered is from
  to
to  . Panel B shows the results using the pre-whitening (“one-centered”) method, and panel C shows the results after evaluating significance in the subspace orthogonal to the coherent mode. Each vertical line shows the result of a single simulation. Significant (insignificant) eigenvalues are shown in red (black), and the range of the null distribution (1000 evaluations of
  ,
,  confidence interval) is shown in gray. (E–H, left) Gray shaded area is the support of the null distribution, which itself is plotted in blue. The significant (insignificant) portion of the spectrum of
  is plotted in red (black). These example spectra, with the corresponding significant vectors, are for conditions with a small number of spikes (indicated by an orange star in A–D) for which both of the formulations find no significant dimensions.
  ,
,  for the correlated stimulus condition in panels E–G,
  ,
,  for the white stimulus condition in panel H. (E–H, right) Results of the nested significance testing. We note that the second ranked eigenvalue in panel E is outside of its confidence interval, but still cannot be found to be significant. This happens because of the noise along the coherent mode. (I) STC analysis using all pseudoinverse orders using the nested significance testing with
  confidence intervals (large box) compared to the analysis using our proposed correction scheme. Black means no significant features were found for that combination of
  and pseudoinverse order. Cold (hot) colors indicate that one (two) features were found to be significant. The corresponding color bars on the right indicate the geometric average of the feature projections on the two model dimensions (cold colors) or the subspace overlap with the model, cf. Eq. (36) (hot colors). (J) Results when STC is performed using the proposed correction scheme. The two relevant dimensions (black frame) and the decorrelated significant features (red frame) have subspace overlap of 0.82. The models were defined such that the mean firing rate remained unchanged between the two stimulus conditions.
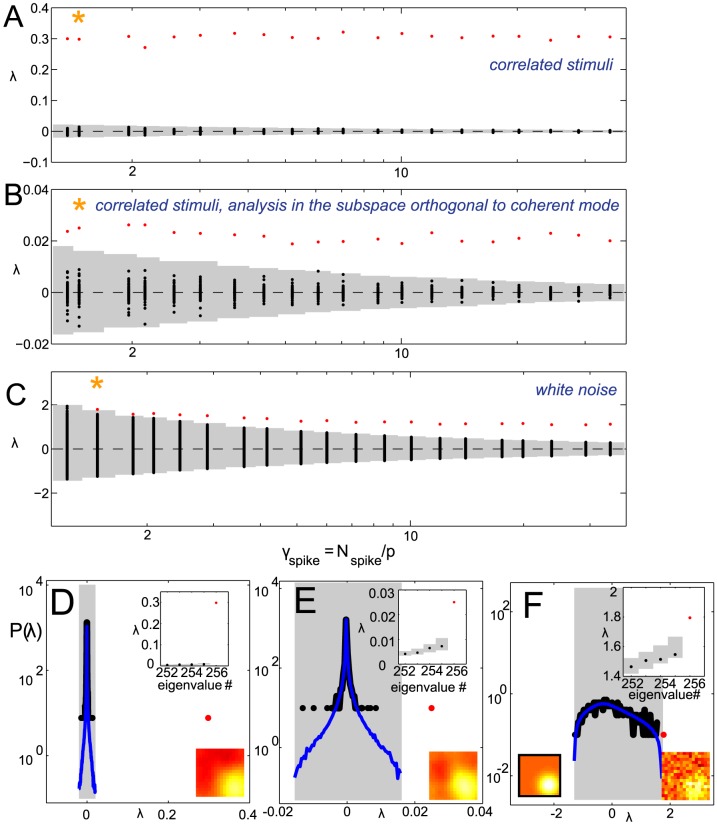
 for increasing dataset size in the case of strongly correlated Gaussian noise (A,B) and white noise (C). (A–C) The range of spikes covered is from
  to
to  . Panel B shows the results after evaluating significance in the subspace orthogonal to the coherent mode. Each vertical line shows the result of a single simulation. Significant (insignificant) eigenvalues are shown in red (black), and the
  percentile range of the null distribution (1000 evaluations of
  ) is shown in gray. (D–F) Gray shaded area is the support of the null distribution, which itself is plotted in blue. The correct feature is found using both stimulus conditions and both the original formulation of the STC method and our proposed correction.
  ,
,  for the correlated stimulus condition in panels D and E,
  ,
,  for the white stimulus condition in panel F (indicated by an orange star in panels A–C). Insets to panels D–F show the recovered feature (decorrelated in panels D,E) and the nested significance testing which does not affect the results. Black framed inset to panel D shows the model feature. The models were defined such that the mean firing rate remained unchanged between the two stimulus conditions.
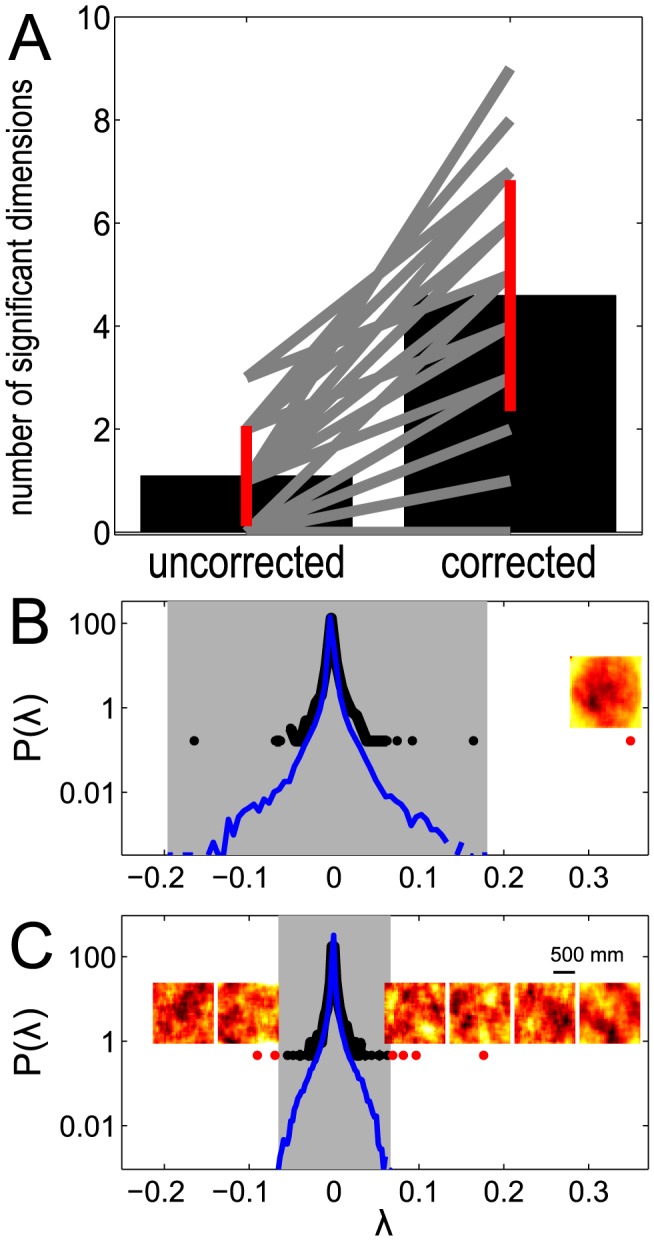
 in red (black) and the null eigenvalue distribution (blue) for an example cell. Null distribution were constructed using the global approach with
  shuffled spike trains. Without the correction scheme there is only one significant dimension. The corresponding visual feature is shown in the inset before decorrelation. (C) Same for the corrected covariance matrix
  . Here there are six significant dimensions with spots likely representing the subunits within the cell's receptive field. The gray shade indicates the range of the null distribution used to determine significance.
References
-
- Marr D, Hildreth E (1980) Theory of edge detection. Proc R Soc Lond 207: 187–217. - PubMed
-
- Touryan J, Felsen G, Dan Y (2005) Spatial structure of complex cell receptive fields measured with natural images. Neuron 45: 781–791. - PubMed
-
- Rust NC, Schwartz O, Movshon JA, Simoncelli EP (2005) Spatiotemporal elements of macaque v1 receptive fields. Neuron 46: 945–956. - PubMed
Publication types
MeSH terms
Grants and funding
LinkOut - more resources
Full Text Sources
Other Literature Sources
