. 2013 Sep 9;8(9):e73240.
doi: 10.1371/journal.pone.0073240. eCollection 2013.

Beta cell 5'-shifted isomiRs are candidate regulatory hubs in type 2 diabetes

Affiliations

Beta cell 5'-shifted isomiRs are candidate regulatory hubs in type 2 diabetes

Jeanette Baran-Gale et al. PLoS One. .

Abstract

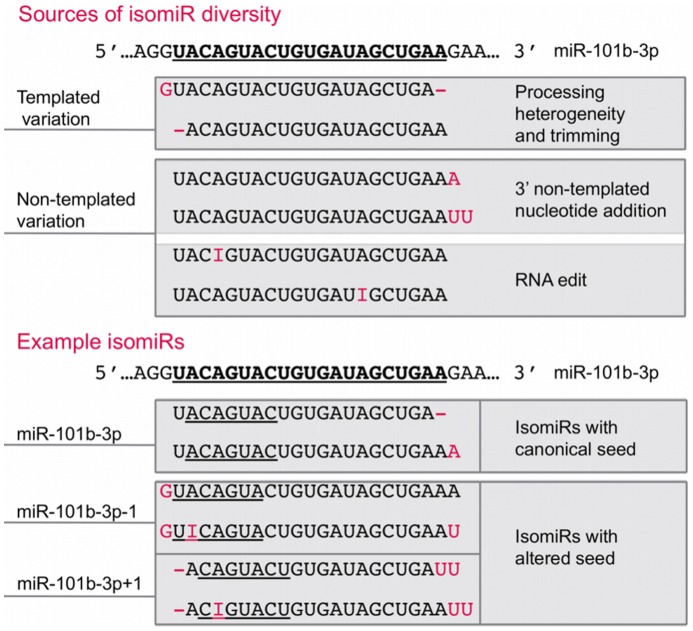
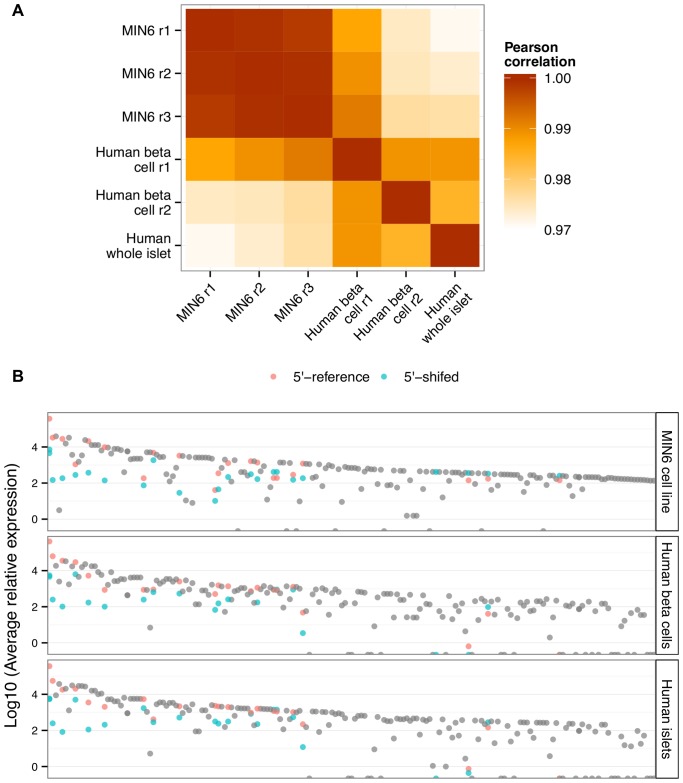
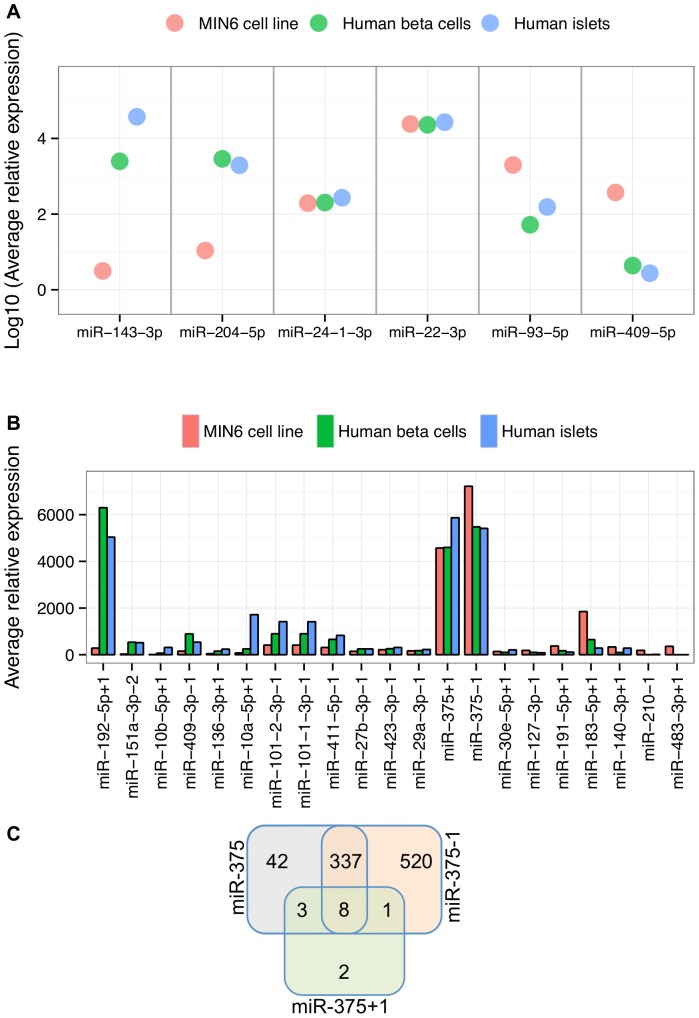
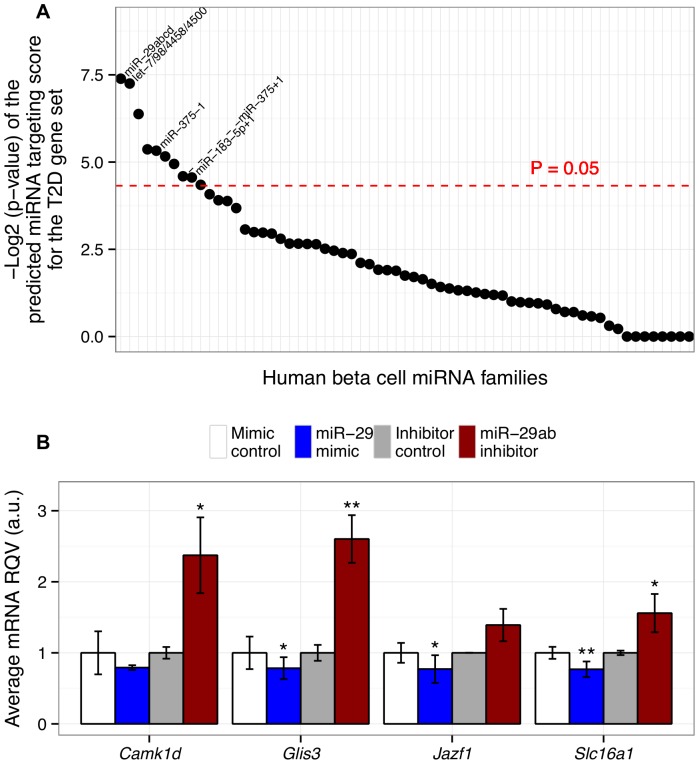
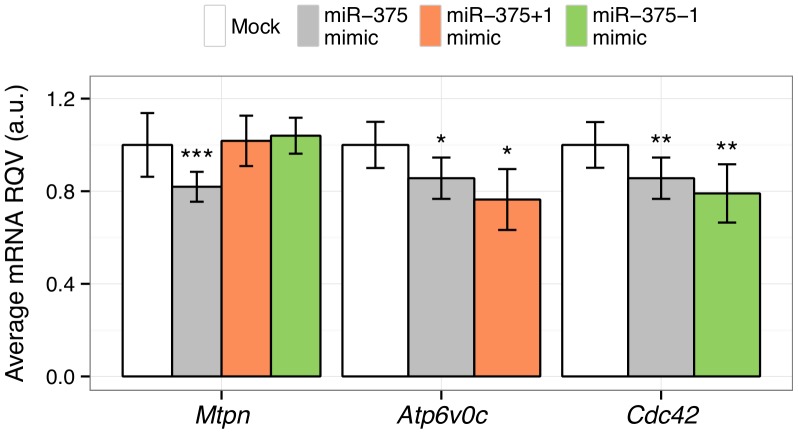
Next-generation deep sequencing of small RNAs has unveiled the complexity of the microRNA (miRNA) transcriptome, which is in large part due to the diversity of miRNA sequence variants ("isomiRs"). Changes to a miRNA's seed sequence (nucleotides 2-8), including shifted start positions, can redirect targeting to a dramatically different set of RNAs and alter biological function. We performed deep sequencing of small RNA from mouse insulinoma (MIN6) cells (widely used as a surrogate for the study of pancreatic beta cells) and developed a bioinformatic analysis pipeline to profile isomiR diversity. Additionally, we applied the pipeline to recently published small RNA-seq data from primary human beta cells and whole islets and compared the miRNA profiles with that of MIN6. We found that: (1) the miRNA expression profile in MIN6 cells is highly correlated with those of primary human beta cells and whole islets; (2) miRNA loci can generate multiple highly expressed isomiRs with different 5'-start positions (5'-isomiRs); (3) isomiRs with shifted start positions (5'-shifted isomiRs) are highly expressed, and can be as abundant as their unshifted counterparts (5'-reference miRNAs). Finally, we identified 10 beta cell miRNA families as candidate regulatory hubs in a type 2 diabetes (T2D) gene network. The most significant candidate hub was miR-29, which we demonstrated regulates the mRNA levels of several genes critical to beta cell function and implicated in T2D. Three of the candidate miRNA hubs were novel 5'-shifted isomiRs: miR-375+1, miR-375-1 and miR-183-5p+1. We showed by in silico target prediction and in vitro transfection studies that both miR-375+1 and miR-375-1 are likely to target an overlapping, but distinct suite of beta cell genes compared to canonical miR-375. In summary, this study characterizes the isomiR profile in beta cells for the first time, and also highlights the potential functional relevance of 5'-shifted isomiRs to T2D.


Conflict of interest statement

Competing Interests: The authors have declared that no competing interests exist.

Figures

Figure 1
Figure 1. Sources of isomiR diversity.
The top panel illustrates sources of isomiR diversity, which stratify into two classes: templated and non-templated variations. As illustrated by the bottom panel, an isomiR may contain one or both types of variations, and both templated (e.g. 5′-shifts) and non-templated (e.g. RNA edits) variations can create an isomiR with an altered seed. The seed region of each isomiR is underlined.
Figure 2
Figure 2. miRNA and isomiR profiles in MIN6 cells, primary human beta cells and human islet.
(A) A heatmap is shown depicting the Pearson correlation coefficients of miRNA profiles between pairs of samples analyzed in this study. (B) The x-axis depicts highly expressed miRNAs ordered from left to right by decreasing maximal expression across all samples. The y-axis depicts the Log10 of the average read count per million. Each dot represents a miRNA. miRNAs from a homogenous locus (a pre-miRNA that produces only one mature miRNA per arm of the hairpin) are in gray. miRNAs from a heterogeneous locus (a pre-miRNA that produces more than one mature miRNA per arm of the hairpin) are either pink (5′-reference) or blue (5′-shifted).
Figure 3
Figure 3. Comparison of 5′-reference miRNA and 5′-shifted isomiR expression levels among MIN6 cells, human beta cells, and human islet.
(A) The x-axis lists selected 5′-reference miRNAs in MIN6 (red), human beta cells (green), and human islets (blue). The y-axis depicts the Log10 of the average read count per million for each 5′-reference miRNA in each sample. (B) The x-axis shows the highly expressed 5′-shifted isomiRs ordered from left to right by decreasing fold-difference between primary human beta cells and MIN6 cells. The y-axis depicts the average read count per million for each 5′-shifted isomiR. (C) The number of genes with at least one conserved target site for miR-375 (gray), miR-375+1 (green), and miR-375-1 (orange) is shown. All sets are mutually exclusive: for example, a total of 390 genes have predicted conserved miR-375 target sites (42 unique to miR-375, 3 shared with miR-375+1 only, 337 shared with miR-375-1 only, and 8 common to all three).
Figure 4
Figure 4. Candidate miRNA regulatory hubs in a type 2 diabetes gene network.
(A) Each data point represents a 5′-reference miRNA or a 5′-shifted isomiR from primary human beta cells, and the y-axis shows the negative Log2 of the p-value of the predicted miRNA targeting score among genes in a type 2 diabetes (T2D) network. The dashed red line denotes the significance threshold (empirical P = 0.05). (B) Effects of miR-29 mimic and inhibitor in MIN6 cells on the mRNA levels of four T2D genes are shown. The x-axis lists the gene symbols for each of four predicted miR-29 target genes and the y-axis depicts the relative quantitative value (RQV; expression determined by RT-qPCR and normalized to Rps9) in response to the miR-29 mimic (blue) or the miR-29 inhibitor (red) relative to mock transfection. The data shown represent at least two independent experiments, each conducted in triplicate. P-values were calculated based on Student’s t-tests. *, P<0.05; **, P<0.01.
Figure 5
Figure 5. Evaluation of miR-375 and its 5′-shifted isomiRs in MIN6 cells.
Effects of mimics for 5′-reference miR-375, 5′-shifted miR-375+1, and 5′shifted miR-375-1 in MIN6 cells on the mRNA levels of three genes are shown. Mtpn is a known target of 5′-reference miR-375 but not predicted as a target for either of the 5′-shifted miR-375 isomiRs; Atp6v0c is predicted to be preferentially targeted by miR-375+1; and Cdc42 is predicted to be preferentially targeted by miR-375-1. The x-axis lists the gene symbols for each of three genes tested. The y-axis depicts the relative quantitative value (RQV; expression determined by RT-qPCR and normalized to Rps9) in response to the miR-375 mimic (gray), miR-375+1 mimic (orange), or miR-375-1 mimic (green) relative to mock transfection. The data shown represent at least two independent experiments, each conducted in triplicate. P-values were calculated based on Student’s t-tests. *, P<0.05; **, P<0.01, ***, P<0.001.

References

    1. Kim VN (2005) MicroRNA biogenesis: coordinated cropping and dicing. Nat Rev Mol Cell Biol 6: 376–385 doi:10.1038/nrm1644 - DOI - PubMed
    1. Kim VN, Han J, Siomi MC (2009) Biogenesis of small RNAs in animals. Nat Rev Mol Cell Biol 10: 126–139 doi:10.1038/nrm2632 - DOI - PubMed
    1. Bartel DP (2009) MicroRNAs: target recognition and regulatory functions. Cell 136: 215–233 doi:10.1016/j.cell.2009.01.002 - DOI - PMC - PubMed
    1. Bartel DP (2004) MicroRNAs: genomics, biogenesis, mechanism, and function. Cell 116: 281–297. - PubMed
    1. Hudder A, Novak RF (2008) miRNAs: effectors of environmental influences on gene expression and disease. Toxicol Sci 103: 228–240 doi:10.1093/toxsci/kfn033 - DOI - PMC - PubMed

Publication types