. 2013 Sep 9;8(9):e73297.
doi: 10.1371/journal.pone.0073297. eCollection 2013.

The stack: a new bacterial structure analyzed in the Antarctic bacterium Pseudomonas deceptionensis M1(T) by transmission electron microscopy and tomography

Affiliations

The stack: a new bacterial structure analyzed in the Antarctic bacterium Pseudomonas deceptionensis M1(T) by transmission electron microscopy and tomography

Lidia Delgado et al. PLoS One. .

Abstract

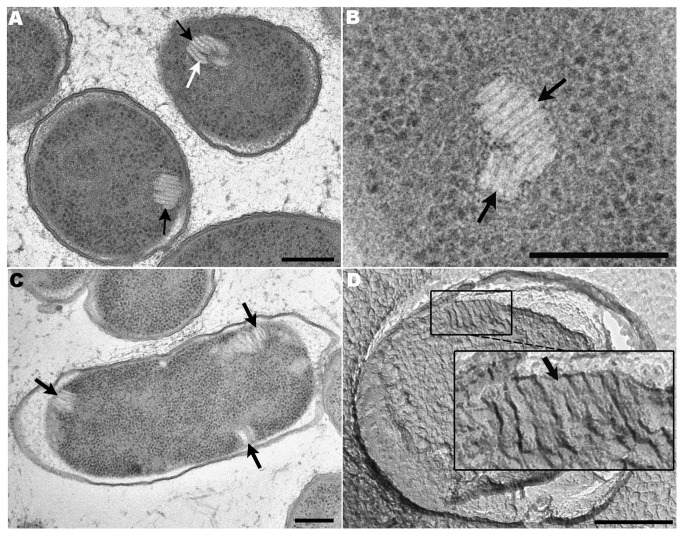
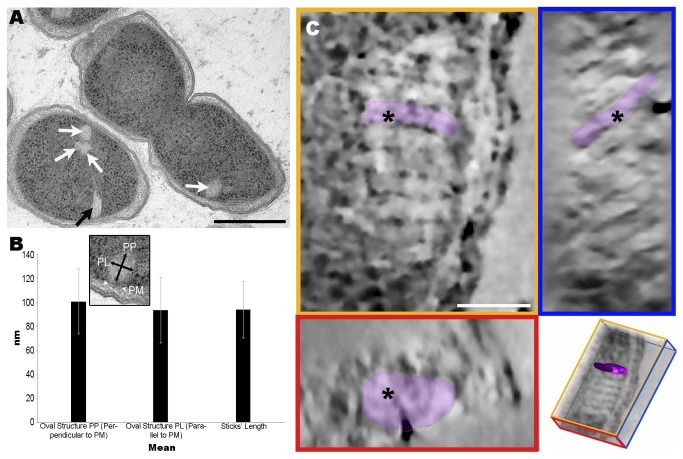
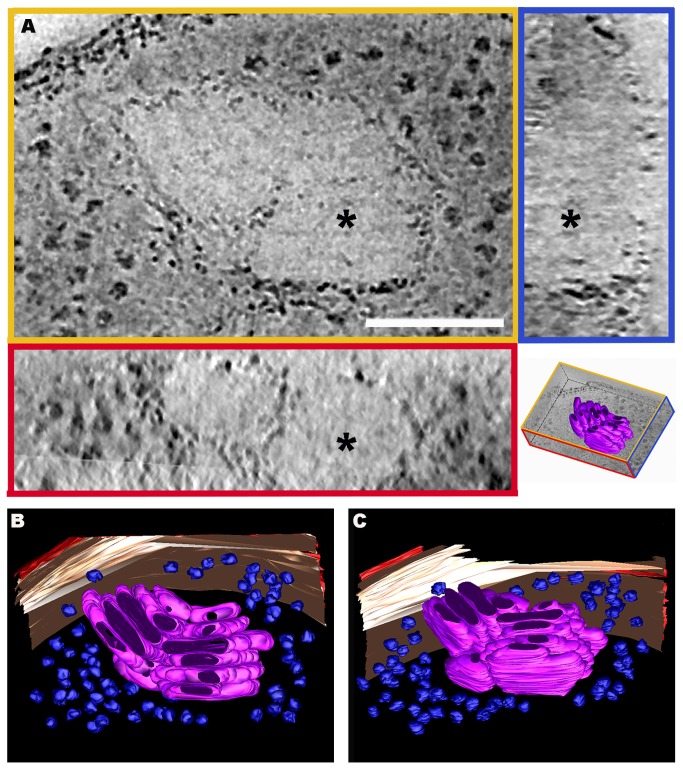
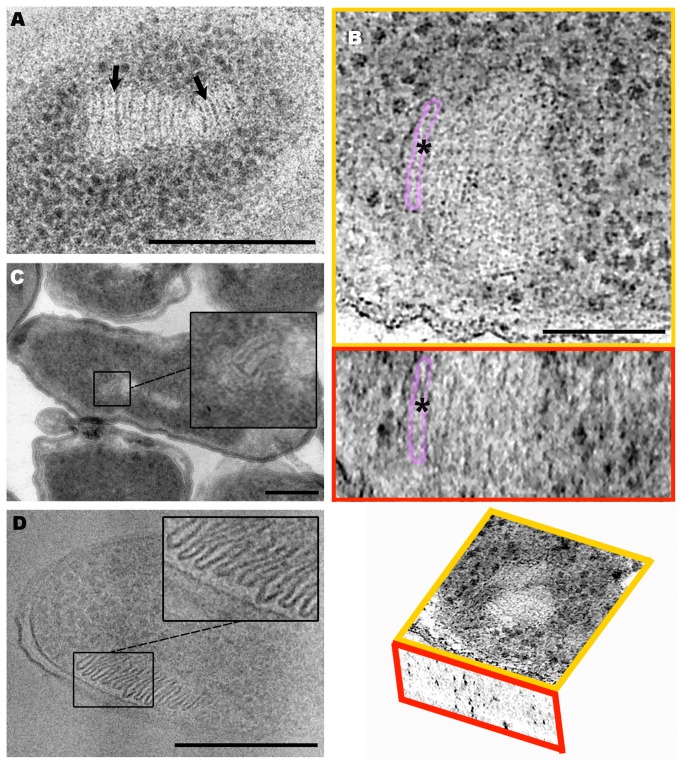
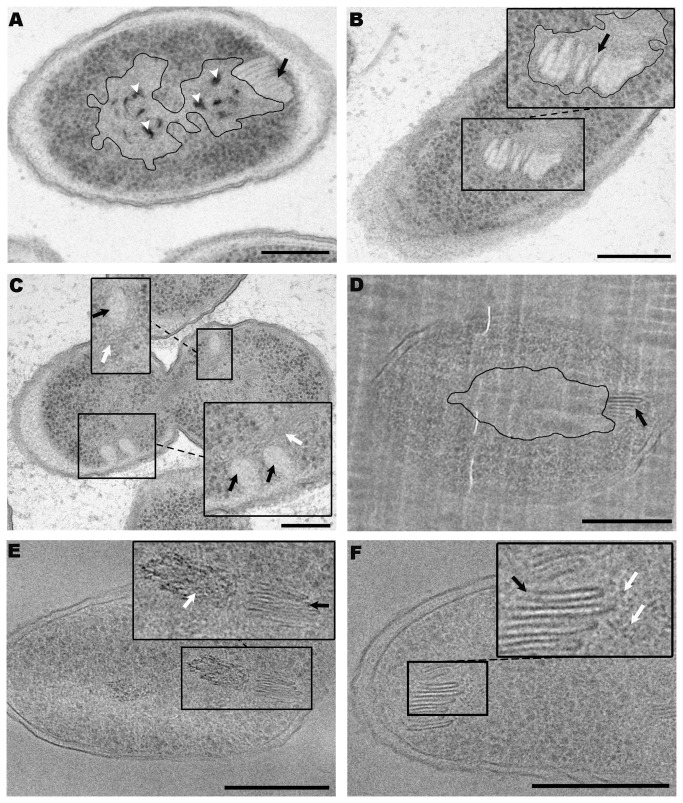
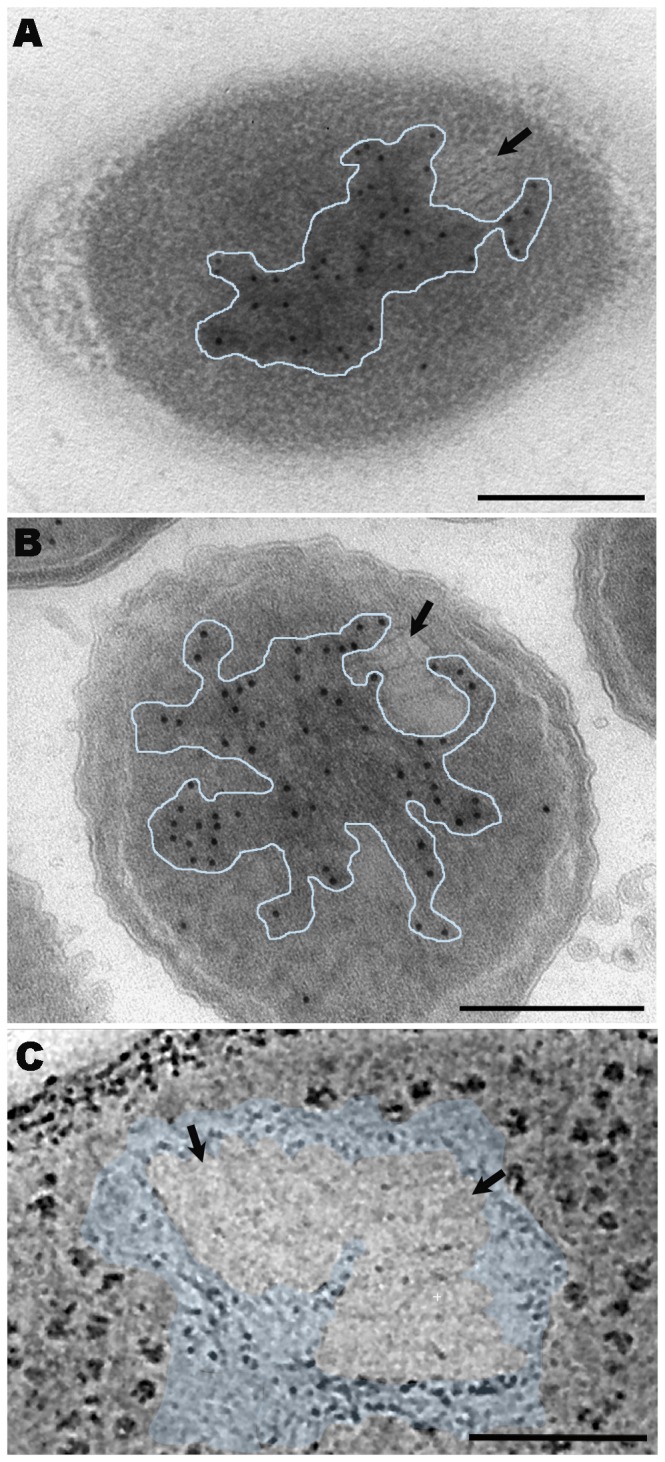
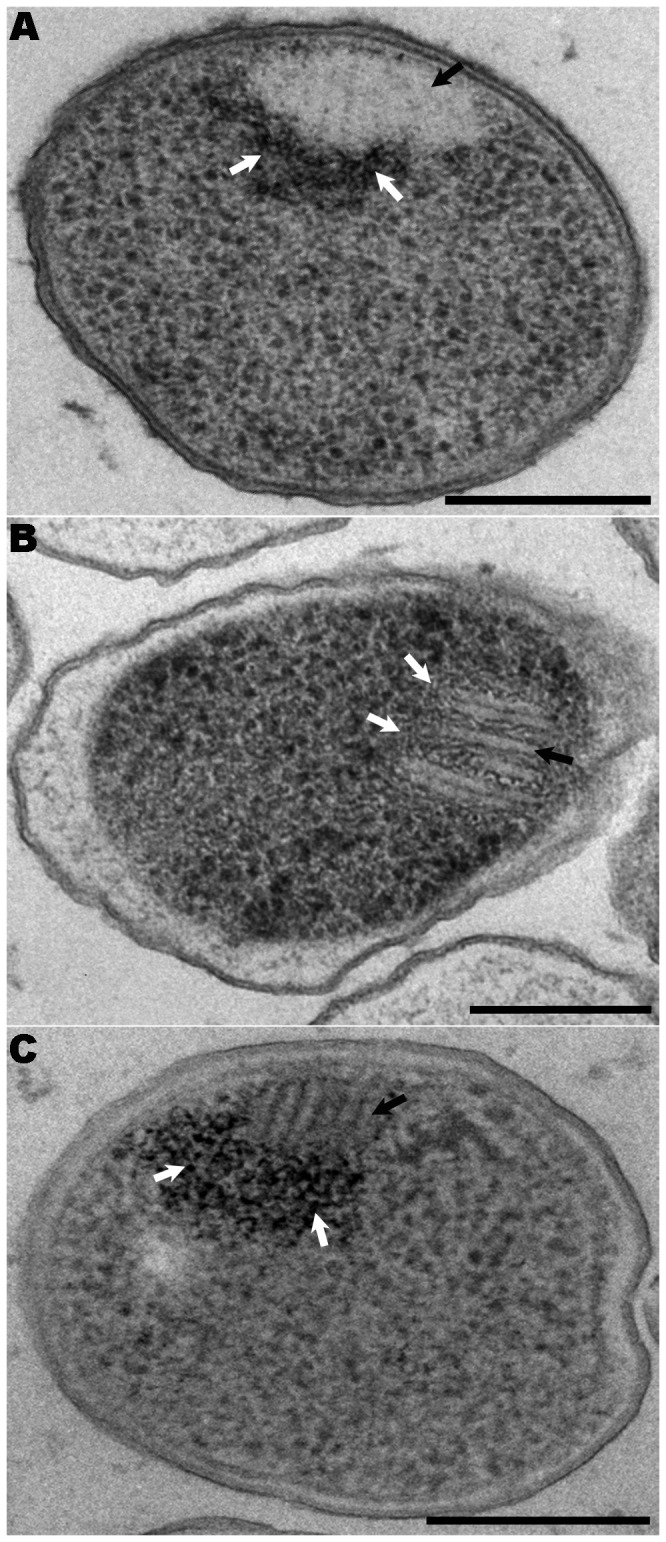
In recent years, improvements in transmission electron microscopy (TEM) techniques and the use of tomography have provided a more accurate view of the complexity of the ultrastructure of prokaryotic cells. Cryoimmobilization of specimens by rapid cooling followed by freeze substitution (FS) and sectioning, freeze fracture (FF) and observation of replica, or cryoelectron microscopy of vitreous sections (CEMOVIS) now allow visualization of biological samples close to their native state, enabling us to refine our knowledge of already known bacterial structures and to discover new ones. Application of these techniques to the new Antarctic cold-adapted bacterium Pseudomonasdeceptionensis M1(T) has demonstrated the existence of a previously undescribed cytoplasmic structure that does not correspond to known bacterial inclusion bodies or membranous formations. This structure, which we term a "stack", was mainly visualized in slow growing cultures of P. deceptionensis M1(T) and can be described as a set of stacked membranous discs usually arranged perpendicularly to the cell membrane, but not continuous with it, and found in variable number in different locations within the cell. Regardless of their position, stacks were mostly observed very close to DNA fibers. Stacks are not exclusive to P. deceptionensis M1(T) and were also visualized in slow-growing cultures of other bacteria. This new structure deserves further study using cryoelectron tomography to refine its configuration and to establish whether its function could be related to chromosome dynamics.


Conflict of interest statement

Competing Interests: The authors have declared that no competing interests exist.

Figures

Figure 1
Figure 1. TEM micrographs of organized structures (stacks) located in the cytoplasm of TSA-grown cultures of P . deceptionensis M1T.
(A–C) 60 nm Epon sections of samples processed by HPF-FS. (A) Elongated clustered parallel sticks located perpendicular to the PM (black arrows). Most sticks are visualized as straight units, but a slight curvature is observed in some of them (white arrow). (B) Two contiguous and differently oriented stacks in the bacterial cytoplasm (black arrows). (C) Three stacks perpendicular to the PM at different locations within the cytoplasm of a cell (black arrows). (D) A replica micrograph from a propane cryoimmobilized, FF and shadowed sample. A stack is observed perpendicular to the PM and comprised by about 8 sticks (see black arrow in the magnified area). Scale bars = 250 nm.
Figure 2
Figure 2. TEM analysis of oval structures observed in P . deceptionensis M1T TSA-grown cultures processed by HPF-FS.
(A) A 60 nm Epon section showing a stack (black arrow) and oval structures (white arrows). Scale bar = 250 nm. (B) Graph comparing the oval structure measurements (PP, PL) and the length of the sticks. The error bars correspond to standard deviation values (SD) (PP). Perpendicular; (PL) Parallel; (PM) Plasma membrane. (C) 4 nm tomogram slices from the XYZ views of a bbif-filtered tomogram reconstructed from 250 nm Epon sections. The asterisks correspond to the same point through the different views XYZ. The XY view (top-left image) reveals a stack perpendicular to the PM, in which one clustered unit has been colored. The YZ view (top-right image) shows the same stack in which sticks are distributed obliquely within the section. The dyed unit corresponds to the one colored before. The XZ view (bottom-left image) shows the same dyed stick observed as an oval structure. The bottom right picture corresponds to a scheme of the view’s distribution in the tomogram where the highlighted unit has been segmented. Scale bar = 50 nm.
Figure 3
Figure 3. 3D visualization of stacks observed in P . deceptionensis M1T cells after HPF-FS.
(A) 2 nm tomogram slices from the XYZ views of a bbif-filtered tomogram reconstructed from a 250 nm Epon section. The asterisks correspond to the same point through the different views. Scale bar = 100 nm. The XY view (top-left image) shows a peripheral portion of the cytoplasm of a cell where two contiguous stacks can be visualized. The YZ view (top right image) shows the clustered sticks from the stack on the right in the XY view. The XZ view (bottom left image) reveals two stacked units as oval structures. The bottom right picture corresponds to a scheme of the view’s distribution in the tomogram. (B–C) Two different views from the segmentation of the tomogram observed in (A), which reveal the 3D structure of the stacks within the tomogram as groups of oval discs. In red, the outer membrane; in cream-color, the PM; in blue, the ribosomes; and in pink, the discs.
Figure 4
Figure 4. TEM and Cryo-TEM analysis of stacks of P . deceptionensis M1T.
(A) A 60 nm Epon section from a sample processed by HPF-FS. A stack is visualized composed by clustered discs transversally cut, each of which is delimited by a membrane-like structure (black arrows). Scale bar = 250 nm. (B) 1.5 nm tomogram slices from the XYZ views of a bflow-filtered tomogram reconstructed from 250 nm Lowicryl HM23 sections. The asterisks correspond to the same point through the different views. The XY (top image) and the XZ (middle image) views show flat clustered discs transversally cut and perpendicularly distributed to the PM in a fragment of a cell. A membrane-like structure is observed surrounding each flat disc, one of which has been colored in both views. The bottom picture is a scheme of the view’s distribution in the tomogram. Scale bar = 100 nm. (C) A 60 nm Tokuyasu section. Stacked discs are also observed well delimited by a membrane-like structure (see magnified squared area). Scale bar = 250 nm. (D) A 50 nm vitreous cryosection micrograph (CEMOVIS). Clustered discs are observed clearly delimited by a membrane (see squared area). Scale bar = 250 nm.
Figure 5
Figure 5. Study of the proximity between stacks and DNA observed in TSA-grown cultures of P . deceptionensis M1T cells.
(A–C) TEM micrographs of 60 nm Epon sections of samples processed by HPF-FS. (A) A stack (black arrow) perpendicular to the PM and very close to the bacterial nucleoid (outlined area). The bacterial nucleoid shows dark spots, corresponding to poly P granules (white arrow heads). (B) A stack (black arrow) embedded in the nucleoid area (outlined area) is shown. (C) A P . deceptionensis M1T dividing cell distributing its DNA between its daughter cells is observed, in which stacks (black arrows) are visualized very close to the DNA (white arrows). (D–F) Cryo-TEM micrographs of 50 nm vitreous cryosections (CEMOVIS). (D) A stack (black arrow) is observed very close to a ribosome free area (RFA), corresponding to the nucleoid area (outlined area). (E) A stack (black arrow) is placed in the vicinities of a locally ordered arrangement of DNA microfibers (white arrow). (F) A stack (black arrow) is visualized very close to DNA microfibers (white arrows). Scale bars = 250 nm.
Figure 6
Figure 6. TEM immunolabeling and tomographic studies analyzing the proximity between stacks and DNA in TSA-grown cultures of P . deceptionensis M1T.
(A) DNA immunolabeling on 60 nm HM23 Lowicryl sections from samples processed by HPF-FS. (B) DNA immunolabeling on a 60 nm Tokuyasu sections. (A–B) Stacks were observed very close to and partially embedded in to the gold-labeled nucleoid area (see black arrows pointing stacks and outlined areas corresponding to the nucleoids). (C) A 2 nm tomogram slice of a bbif-filtered tomogram reconstructed from a 250 nm Epon section of a sample processed by HPF-FS. Two contiguous stacks are observed (black arrows) embedded in the nucleoid area (see colored area). Scale bars = 250 nm.
Figure 7
Figure 7. Stacks visualized in different Pseudomonas species from samples processed by HPF-FS.
(A–C) 60 nm Epon sections. (A) P. psychrophila DSM 17535T TSA-grown culture. (B) P . fragi DSM 3456T TSA-grown culture. (C) P. fluorescens ATCC 13430T TSA-grown culture. (A–C) The three strains show stacks perpendicularly distributed to the PM (see black arrows) very close to DNA microfibers (see white arrows). Scale bars = 250 nm.

Similar articles

Cited by

References

    1. Walsby AE (1994) Gas vesicles. Microbiol Rev 58: 94–144. PubMed: 8177173. - PMC - PubMed
    1. Shively JM, Ball F, Brown DH, Saunders RE (1973) Functional Organelles in Prokaryotes: Polyhedral Inclusions (Carboxysomes) of Thiobacillus neapolitanus. Science 182: 584–586. doi:10.1126/science.182.4112.584. PubMed: 4355679. - DOI - PubMed
    1. Parsons JB, Dinesh SD, Deery E, Leech HK, Brindley AA et al. (2008) Biochemical and Structural Insights into Bacterial Organelle Form and Biogenesis. J Biol Chem 283: 14366–14375. doi:10.1074/jbc.M709214200. PubMed: 18332146. - DOI - PubMed
    1. O’Connell JD, Zhao A, Ellington AD, Marcotte EM (2012) Dynamic Reorganization of Metabolic Enzymes into Intracellular Bodies. Annu Rev Cell Dev Biol 28: 89–111. doi:10.1146/annurev-cellbio-101011-155841. PubMed: 23057741. - DOI - PMC - PubMed
    1. Shively JM (1974) Inclusion bodies of prokaryotes. Annu Rev Microbiol 28: 167–187. doi:10.1146/annurev.mi.28.100174.001123. PubMed: 4372937. - DOI - PubMed

Publication types

MeSH terms