. 2013 Sep 6;8(9):e73353.
doi: 10.1371/journal.pone.0073353. eCollection 2013.

Resection probability maps for quality assessment of glioma surgery without brain location bias

Affiliations

Resection probability maps for quality assessment of glioma surgery without brain location bias

Philip C De Witt Hamer et al. PLoS One. .

Abstract

Background: Intraoperative brain stimulation mapping reduces permanent postoperative deficits and extends tumor removal in resective surgery for glioma patients. Successful functional mapping is assumed to depend on the surgical team's expertise. In this study, glioma resection results are quantified and compared using a novel approach, so-called resection probability maps (RPM), exemplified by a surgical team comparison, here with long and short experience in mapping.

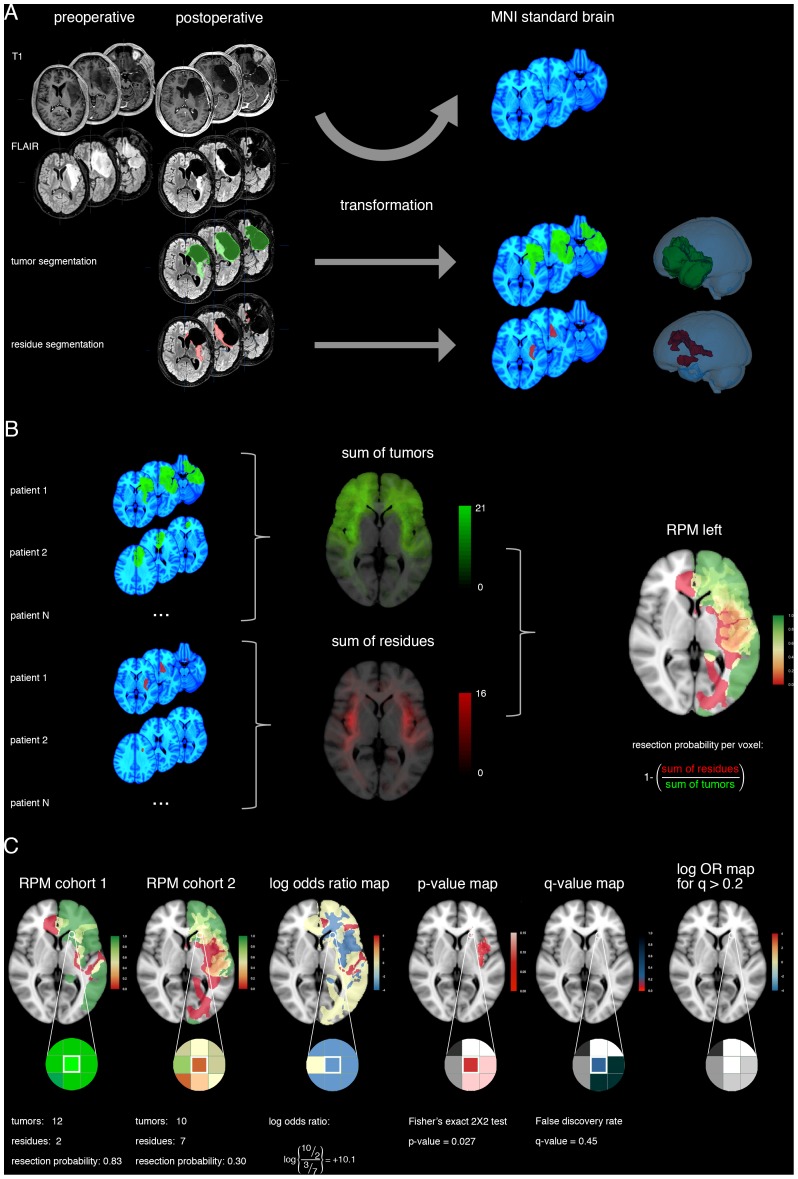
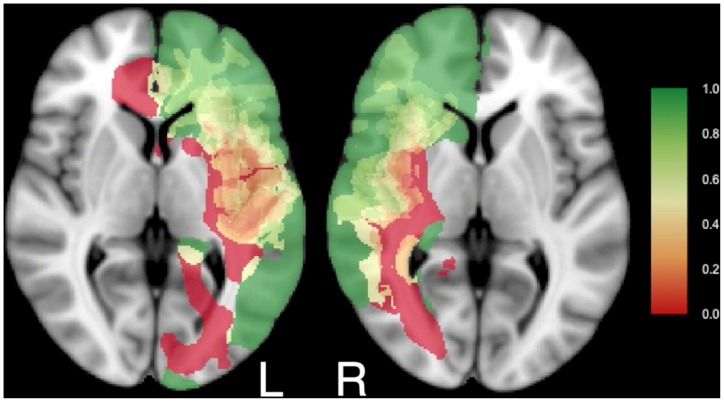
Methods: Adult patients with glioma were included by two centers with two and fifteen years of mapping experience. Resective surgery was targeted at non-enhanced MRI extension and was limited by functional boundaries. Neurological outcome was compared. To compare resection results, we applied RPMs to quantify and compare the resection probability throughout the brain at 1 mm resolution. Considerations for spatial dependence and multiple comparisons were taken into account.

Results: The senior surgical team contributed 56, and the junior team 52 patients. The patient cohorts were comparable in age, preoperative tumor volume, lateralization, and lobe localization. Neurological outcome was similar between teams. The resection probability on the RPMs was very similar, with none (0%) of 703,967 voxels in left-sided tumors being differentially resected, and 124 (0.02%) of 644,153 voxels in right-sided tumors.

Conclusion: RPMs provide a quantitative volumetric method to compare resection results, which we present as standard for quality assessment of resective glioma surgery because brain location bias is avoided. Stimulation mapping is a robust surgical technique, because the neurological outcome and functional-based resection results using stimulation mapping are independent of surgical experience, supporting wider implementation.


Conflict of interest statement

Competing Interests: The authors have declared that no competing interests exist.

Figures

Figure 1
Figure 1. RPM processing and statistical comparison.
(A) For a patient, the glioma tumor volume (green) and residual volume (red) are obtained by segmentation of postoperative MRI FLAIR sequence images. Then the transformation from the patient's brain to standard brain space (MNI152 shown in blue) is calculated by non-linear registration, and the segmented volumes are transformed accordingly. A 3D reconstruction of the brain and volumes in standard brain space are shown. (B) For each patient cohort, summation of the tumor volumes at each voxel provides a tumor localization map (green). Similarly, summation of the residual volumes at each voxel provides a residual localization map (red). The number of patient volumes contained in a voxel is provided as green-scale and red-scale legends. The probability of resection at each voxel is calculated by dividing the number of patients without residual tumor by the number of patients with a glioma at a specific voxel. This results in a resection probability map (RPM) for each hemisphere (here shown for left-sided tumors) to discern contralateral from ipsilateral tumor extension. The RPM legend represents the probability of resection from 0 (red) via 0.5 (yellow) to 1 (green). (C) For statistical comparison of RPMs between cohorts, here the left-hemisphere results are plotted as an example for a single voxel. From these RPMs, the log odds ratio map, adjusted p-value map and q-value map are derived, as detailed in the Methods section. Legends for log odds ratios, p- and q-values are provided. As a calculation example the information for one voxel is included with a probability of resection of 10 out of 12 patients, and 3 out of 10 patients, respectively. This results in a log odds ratio of 10.1, an adjusted p-value of 0.027, and a q-value of 0.45, which is above the arbitrary threshold of 0.2 for false discovery and therefore considered an indifferential resection result at the outlined voxel.
Figure 2
Figure 2. Glioma locations within the brain are dissimilar between cohorts.
Four transversal sections from (A) the junior team's cohort, n = 52, and (B) the senior team's cohort, n = 56, are shown superimposed on standard brain space (MNI152). More gliomas are located in the left insula and left temporal lobe in the senior team's cohort. More gliomas are located in the left supplementary motor cortex and right temporal lobe in the junior team's cohort. The legend refers to the number of patients with glioma tissue at a voxel. See Movie S1 for all transversal sections.
Figure 3
Figure 3. Resection probability maps for right-sided gliomas.
Results comparing (A) the junior surgical team, n = 29, and (B) the senior surgical team, n = 29, are shown superimposed on standard brain space (MNI152). A probability of 0 (red) represents locations where tumor was never resected, and a probability of 1 (green) represents locations where tumor was resected in all patients. An intermediate probability (yellow) represents locations where glioma was removed in a subset of patients. (C) Relative differences in probability of resection as log odds ratio. (D) The adjusted p-value map adjusted by the empirical null-distribution to address spatial dependency of voxels. Values less than 0.15 are plotted in shades of red. (E) The q-value map to address multiple testing. Values below 0.2 are plotted in shades of red, values between 0.2 and 0.8 in shades of blue. (F) Differences in probability of resection as log odds ratio for voxels with a q-value less than 0.2 demonstrate similar resection results between the two patient cohorts. Results are superimposed on a transversal section at z = 0 of MNI152. See Movie S2 for all transversal sections.
Figure 4
Figure 4. Resection probability maps for left-sided gliomas.
Results comparing the junior surgical team, n = 23, and the senior surgical team, n = 27. Coding and legends as in Fig. 3. See Movie S3 for all transversal sections.
Figure 5
Figure 5. The minimal common brain for the left and right hemisphere.
Results of resection probability from the junior (n = 52) and senior team (n = 56) were combined. Legend as in Fig. 3A and 3B. See Movie S4 for all transversal sections.

References

    1. Jakola AS, Myrmel KS, Kloster R, Torp SH, Lindal S, et al. (2012) Comparison of a strategy favoring early surgical resection vs a strategy favoring watchful waiting in low-grade gliomas. JAMA 308: 1881–1888. - PubMed
    1. Smith JS, Chang EF, Lamborn KR, Chang SM, Prados MD, et al. (2008) Role of extent of resection in the long-term outcome of low-grade hemispheric gliomas. J Clin Oncol 26: 1338–1345. - PubMed
    1. Berger MS, Hadjipanayis CG (2007) Surgery of intrinsic cerebral tumors. Neurosurgery 61: 279–304. - PubMed
    1. Tharin S, Golby A (2007) Functional brain mapping and its applications to neurosurgery. Neurosurgery 60: 185–201. - PubMed
    1. Stummer W, Pichlmeier U, Meinel T, Wiestler OD, Zanella F, et al. (2006) Fluorescence-guided surgery with 5-aminolevulinic acid for resection of malignant glioma: a randomised controlled multicentre phase III trial. Lancet Oncol 7: 392–401. - PubMed