. 2013 Sep 5;8(9):e73361.
doi: 10.1371/journal.pone.0073361. eCollection 2013.

Predicting relapsing-remitting dynamics in multiple sclerosis using discrete distribution models: a population approach

Affiliations

Predicting relapsing-remitting dynamics in multiple sclerosis using discrete distribution models: a population approach

Nieves Velez de Mendizabal et al. PLoS One. .

Erratum in

  • PLoS One. 2014;9(1). doi:10.1371/annotation/40be1d29-5c85-40a8-a379-666ffd18afdc

Abstract

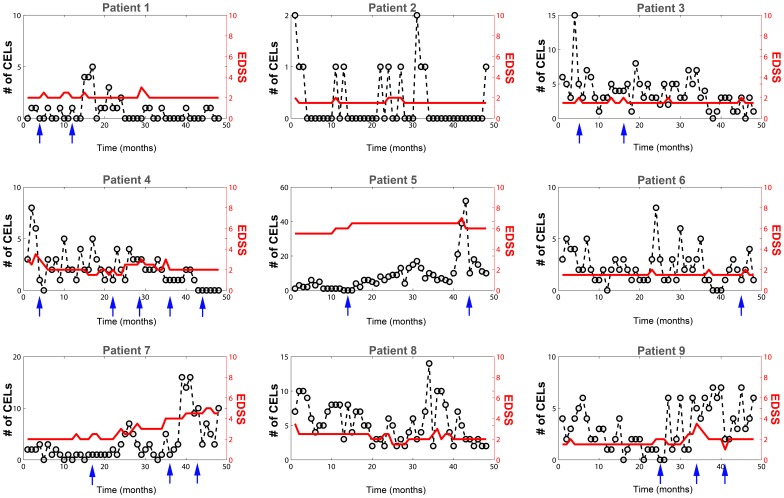
Background: Relapsing-remitting dynamics are a hallmark of autoimmune diseases such as Multiple Sclerosis (MS). A clinical relapse in MS reflects an acute focal inflammatory event in the central nervous system that affects signal conduction by damaging myelinated axons. Those events are evident in T1-weighted post-contrast magnetic resonance imaging (MRI) as contrast enhancing lesions (CEL). CEL dynamics are considered unpredictable and are characterized by high intra- and inter-patient variability. Here, a population approach (nonlinear mixed-effects models) was applied to analyse of CEL progression, aiming to propose a model that adequately captures CEL dynamics.

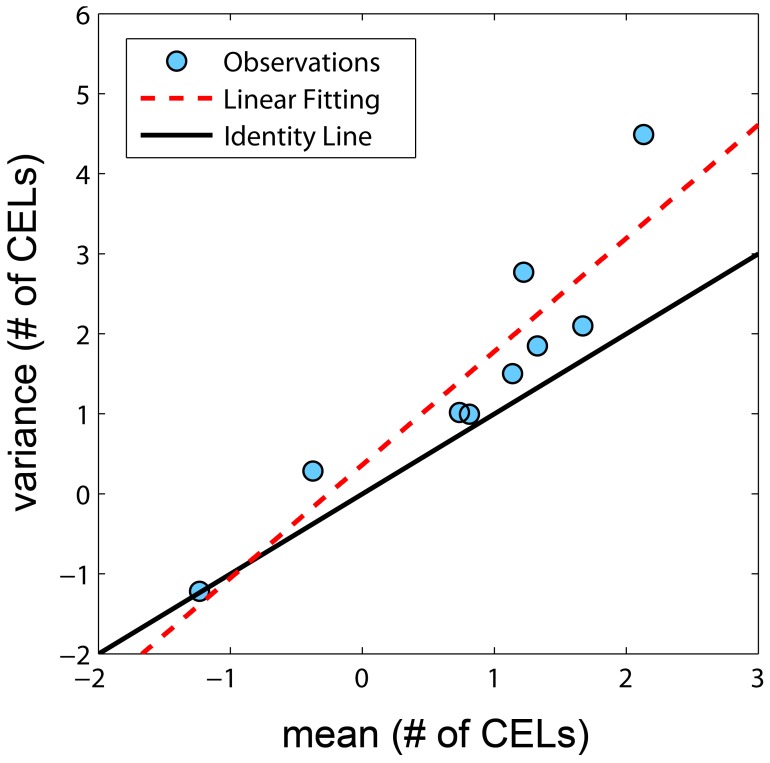
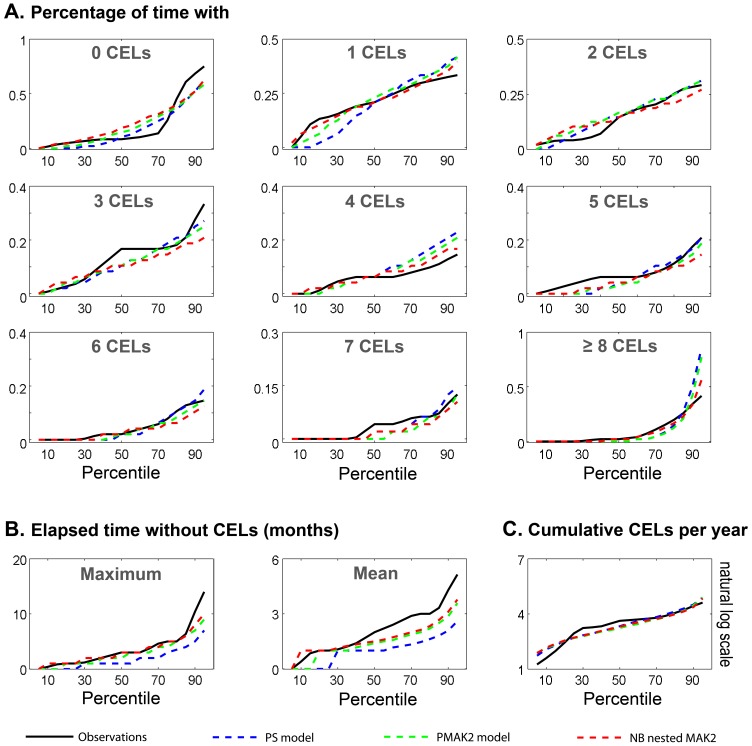
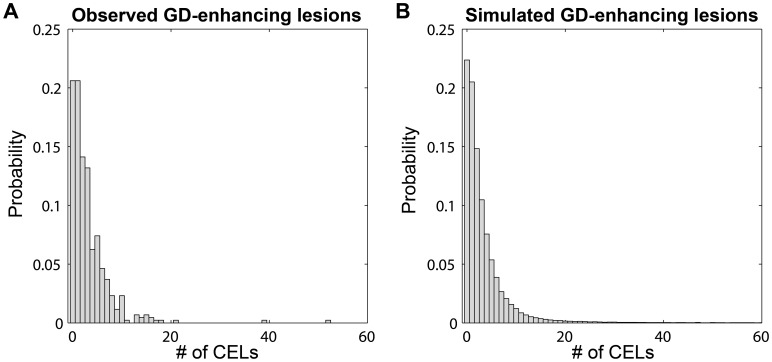
Methods and findings: We explored several discrete distribution models to CEL counts observed in nine MS patients undergoing a monthly MRI for 48 months. All patients were enrolled in the study free of immunosuppressive drugs, except for intravenous methylprednisolone or oral prednisone taper for a clinical relapse. Analyses were performed with the nonlinear mixed-effect modelling software NONMEM 7.2. Although several models were able to adequately characterize the observed CEL dynamics, the negative binomial distribution model had the best predictive ability. Significant improvements in fitting were observed when the CEL counts from previous months were incorporated to predict the current month's CEL count. The predictive capacity of the model was validated using a second cohort of fourteen patients who underwent monthly MRIs during 6-months. This analysis also identified and quantified the effect of steroids for the relapse treatment.

Conclusions: The model was able to characterize the observed relapsing-remitting CEL dynamic and to quantify the inter-patient variability. Moreover, the nature of the effect of steroid treatment suggested that this therapy helps resolve older CELs yet does not affect newly appearing active lesions in that month. This model could be used for design of future longitudinal studies and clinical trials, as well as for the evaluation of new therapies.


Conflict of interest statement

Competing Interests: Nieves Velez de Mendizabal and Robert R. Bies were supported through Eli Lilly and Company through the Indiana Clinical and Translational Sciences Institute (CTSI). Matthew M. Hutmacher is employed by Ann Arbor Pharmacometrics Group (A2PG). There are no patents, products in development or marketed products to declare. This does not alter the authors' adherence to all the PLOS ONE policies on sharing data and materials, as detailed online in the guide for authors.

Figures

Figure 1
Figure 1. Number of contrast-enhancing lesions (CELs).
CEL counts are represented with circles and dashed lines (left Y axis). Some patients were treated with intravenous methylprednisolone at 1 g/day for 3–5 days, or oral prednisone taper for clinical relapses (arrows). Changes in the EDSS are plotted on the right Y axis (red line).
Figure 2
Figure 2. Variance versus mean of number of CELs obtained from the raw data.
Each observation represents one patient and is represented by dots. Solid black line represents the identity line. Dashed red line is the linear data fit.
Figure 3
Figure 3. Visual Numerical Predictive Check (VNPC).
Different dynamic descriptors were calculated for the observed data (black solid line) and the simulated data from the different selected models (dashed lines). Those descriptors were evaluated at different percentiles from 5th to 95th with an increasing step of 5.
Figure 4
Figure 4. Predicted Interval of Visual Numerical Predictive Check.
Different dynamic descriptors were calculated for the observed data (black solid line) and simulated data NB nested MAK2 model. The 95% predicted interval is represented red area. Dashed red represented the simulated median. Those descriptors were evaluated at different percentiles from 10th to 90th with an increasing step of 5.
Figure 5
Figure 5. Probability distribution for CEL.
Observed data (A) versus the probability distribution of simulated data (B) generated by NB nested MAK2 model.
Figure 6
Figure 6. Predicted Interval for variance versus mean of number of CELs.
Variance and mean of number of CELs in each patient (observed – simulated) were calculated and represented in natural logarithmic scale. Solid line in black corresponds to the identity line. Blue dots are the observations. Blue dashed lines correspond to the 5th and 95th quartiles of simulated data and solid blue line corresponds to the median of simulated data. Black solid line is the identity line.
Figure 7
Figure 7. Model validation.
A. Three descriptors were compared: (i) maximum, (ii) median and (iii) mean of the number of CELs during the 6 months. Green dots represented the observed data; dotted lines are the observed median; black dashed lines are the predicted median and grey areas the 95% PI by the model. B. Variance versus mean for a 6 time window. Green dots are observations. Green dashed lines correspond to the 5th and 95th percentiles of simulated data and the solid green line corresponds to the median of simulated data. Black solid line is the identity line.
Figure 8
Figure 8. Analysis of the significance of the steroid effect by randomizing the dose events.
One thousand new data files were generated by randomizing the doses event architecture while preserving the total number of dose events and the patient observations. The histogram shows the distribution of the OF values obtained using the selected model with the steroid effect when drug administrations were randomly generated. The OF value of the selected model with no steroid effect is marked in green. The OF value of the selected model with the covariate steroid effect, using the real dose moments is highlighted in red.

References

    1. Compston A, Coles A (2008) Multiple sclerosis. Lancet 372: 1502–1517. - PubMed
    1. Vollmer T (2007) The natural history of relapses in multiple sclerosis. J Neurol Sci 256 Suppl 1S5–13. - PubMed
    1. Paty DW, McFarland H (1998) Magnetic resonance techniques to monitor the long term evolution of multiple sclerosis pathology and to monitor definitive clinical trials. J Neurol Neurosurg Psychiatry 64 Suppl 1S47–51. - PubMed
    1. Miller DH (2002) MRI monitoring of MS in clinical trials. Clin Neurol Neurosurg 104: 236–243. - PubMed
    1. Bakshi R, Thompson AJ, Rocca MA, Pelletier D, Dousset V, et al. (2008) MRI in multiple sclerosis: current status and future prospects. Lancet Neurol 7: 615–625. - PMC - PubMed

Publication types

MeSH terms

LinkOut - more resources