

Synergistic apoptosis of CML cells by buthionine sulfoximine and hydroxychavicol correlates with activation of AIF and GSH-ROS-JNK-ERK-iNOS pathway
- PMID: 24040019
- PMCID: PMC3767640
- DOI: 10.1371/journal.pone.0073672
Synergistic apoptosis of CML cells by buthionine sulfoximine and hydroxychavicol correlates with activation of AIF and GSH-ROS-JNK-ERK-iNOS pathway
Retraction in
-
Retraction: Synergistic Apoptosis of CML cells by buthionine sulfoximine and hydroxychavicol correlates with activation of AIF and GSH-ROS-JNK-ERK-iNOS pathway.PLoS One. 2025 Feb 24;20(2):e0319529. doi: 10.1371/journal.pone.0319529. eCollection 2025. PLoS One. 2025. PMID: 39992901 Free PMC article. No abstract available.
Abstract
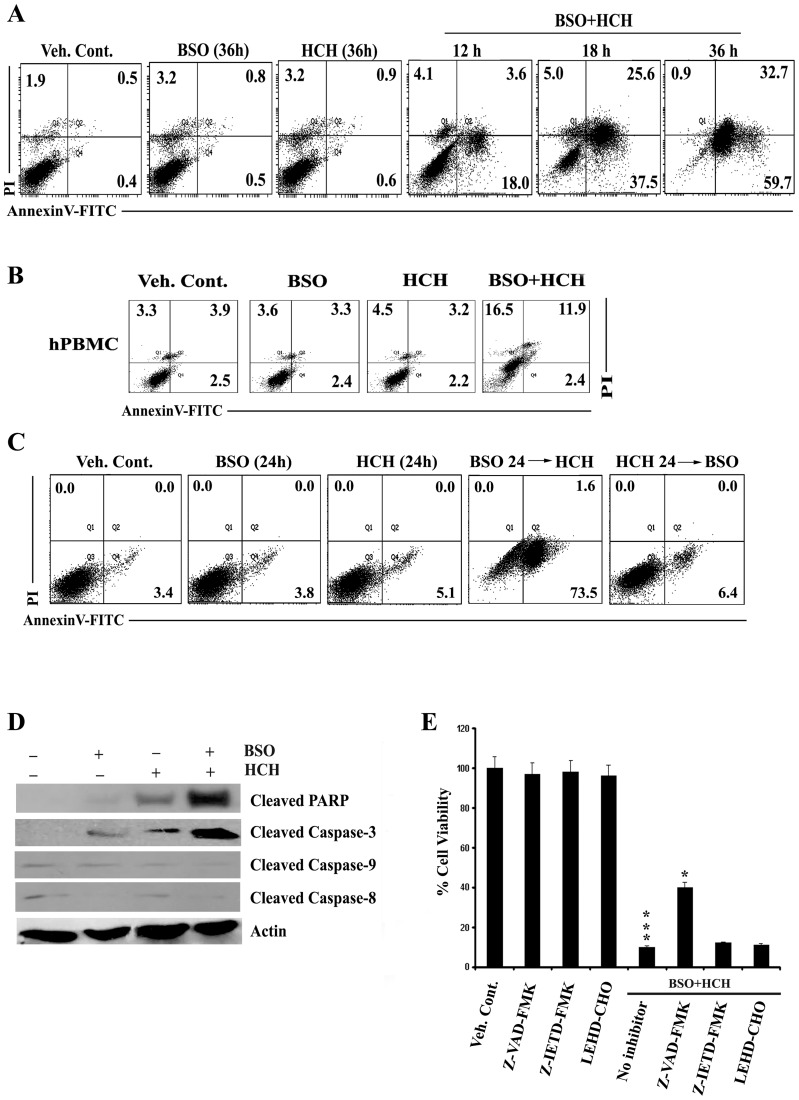
Background: Hydroxychavicol (HCH), a constituent of Piper betle leaf has been reported to exert anti-leukemic activity through induction of reactive oxygen species (ROS). The aim of the study is to optimize the oxidative stress -induced chronic myeloid leukemic (CML) cell death by combining glutathione synthesis inhibitor, buthionine sulfoximine (BSO) with HCH and studying the underlying mechanism.
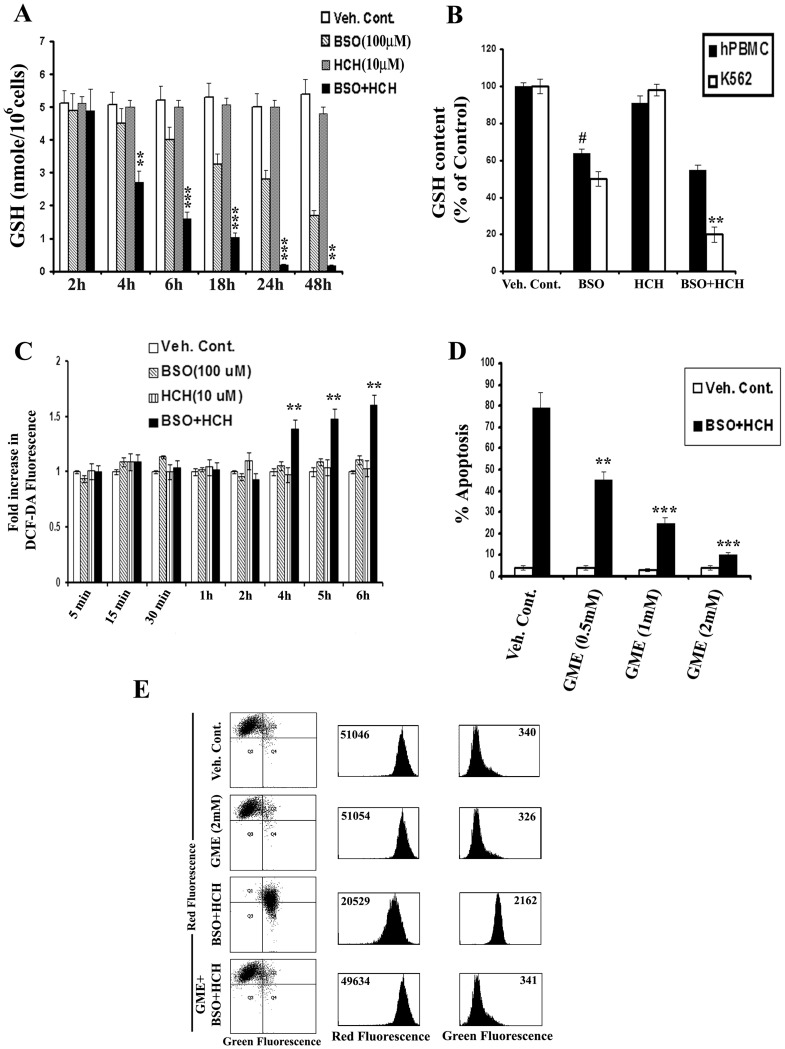
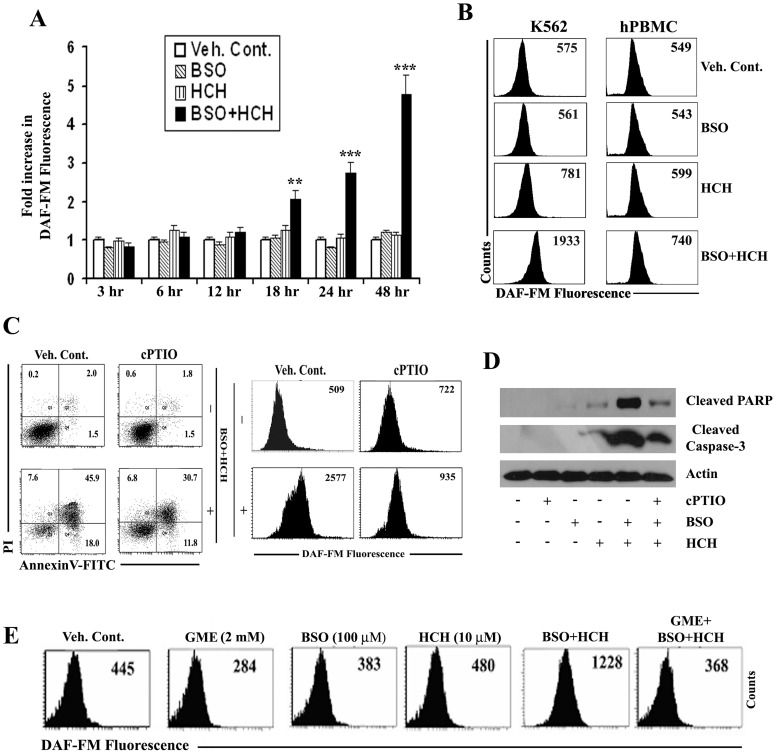
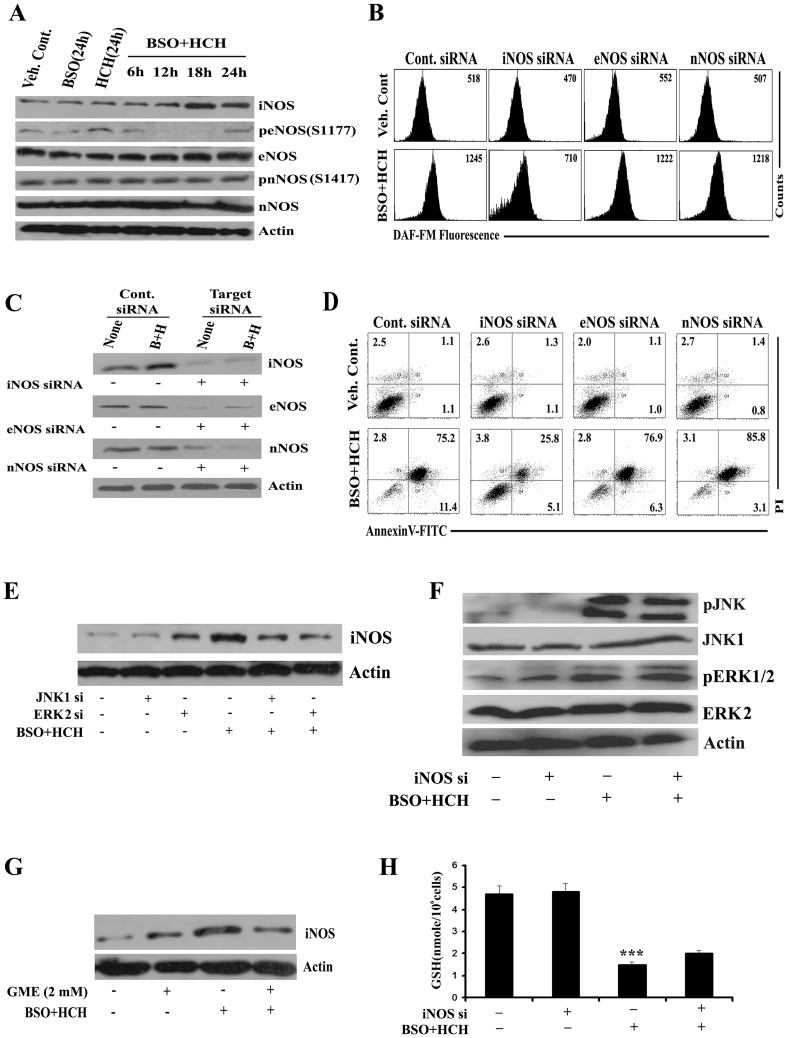
Materials and methods: Anti-proliferative activity of BSO and HCH alone or in combination against a number of leukemic (K562, KCL22, KU812, U937, Molt4), non-leukemic (A549, MIA-PaCa2, PC-3, HepG2) cancer cell lines and normal cell lines (NIH3T3, Vero) was measured by MTT assay. Apoptotic activity in CML cell line K562 was detected by flow cytometry (FCM) after staining with annexin V-FITC/propidium iodide (PI), detection of reduced mitochondrial membrane potential after staining with JC-1, cleavage of caspase- 3 and poly (ADP)-ribose polymerase proteins by western blot analysis and translocation of apoptosis inducing factor (AIF) by confocal microscopy. Intracellular reduced glutathione (GSH) was measured by colorimetric assay using GSH assay kit. 2',7'-dichlorodihydrofluorescein diacetate (DCF-DA) and 4-amino-5-methylamino-2',7'-difluorofluorescein (DAF-FM) were used as probes to measure intracellular increase in ROS and nitric oxide (NO) levels respectively. Multiple techniques like siRNA transfection and pharmacological inhibition were used to understand the mechanisms of action.
Results: Non-apoptotic concentrations of BSO significantly potentiated HCH-induced apoptosis in K562 cells. BSO potentiated apoptosis-inducing activity of HCH in CML cells by caspase-dependent as well as caspase-independent but apoptosis inducing factor (AIF)-dependent manner. Enhanced depletion of intracellular GSH induced by combined treatment correlated with induction of ROS. Activation of ROS- dependent JNK played a crucial role in ERK1/2 activation which subsequently induced the expression of inducible nitric oxide synthase (iNOS). iNOS- mediated production of NO was identified as an effector molecule causing apoptosis of CML cells.
Conclusion/significance: BSO synergizes with HCH in inducing apoptosis of CML cells through the GSH-ROS-JNK-ERK-iNOS pathway.
Conflict of interest statement
Figures


Similar articles
-
Hydroxychavicol, a Piper betle leaf component, induces apoptosis of CML cells through mitochondrial reactive oxygen species-dependent JNK and endothelial nitric oxide synthase activation and overrides imatinib resistance.Cancer Sci. 2012 Jan;103(1):88-99. doi: 10.1111/j.1349-7006.2011.02107.x. Epub 2011 Nov 7. Cancer Sci. 2012. PMID: 21943109 Free PMC article.
-
ICB3E induces iNOS expression by ROS-dependent JNK and ERK activation for apoptosis of leukemic cells.Apoptosis. 2012 Jun;17(6):612-26. doi: 10.1007/s10495-011-0695-9. Apoptosis. 2012. Retraction in: Apoptosis. 2024 Oct;29(9-10):1290. doi: 10.1007/s10495-024-02007-7. PMID: 22252531 Retracted.
-
The variable chemotherapeutic response of Malabaricone-A in leukemic and solid tumor cell lines depends on the degree of redox imbalance.Phytomedicine. 2015 Jul 15;22(7-8):713-23. doi: 10.1016/j.phymed.2015.05.007. Epub 2015 May 29. Phytomedicine. 2015. PMID: 26141757
-
Acetylshikonin induces apoptosis of human leukemia cell line K562 by inducing S phase cell cycle arrest, modulating ROS accumulation, depleting Bcr-Abl and blocking NF-κB signaling.Biomed Pharmacother. 2020 Feb;122:109677. doi: 10.1016/j.biopha.2019.109677. Epub 2019 Dec 3. Biomed Pharmacother. 2020. PMID: 31810012
-
Measurement of Oxidative Stress Markers In Vitro Using Commercially Available Kits.2020 Aug 9. In: Berliner LJ, Parinandi NL, editors. Measuring Oxidants and Oxidative Stress in Biological Systems [Internet]. Cham (CH): Springer; 2020. Chapter 4. 2020 Aug 9. In: Berliner LJ, Parinandi NL, editors. Measuring Oxidants and Oxidative Stress in Biological Systems [Internet]. Cham (CH): Springer; 2020. Chapter 4. PMID: 33411446 Free Books & Documents. Review.
Cited by
-
Intracellular glutathione depletion by oridonin leads to apoptosis in hepatic stellate cells.Molecules. 2014 Mar 18;19(3):3327-44. doi: 10.3390/molecules19033327. Molecules. 2014. PMID: 24647034 Free PMC article.
-
More than Just an Immunosuppressant: The Emerging Role of FTY720 as a Novel Inducer of ROS and Apoptosis.Oxid Med Cell Longev. 2018 Mar 28;2018:4397159. doi: 10.1155/2018/4397159. eCollection 2018. Oxid Med Cell Longev. 2018. PMID: 29785244 Free PMC article. Review.
-
Targeting the Ataxia Telangiectasia Mutated-null phenotype in chronic lymphocytic leukemia with pro-oxidants.Haematologica. 2015 Aug;100(8):1076-85. doi: 10.3324/haematol.2014.115170. Epub 2015 Apr 3. Haematologica. 2015. PMID: 25840602 Free PMC article.
-
Protective efficacy of vitamins C and E on p,p'-DDT-induced cytotoxicity via the ROS-mediated mitochondrial pathway and NF-κB/FasL pathway.PLoS One. 2014 Dec 2;9(12):e113257. doi: 10.1371/journal.pone.0113257. eCollection 2014. PLoS One. 2014. PMID: 25464339 Free PMC article.
-
Nitric Oxide Trickle Drives Heme into Hemoglobin and Muscle Myoglobin.Cells. 2022 Sep 12;11(18):2838. doi: 10.3390/cells11182838. Cells. 2022. PMID: 36139413 Free PMC article.
References
-
- Xu K, Thornalley PJ (2001) Involvement of glutathione metabolism in the cytotoxicity of the phenethyl isothiocyanate and its cysteine conjugate to human leukaemia cells in vitro. Biochem Pharmacol 61: 165–177. - PubMed
-
- Singh SV, Srivastava SK, Choi S, Lew KL, Antosiewicz J, et al. (2005) Sulforaphane-induced cell death in human prostate cancer cells is initiated by reactive oxygen species. J Biol Chem 280: 19911–19924. - PubMed
-
- Griffith OW, Meister A (1979) Potent and specific inhibition of glutathione synthesis by buthionine sulfoximine (S-n-butyl homocysteine sulfoximine). J Biol Chem 254: 7558–7560. - PubMed
-
- Vanhoefer U, Yin MB, Harstrick A, Seeber S, Rustum YM (1997) Carbamoylation of glutathione reductase by N,N-bis(2-chloroethyl)-N- nitrosourea associated with inhibition of multidrug resistance protein (MRP) function. Biochem Pharmacol 53: 801–809. - PubMed
-
- Schnelldorfer T, Gansauge S, Gansauge F, Schlosser S, Beger HG, et al. (2000) Glutathione depletion causes cell growth inhibition and enhanced apoptosis in pancreatic cancer cells. Cancer 89: 1440–1447. - PubMed
Publication types
MeSH terms
Substances
LinkOut - more resources
Full Text Sources
Other Literature Sources
Research Materials
Miscellaneous
