Urban economies and occupation space: can they get "there" from "here"?
- PMID: 24040021
- PMCID: PMC3767603
- DOI: 10.1371/journal.pone.0073676
Urban economies and occupation space: can they get "there" from "here"?
Abstract
Much of the socioeconomic life in the United States occurs in its urban areas. While an urban economy is defined to a large extent by its network of occupational specializations, an examination of this important network is absent from the considerable body of work on the determinants of urban economic performance. Here we develop a structure-based analysis addressing how the network of interdependencies among occupational specializations affects the ease with which urban economies can transform themselves. While most occupational specializations exhibit positive relationships between one another, many exhibit negative ones, and the balance between the two partially explains the productivity of an urban economy. The current set of occupational specializations of an urban economy and its location in the occupation space constrain its future development paths. Important tradeoffs exist between different alternatives for altering an occupational specialization pattern, both at a single occupation and an entire occupational portfolio levels.
Conflict of interest statement
Figures

 ; (B)
; (B)  matrix between all 787 occupations; and (C) the
  -based occupation space. Some very large values of
  exist, typically resulting between uncommon occupations that are over-represented in the same MSAs; these are not shown in (A) and (B). In (C), each node represents an occupation code, the node color corresponds to one of the 22 2-digit occupation groups (as defined by BLS), and the node size depends on how many MSAs specialize in that occupation (i.e.,
  ). Large distances between occupations correspond to low or negative
  , whereas short distances high positive
  (see Methods). Only links corresponding to the highest (positive) 1% of
  are included for figure's legibility.
 s are then calculated, essentially treating the class as if it is one ``super MSA.” Note that these spaces are the same as in Fig. 1C but with links removed to avoid cluttered figures.
 relationship; and (C) fraction of negative
  –GDP per capita relationship. The total number of employee is used as a proxy of the MSA size. Based on the correlation coefficients reported in the three panels, the partial correlation coefficient between fraction of negative
  and GDP per capita with the MSA size held constant is
  .
.
 .
.
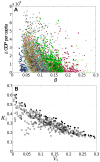
 to that of another MSA and the corresponding difference/improvement in per capita GDP; and (B) relationship between the potential of the first transition and the potential of subsequent transformation (see text). In (A), 50 MSAs are randomly selected whose
  s are used as starting points; different colors specify different starting MSAs. In (B), the solid circles represent Pareto-efficient transitions.
References
-
- Fujiwara Y, Aoyama H (2010) Large-scale structure of a nation-wide production network. The European Physical Journal B 77: 565–580.
-
- Bloch F, Theis F, Vega-Redondo F, Fisher E (2011) Vertex centralities in input-output networks reveal the structure of modern economies. Phys Rev E 83: 1–8. - PubMed
-
- Acemoglu D, Carvalho VM, Ozdaglar A, Tahbaz-Salehi A (2012) The network origins of aggregate fluctuations. Econometrica 80: 1977–2016.
-
- Rosenberg N (1983) Inside the Black Box: Technology and Economics. New York: Cambridge University Press.
MeSH terms
LinkOut - more resources
Full Text Sources
Other Literature Sources

