

Circadian regulation of the Na+/K+-ATPase alpha subunit in the visual system is mediated by the pacemaker and by retina photoreceptors in Drosophila melanogaster
- PMID: 24040028
- PMCID: PMC3769360
- DOI: 10.1371/journal.pone.0073690
Circadian regulation of the Na+/K+-ATPase alpha subunit in the visual system is mediated by the pacemaker and by retina photoreceptors in Drosophila melanogaster
Abstract
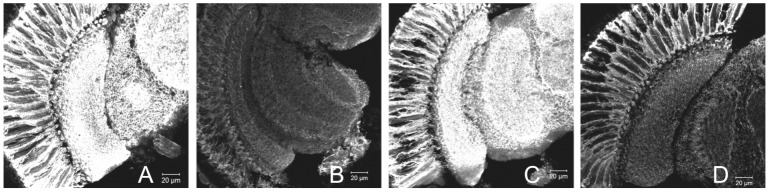
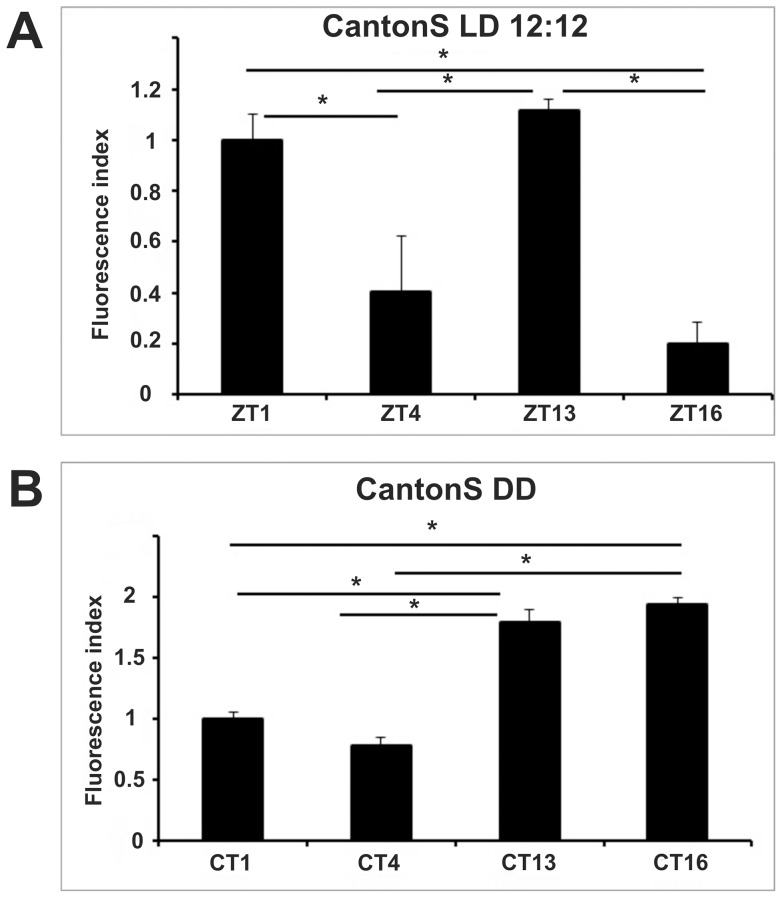
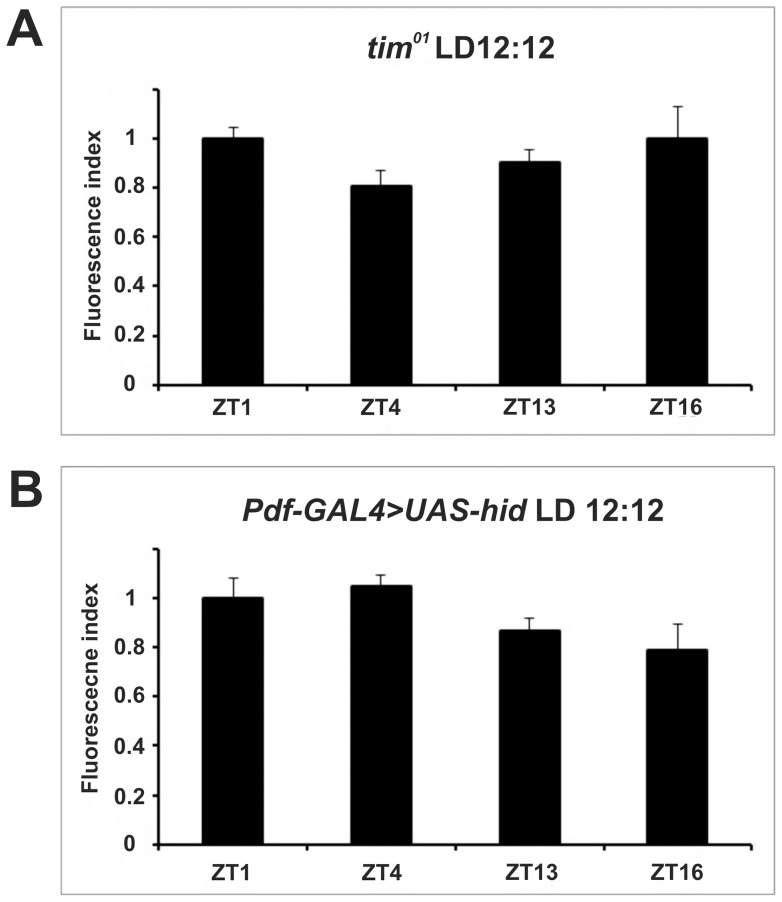
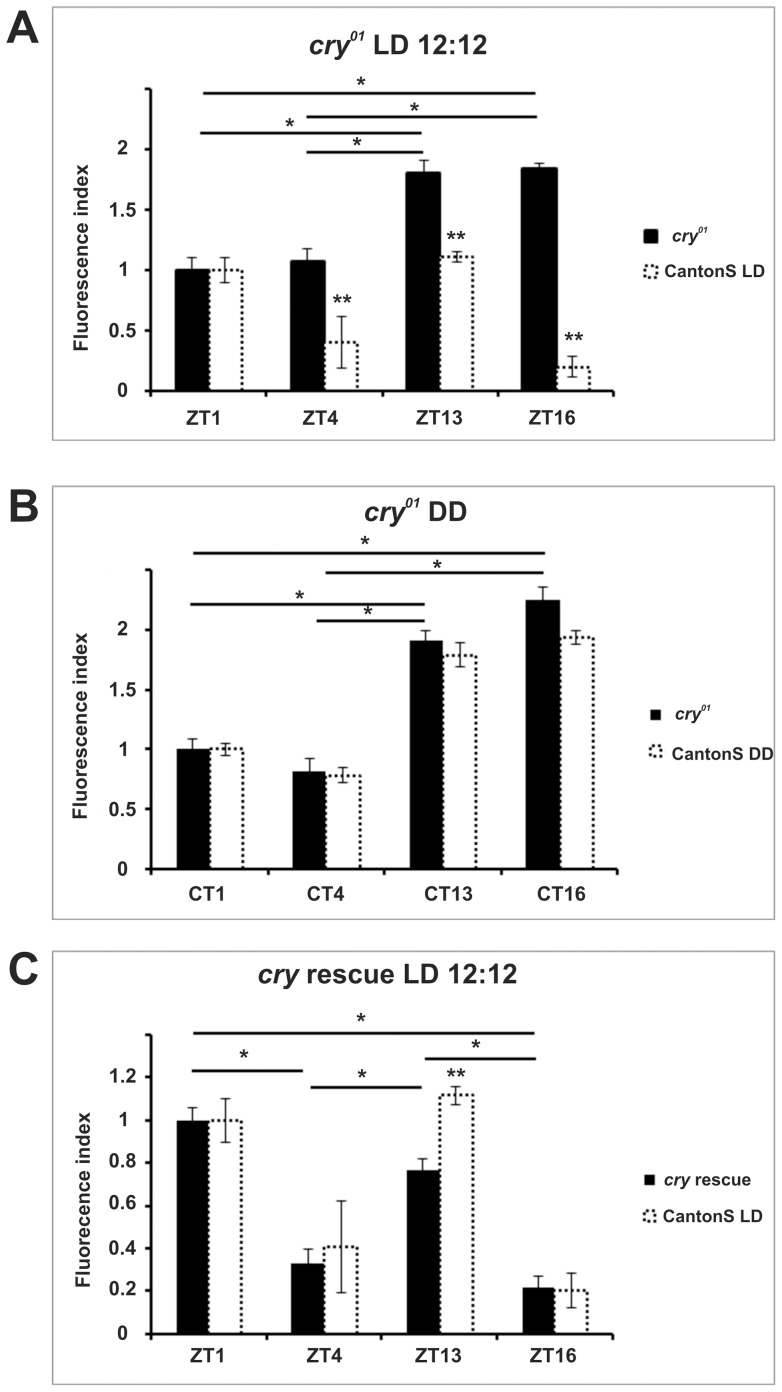
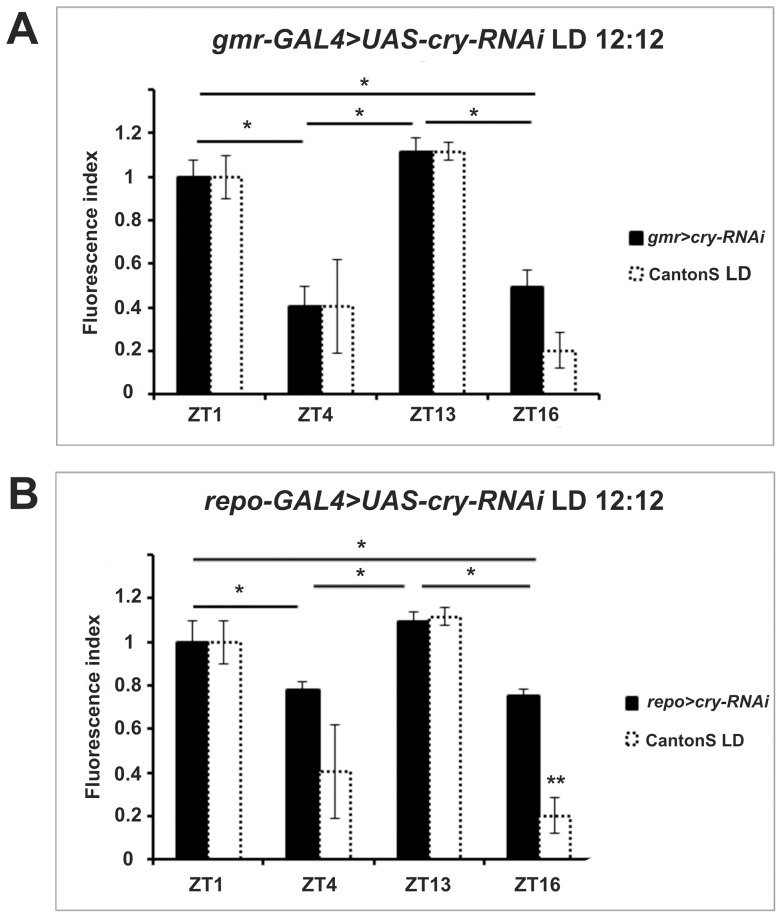
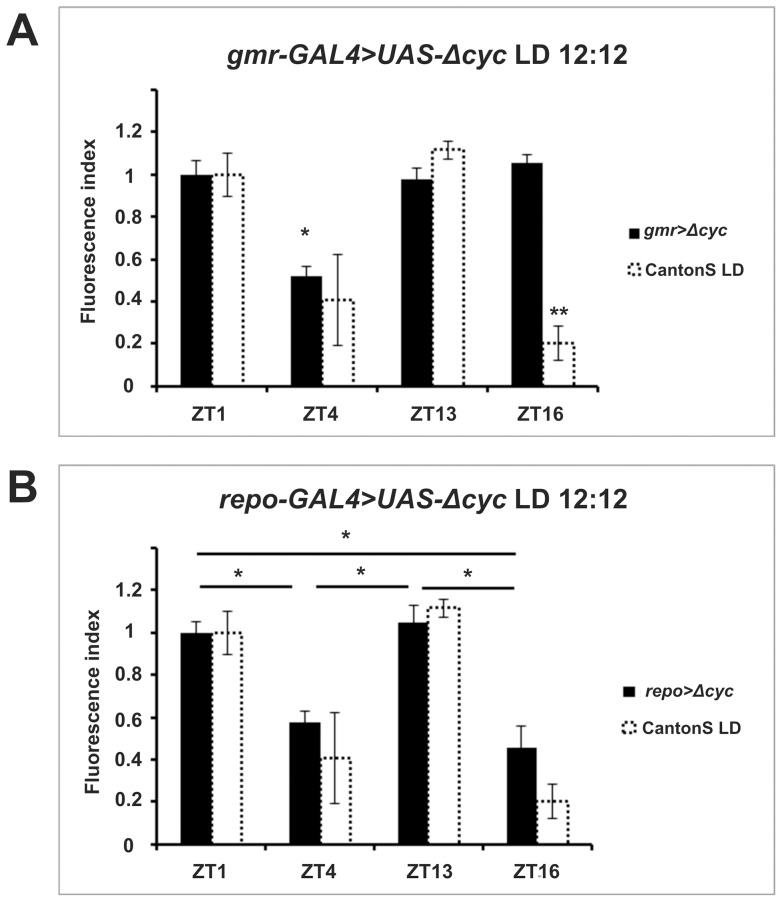
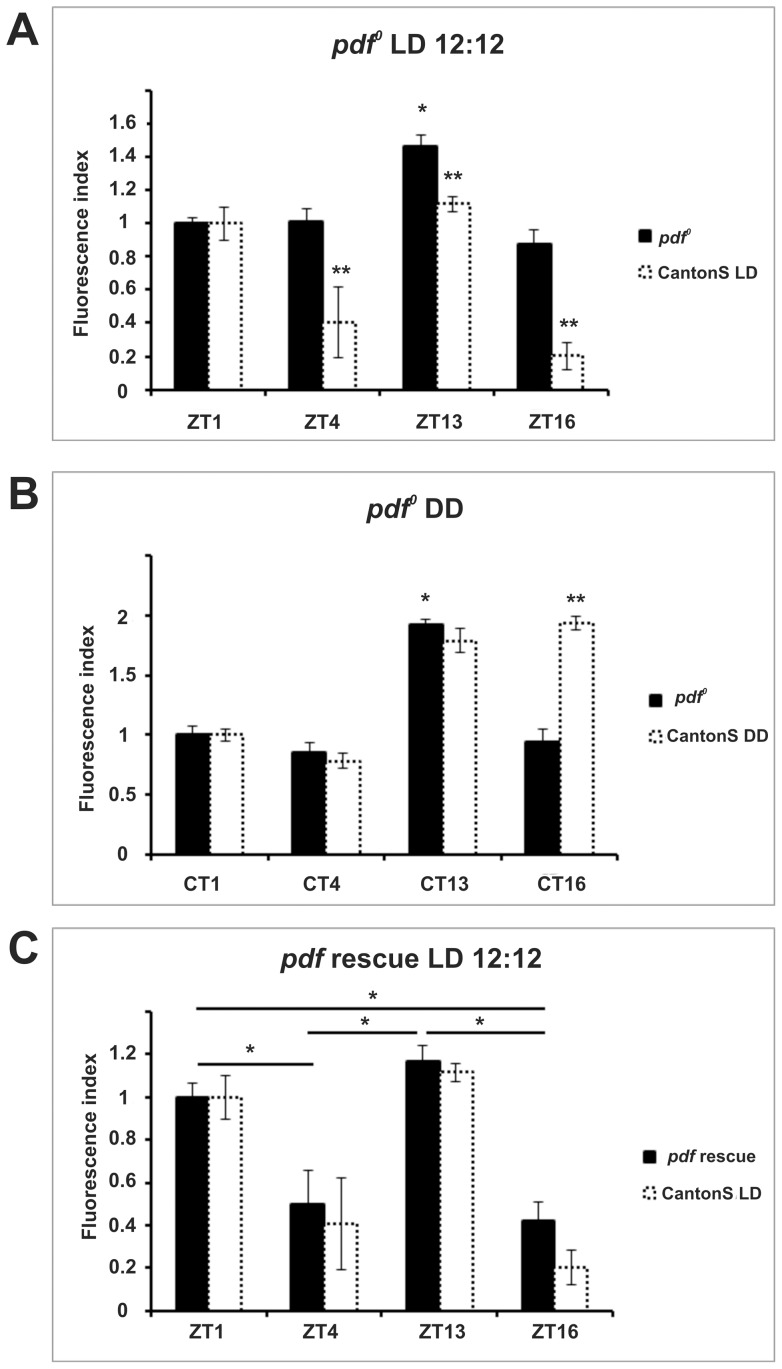
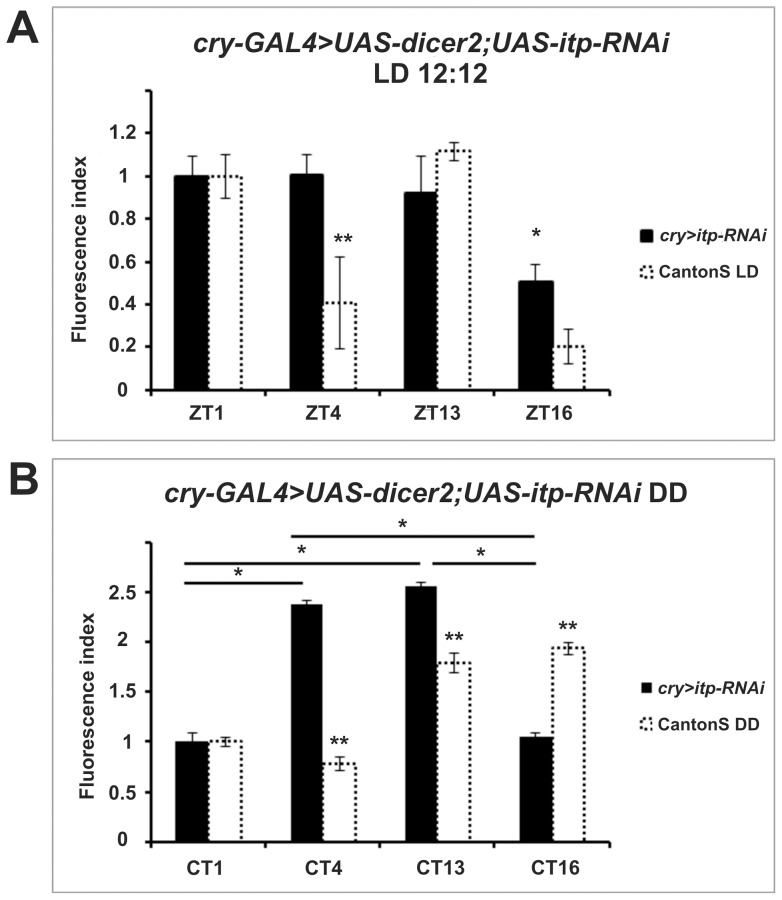
We investigated the diurnal oscillation in abundance of the catalytic α subunit of the sodium/potassium pump (ATPα) in the brain of Drosophila melanogaster. This rhythm is bimodal and is particularly robust in the glia cells of the lamina, the first optic neuropil. We observed loss of ATPα cycling in lamina glia in behaviourally arrhythmic per(01) and tim(01) mutants and in flies overexpressing the pro-apoptotic gene hid in the PDF-positive clock neurons. Moreover, the rhythm of ATPα abundance was altered in cry(01) and Pdf(0) mutants, in flies with a weakened clock mechanism in retina photoreceptor cells and in those subject to downregulation of the neuropeptide ITP by RNAi. This complex, rhythmic regulation of the α subunit suggests that the sodium/potassium pump may be a key target of the circadian pacemaker to impose daily control on brain activities, such as rhythmic changes in neuronal plasticity, which are best observed in the visual system.
Conflict of interest statement
Figures
Similar articles
-
A one-day journey to the suburbs: circadian clock in the Drosophila visual system.FEBS J. 2025 Feb;292(4):727-739. doi: 10.1111/febs.17317. Epub 2024 Nov 1. FEBS J. 2025. PMID: 39484992 Free PMC article. Review.
-
Cyclical expression of Na+/K+-ATPase in the visual system of Drosophila melanogaster.J Insect Physiol. 2009 May;55(5):459-68. doi: 10.1016/j.jinsphys.2009.02.003. Epub 2009 Mar 10. J Insect Physiol. 2009. PMID: 19428365 Free PMC article.
-
Loss of Na(+)/K(+)-ATPase in Drosophila photoreceptors leads to blindness and age-dependent neurodegeneration.Exp Neurol. 2014 Nov;261:791-801. doi: 10.1016/j.expneurol.2014.08.025. Epub 2014 Sep 7. Exp Neurol. 2014. PMID: 25205229 Free PMC article.
-
Circadian expression of the presynaptic active zone protein Bruchpilot in the lamina of Drosophila melanogaster.Dev Neurobiol. 2013 Jan;73(1):14-26. doi: 10.1002/dneu.22032. Epub 2012 Jul 20. Dev Neurobiol. 2013. PMID: 22589214
-
Circadian Rhythms and Sleep in Drosophila melanogaster.Genetics. 2017 Apr;205(4):1373-1397. doi: 10.1534/genetics.115.185157. Genetics. 2017. PMID: 28360128 Free PMC article. Review.
Cited by
-
Dietary restriction and the transcription factor clock delay eye aging to extend lifespan in Drosophila Melanogaster.Nat Commun. 2022 Jun 7;13(1):3156. doi: 10.1038/s41467-022-30975-4. Nat Commun. 2022. PMID: 35672419 Free PMC article.
-
External and circadian inputs modulate synaptic protein expression in the visual system of Drosophila melanogaster.Front Physiol. 2014 Apr 3;5:102. doi: 10.3389/fphys.2014.00102. eCollection 2014. Front Physiol. 2014. PMID: 24772085 Free PMC article.
-
A one-day journey to the suburbs: circadian clock in the Drosophila visual system.FEBS J. 2025 Feb;292(4):727-739. doi: 10.1111/febs.17317. Epub 2024 Nov 1. FEBS J. 2025. PMID: 39484992 Free PMC article. Review.
-
A Circadian Clock in the Blood-Brain Barrier Regulates Xenobiotic Efflux.Cell. 2018 Mar 22;173(1):130-139.e10. doi: 10.1016/j.cell.2018.02.017. Epub 2018 Mar 8. Cell. 2018. PMID: 29526461 Free PMC article.
-
miR-277 regulates the phase of circadian activity-rest rhythm in Drosophila melanogaster.Front Physiol. 2023 Nov 28;14:1082866. doi: 10.3389/fphys.2023.1082866. eCollection 2023. Front Physiol. 2023. PMID: 38089472 Free PMC article.
References
-
- Glossop N, Hardin P (2002) Central and peripheral circadian oscillator mechanisms in flies and mammals. J Cell Sci 115: 3369–3377. - PubMed
-
- Emery P, So WV, Kaneko M, Hall JC, Rosbash M (1998) CRY, a Drosophila clock and light-regulated cryptochrome, is a major contributor to circadian rhythm resetting and photosensitivity. Cell 95: 669–679. - PubMed
-
- Stanewsky R, Kaneko M, Emery P, Beretta B, Wager-Smith K, et al. (1998) The cryb mutation identifies cryptochrome as a circadian photoreceptor in Drosophila . Cell 95: 681–692. - PubMed
-
- Renn SC, Park JH, Rosbash M, Hall JC, Taghert PH (1999) A pdf neuropeptide gene mutation and ablation of PDF neurons each cause severe abnormalities of behavioral circadian rhythms in Drosophila . Cell 99: 791–802. - PubMed
Publication types
MeSH terms
Substances
Grants and funding
LinkOut - more resources
Full Text Sources
Other Literature Sources
Molecular Biology Databases
