

Calcium sensing receptor expression in ovine amniotic fluid mesenchymal stem cells and the potential role of R-568 during osteogenic differentiation
- PMID: 24040082
- PMCID: PMC3767786
- DOI: 10.1371/journal.pone.0073816
Calcium sensing receptor expression in ovine amniotic fluid mesenchymal stem cells and the potential role of R-568 during osteogenic differentiation
Abstract
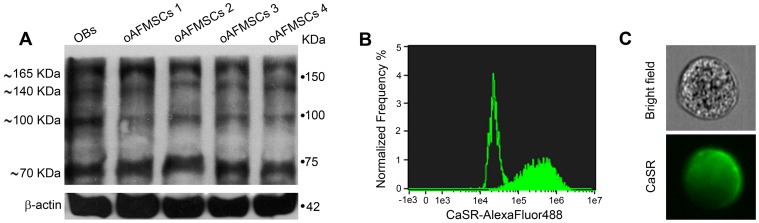
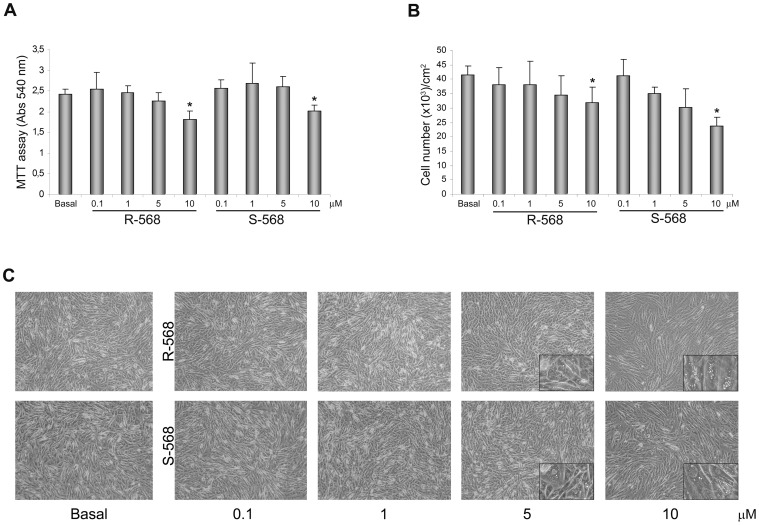
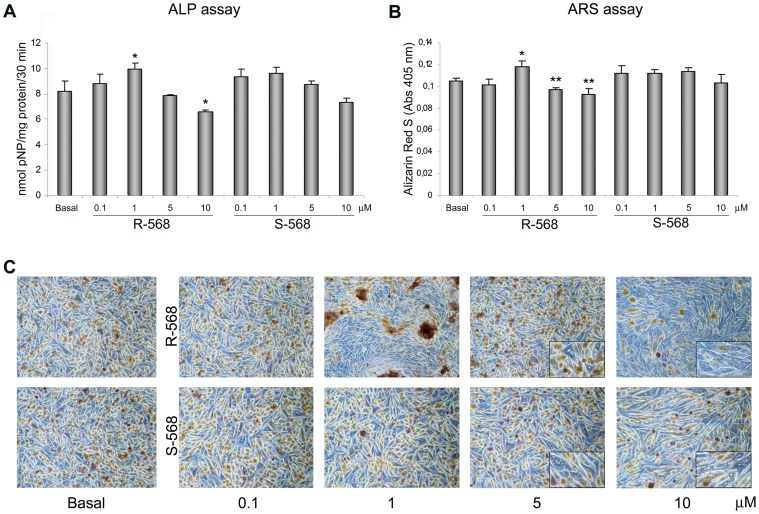
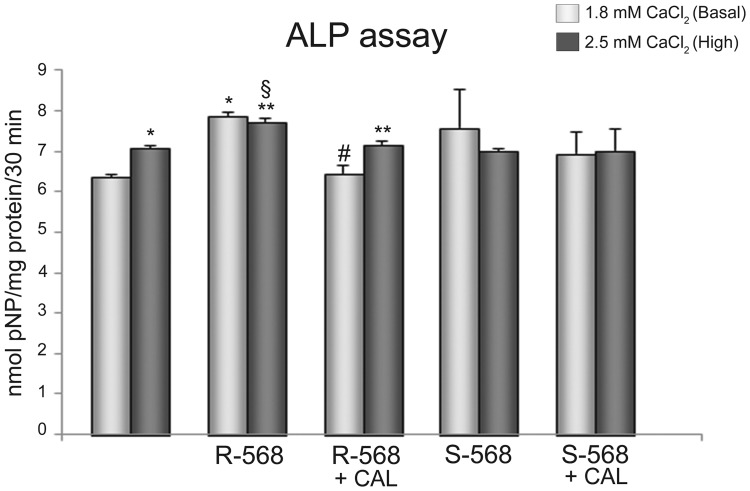
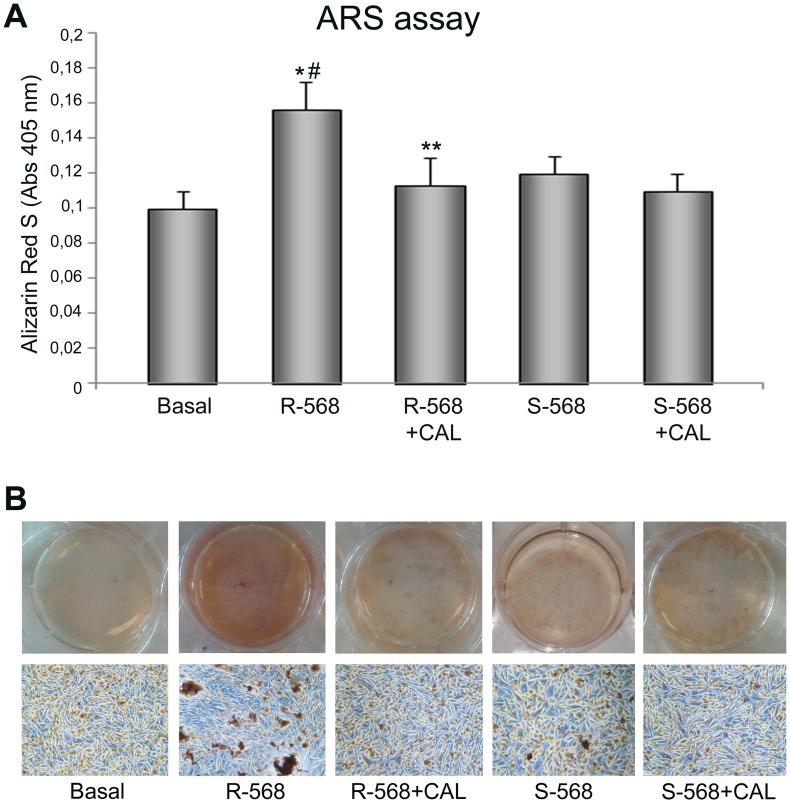
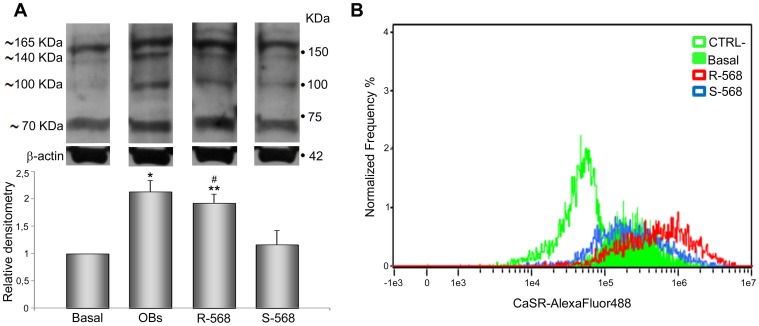
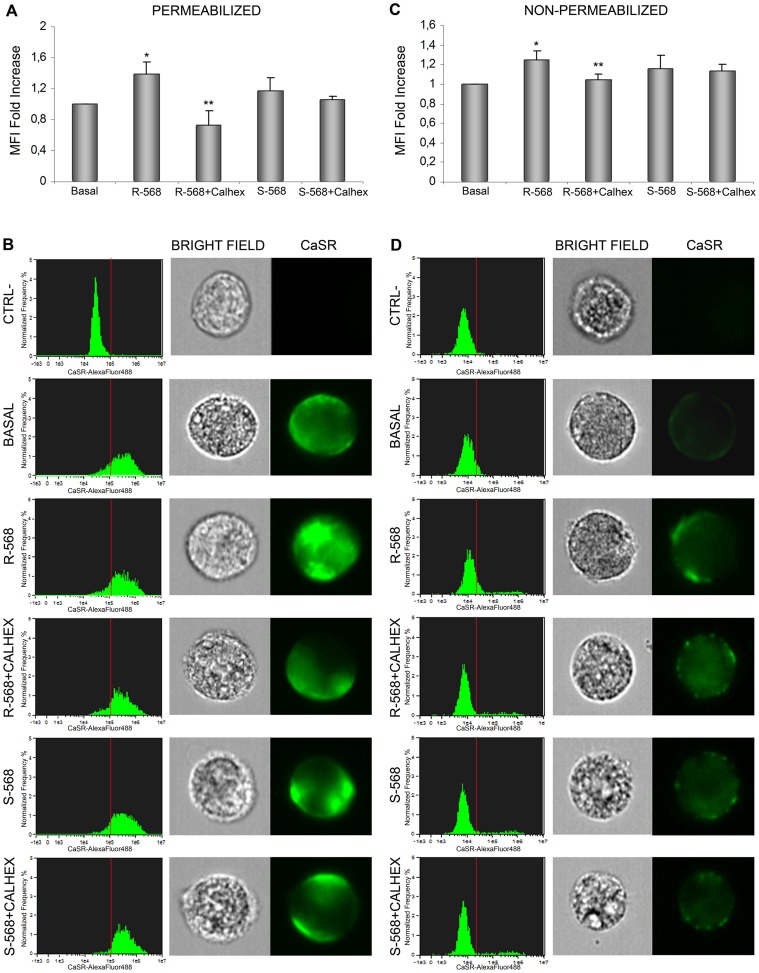
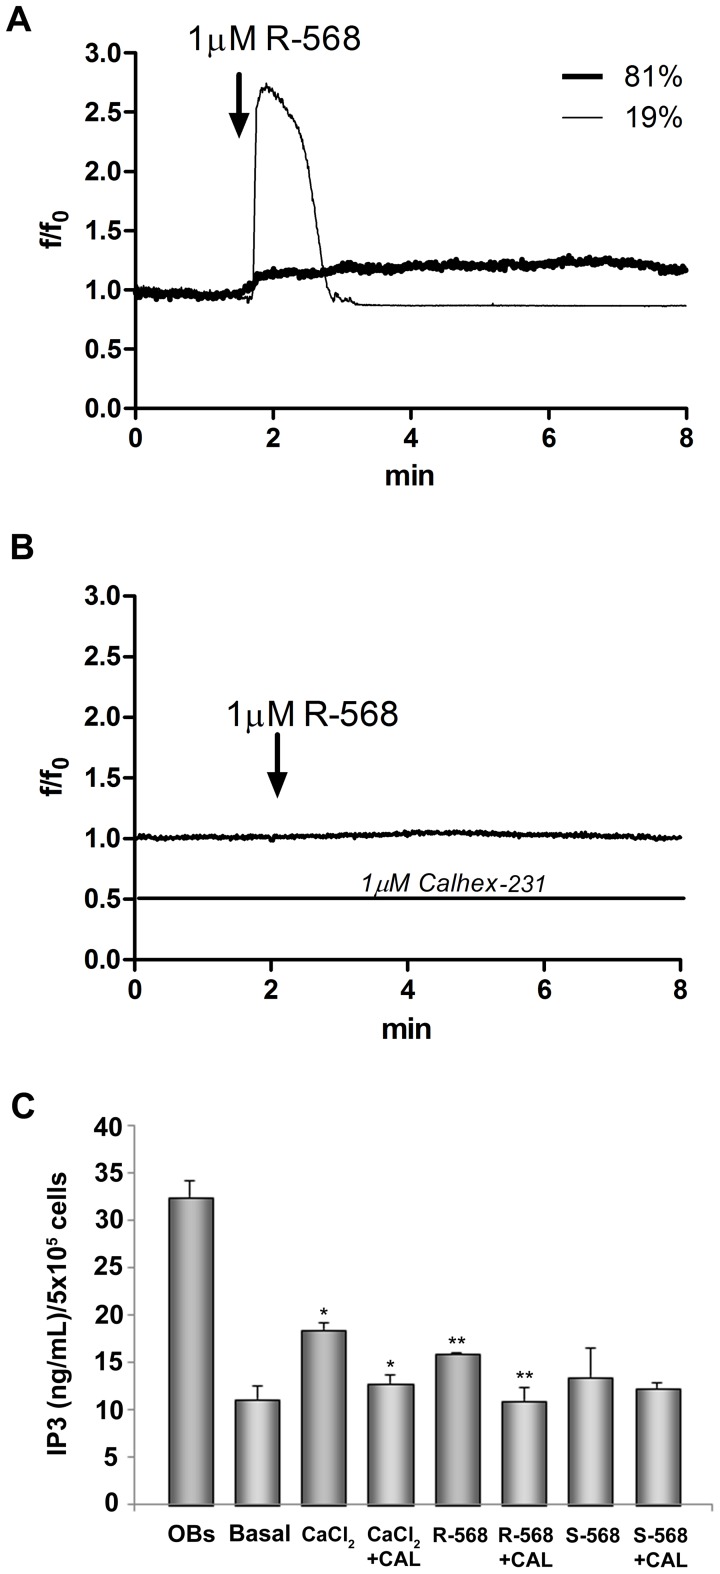
Amniotic fluid-derived stem (AFS) cells have been identified as a promising source for cell therapy applications in bone traumatic and degenerative damage. Calcium Sensing Receptor (CaSR), a G protein-coupled receptor able to bind calcium ions, plays a physiological role in regulating bone metabolism. It is expressed in different kinds of cells, as well as in some stem cells. The bone CaSR could potentially be targeted by allosteric modulators, in particular by agonists such as calcimimetic R-568, which may potentially be helpful for the treatment of bone disease. The aim of our study was first to investigate the presence of CaSR in ovine Amniotic Fluid Mesenchymal Stem Cells (oAFMSCs) and then the potential role of calcimimetics in in vitro osteogenesis. oAFMSCs were isolated, characterized and analyzed to examine the possible presence of CaSR by western blotting and flow cytometry analysis. Once we had demonstrated CaSR expression, we worked out that 1 µM R-568 was the optimal and effective concentration by cell viability test (MTT), cell number, Alkaline Phosphatase (ALP) and Alizarin Red S (ARS) assays. Interestingly, we observed that basal diffuse CaSR expression in oAFMSCs increased at the membrane when cells were treated with R-568 (1 µM), potentially resulting in activation of the receptor. This was associated with significantly increased cell mineralization (ALP and ARS staining) and augmented intracellular calcium and Inositol trisphosphate (IP3) levels, thus demonstrating a potential role for calcimimetics during osteogenic differentiation. Calhex-231, a CaSR allosteric inhibitor, totally reversed R-568 induced mineralization. Taken together, our results demonstrate for the first time that CaSR is expressed in oAFMSCs and that calcimimetic R-568, possibly through CaSR activation, can significantly improve the osteogenic process. Hence, our study may provide useful information on the mechanisms regulating osteogenesis in oAFMSCs, perhaps prompting the use of calcimimetics in bone regenerative medicine.
Conflict of interest statement
Figures
Similar articles
-
Calcium sensing receptor activation by calcimimetic R-568 in human amniotic fluid mesenchymal stem cells: correlation with osteogenic differentiation.Stem Cells Dev. 2014 Dec 15;23(24):2959-71. doi: 10.1089/scd.2013.0627. Stem Cells Dev. 2014. PMID: 25036254
-
Calcimimetics increase CaSR expression and reduce mineralization in vascular smooth muscle cells: mechanisms of action.Cardiovasc Res. 2014 Feb 1;101(2):256-65. doi: 10.1093/cvr/cvt249. Epub 2013 Nov 11. Cardiovasc Res. 2014. PMID: 24217682
-
Calcimimetic R-568 and its enantiomer S-568 increase nitric oxide release in human endothelial cells.PLoS One. 2012;7(1):e30682. doi: 10.1371/journal.pone.0030682. Epub 2012 Jan 25. PLoS One. 2012. PMID: 22295103 Free PMC article.
-
Calcimimetics and hyperparathyroidism.Curr Opin Investig Drugs. 2004 Oct;5(10):1080-5. Curr Opin Investig Drugs. 2004. PMID: 15535429 Review.
-
Calcium sensing receptor activators: calcimimetics.Curr Med Chem. 2007;14(28):3027-34. doi: 10.2174/092986707782794096. Curr Med Chem. 2007. PMID: 18220738 Review.
Cited by
-
Extracellular Calcium Modulates Chondrogenic and Osteogenic Differentiation of Human Adipose-Derived Stem Cells: A Novel Approach for Osteochondral Tissue Engineering Using a Single Stem Cell Source.Tissue Eng Part A. 2015 Sep;21(17-18):2323-33. doi: 10.1089/ten.TEA.2014.0572. Epub 2015 Jul 13. Tissue Eng Part A. 2015. PMID: 26035347 Free PMC article.
-
Diameters and Fluorescence Calibration for Extracellular Vesicle Analyses by Flow Cytometry.Int J Mol Sci. 2020 Oct 23;21(21):7885. doi: 10.3390/ijms21217885. Int J Mol Sci. 2020. PMID: 33114229 Free PMC article.
-
Osteogenic differentiation of amniotic fluid mesenchymal stromal cells and their bone regeneration potential.World J Stem Cells. 2015 May 26;7(4):681-90. doi: 10.4252/wjsc.v7.i4.681. World J Stem Cells. 2015. PMID: 26029340 Free PMC article. Review.
-
Calcium-sensing receptor-mediated osteogenic and early-stage neurogenic differentiation in umbilical cord matrix mesenchymal stem cells from a large animal model.PLoS One. 2014 Nov 7;9(11):e111533. doi: 10.1371/journal.pone.0111533. eCollection 2014. PLoS One. 2014. PMID: 25379789 Free PMC article.
-
Biological characterization and pluripotent identification of ovine amniotic fluid stem cells.Cytotechnology. 2018 Jun;70(3):1009-1021. doi: 10.1007/s10616-017-0115-2. Epub 2018 Mar 3. Cytotechnology. 2018. PMID: 29502286 Free PMC article.
References
-
- De Coppi P, Bartsch G, Siddiqui MM, Xu T, Santos CC, et al. (2007) Isolation of amniotic stem cell lines with potential for therapy. Nature biotechnology 25: 100–106. - PubMed
-
- D’Alimonte I, Lannutti A, Pipino C, Di Tomo P, Pierdomenico L, et al.. (2013) Wnt Signaling Behaves as a “Master Regulator” in the Osteogenic and Adipogenic Commitment of Human Amniotic Fluid Mesenchymal Stem Cells. Stem cell reviews. Available: http://www.ncbi.nlm.nih.gov/pubmed/23605563. doi 10.1007/s12015-013-9436-5. - DOI - PMC - PubMed
-
- Piccoli M, Franzin C, Bertin E, Urbani L, Blaauw B, et al. (2012) Amniotic Fluid Stem Cells Restore the Muscle Cell Niche in a HSA-Cre, SmnF7/F7 Mouse Model. Stem Cells 30: 1675–1684. - PubMed
-
- Sedrakyan S, Angelow S, De Filippo R, Perin L (2012) Stem cells as a therapeutic approach to chronic kidney diseases. Curr Urol Rep 13: 47–54. - PubMed
-
- Bollini S, Cheung K, Riegler J, Dong X, Smart N, et al. (2011) Amniotic fluid stem cells are cardioprotective following acute myocardial infarction. Stem Cells Dev 20: 1985–1994. - PubMed
Publication types
MeSH terms
Substances
LinkOut - more resources
Full Text Sources
Other Literature Sources
