. 2013 Sep 6;8(9):e73817.
doi: 10.1371/journal.pone.0073817. eCollection 2013.

Wild type p53 transcriptionally represses the SALL2 transcription factor under genotoxic stress

Affiliations

Wild type p53 transcriptionally represses the SALL2 transcription factor under genotoxic stress

Carlos Farkas et al. PLoS One. .

Erratum in

  • PLoS One.2014;9(8):e104307. doi: 10.1371/journal.pone.0104307

Abstract

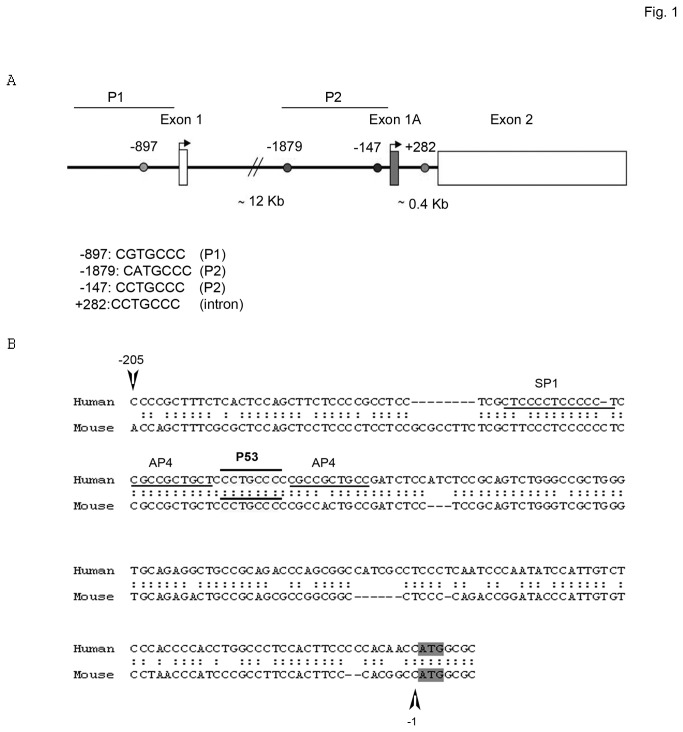
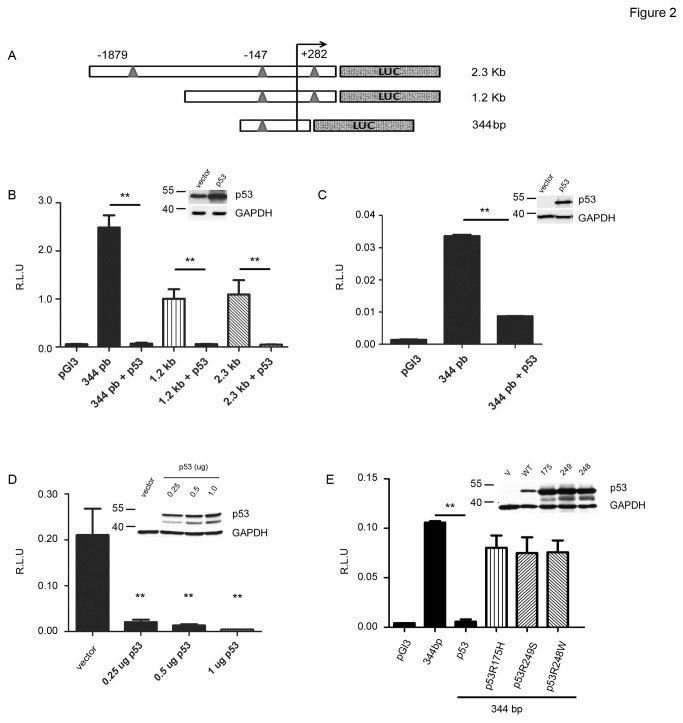
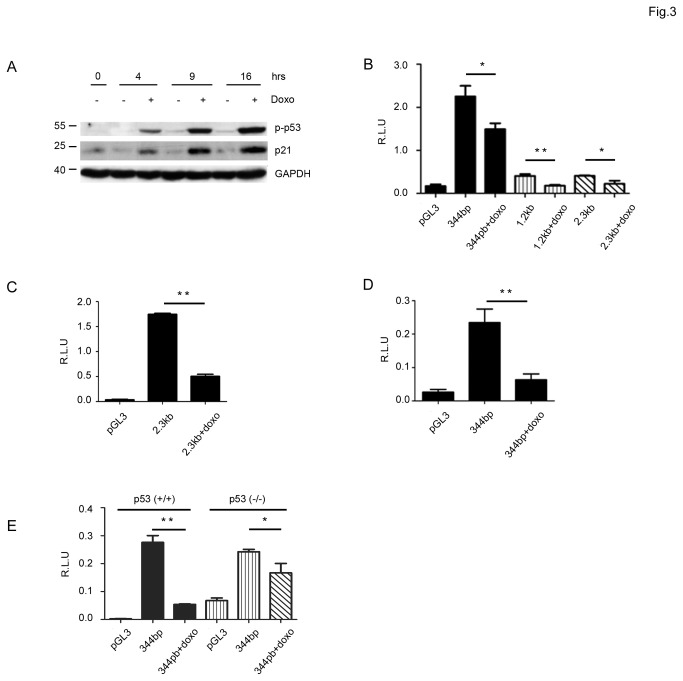
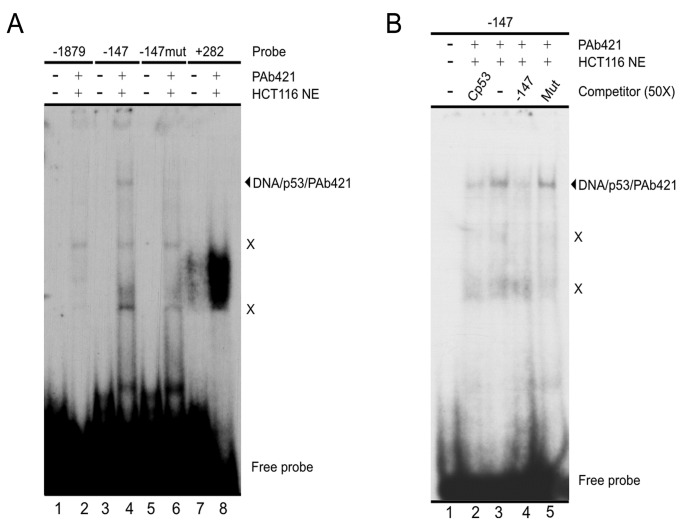
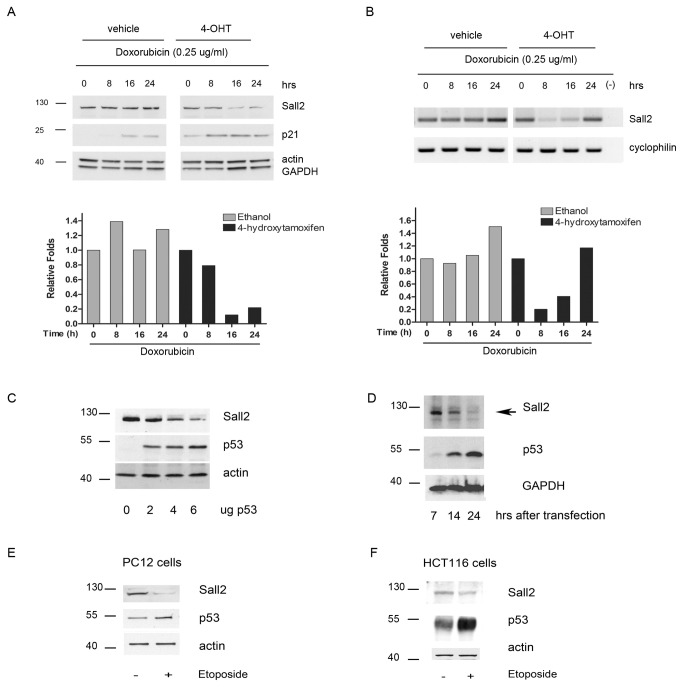
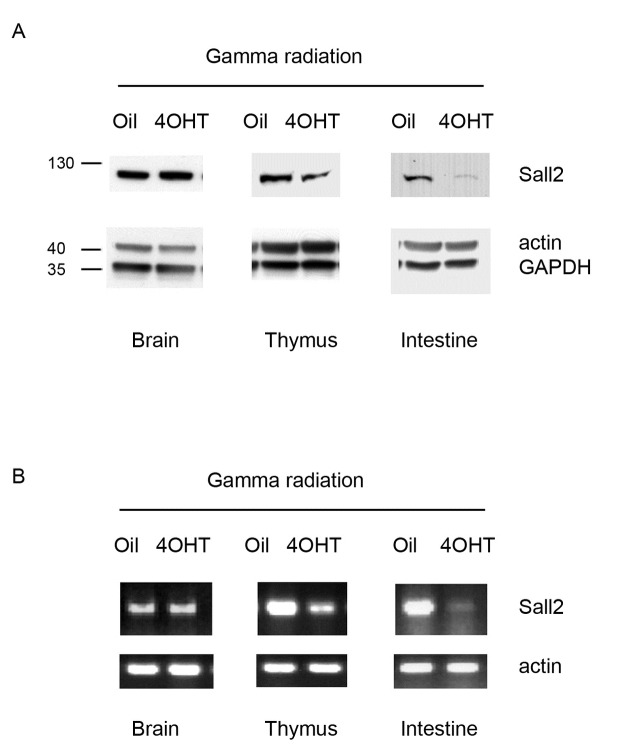
SALL2- a member of the Spalt gene family- is a poorly characterized transcription factor found deregulated in various cancers, which suggests it plays a role in the disease. We previously identified SALL2 as a novel interacting protein of neurotrophin receptors and showed that it plays a role in neuronal function, which does not necessarily explain why or how SALL2 is deregulated in cancer. Previous evidences indicate that SALL2 gene is regulated by the WT1 and AP4 transcription factors. Here, we identified SALL2 as a novel downstream target of the p53 tumor suppressor protein. Bioinformatic analysis of the SALL2 gene revealed several putative p53 half sites along the promoter region. Either overexpression of wild-type p53 or induction of the endogenous p53 by the genotoxic agent doxorubicin repressed SALL2 promoter activity in various cell lines. However R175H, R249S, and R248W p53 mutants, frequently found in the tumors of cancer patients, were unable to repress SALL2 promoter activity, suggesting that p53 specific binding to DNA is important for the regulation of SALL2. Electrophoretic mobility shift assay demonstrated binding of p53 to one of the identified p53 half sites in the Sall2 promoter, and chromatin immunoprecipitation analysis confirmed in vivo interaction of p53 with the promoter region of Sall2 containing this half site. Importantly, by using a p53ER (TAM) knockin model expressing a variant of p53 that is completely dependent on 4-hydroxy-tamoxifen for its activity, we show that p53 activation diminished SALL2 RNA and protein levels during genotoxic cellular stress in primary mouse embryo fibroblasts (MEFs) and radiosensitive tissues in vivo. Thus, our finding indicates that p53 represses SALL2 expression in a context-specific manner, adding knowledge to the understanding of SALL2 gene regulation, and to a potential mechanism for its deregulation in cancer.


Conflict of interest statement

Competing Interests: The authors have declared that no competing interests exist.

Figures

Figure 1
Figure 1. Identification of putative p53 half sites in the human SALL2 promoter gene.
A. Schematic representation of the SALL2 gene (NM_005407) showing exon 1, exon 1A and exon 2, and the positions of putative p53 half sites identified by bioinformatic analysis of the alternative promoters P1 (-897) and P2 (-1879 and -147), and of the intron region (+282). B. Promoter alignment of human and mouse SALL2 promoter regions by rVISTA and LALIGN. A 210 bp fragment upstream of the ATG of human and mouse exon 1A is schematized and the conserved p53 half site location is indicated. Flanking the p53 half site, two putative activator protein 4 (AP4) sites are underlined. The location of the putative stimulating protein 1 (SP1) site is also shown. Arrows and numbers refer to the ATG of Exon 1A.
Figure 2
Figure 2. Repression of SALL2 promoter activity by wild type p53.
Transient co-transfections of the SALL2 P2 promoter-luciferase reporter constructs with or without p53 into different cell lines were performed as described under “Materials and Methods”. Luciferase activity was measured from cell lysates and normalized to β-galactosidase activity, and promoter activity was expressed as relative luciferase units (R.L.U). pGL3 vector served as control. A. Schematic diagram of the 2.3kb, 1.2kb and 344bp fragments of the SALL2 P2 promoter-luciferase reporter constructs with triangles representing the location of p53 half sites B. Activity of the 344bp, 1.2kb or 2.3kb promoter constructs in the absence or presence of wild type p53 in 293T cells C. Promoter activity of the 344bp promoter construct in the absence or presence of p53 in p53 (-/-) Mouse embryo fibroblasts (MEFs p53 (-/-)). D. Promoter activity of the 344 bp promoter construct in the presence of different amounts of p53 in H1299 (p53-/-) cells. E. Promoter activity of the 344 bp promoter construct in the presence of wild type p53, R175H, R249S, or R248W p53 mutants in H1299 (p53-/-) cells. The results represent three independent experiments, each assayed in triplicate. Each bar represents the mean +/- standard error. Statistical significance was determined by student t-test (** p = 0.001). Western blot for p53 overexpression are shown at the top right corner of each graph, molecular weight markers are indicated on the left of the blot.
Figure 3
Figure 3. Repression of the SALL2 promoter activity by activation of endogenous p53.
A. Human HCT116 cells (p53 +/+) were exposed to doxorubicin for 4, 9 and 16 hours, and cell lysates were used to evaluate p53 activity by western blot analysis, molecular weight markers are indicated. Levels of p21 and phosphorylated p53 are shown B. Transient transfections of HCT116 cells with the promoter constructs schematized in Figure 2A were performed as described under “Materials and Methods”. Twenty-four hours after transfection cells were exposed to 1µM doxorubicin or vehicle (DMSO) for 12 h and then luciferase activity was measured from cell lysates and normalized to β-galactosidase activity. Promoter activity was expressed as relative luciferase units (R.L.U). pGL3 vector served as control. The results represent at least three independent experiments, each assayed in triplicate. Each bar represents the mean +/- standard error. Statistical significance was determined by student t-test (*: p < 0.005, ** p = 0.001). C. Promoter activity of the 344 bp construct in HCT116 cells after 24 h of exposure to doxorubicin. D. Same as in C. for the 2.3 kb construct. E. Equal number of HCT116 (P53+/+) and (P53-/-) cells were simultaneously transfected with the 344bp construct and exposed in parallel with DMSO or doxorubicin for 24 h. Promoter activity was measured as in B.
Figure 4
Figure 4. p53 binds to a DNA sequence located at -147 of the SALL2 P2 promoter.
A. EMSA assay testing double-stranded oligonucleotide probes containing the putative p53 binding sites located at positions -1879, -147 and +282 of the SALL2 gene (see text for details). The assay includes a -147 probe with two point mutations (-147mµt). The nuclear extract used in this assay was obtained from HCT116 p53 +/+ cells. B. The -147 probe was used in a competition analysis, in the presence of a 50x molar excess of the unlabeled oligonucleotides Cp53, -147mµt (Mut) and -147, as indicated at the top of the figure. This assay used a nuclear extract obtained from HCT116 p53+/+ cells. A and B. The presence of nuclear extract and PAb421 antibody in the binding reactions is indicated at the top of the figures. The migration of free probe and DNA/p53/PAb421 complex is indicated at the right side of the figure, as well as migration of non-specific complexes generated in the presence of nuclear extracts (X).
Figure 5
Figure 5. In vivo interaction of p53 with the proximal region of the SALL2 P2 promoter.
A. Relative positions of the PCR primers for amplification of the proximal and distal regions of the SALL2 P2 promoter and the intron region are shown schematically, the arrows represent the primer set positions refer to the ATG of Exon 1A. The circles and numbers indicate the location of the p53 half sites described in Figure 1A. B. ChIP analysis for the presence of p53 on the proximal and distal regions of the SALL2 P2 promoter and the intron region after 24h treatment with doxorubicin, the arrows show the expected band size. C. ChIP analysis for the presence of p53 on the proximal region of Sall2 promoter after 12 h treatment with doxorubicin. The presence of p53 on the p21 promoter was used as positive control, and purified mouse IgG was used as control antibody. D. Densitometry analysis of a representative ChIP experiment on the p21 promoter and the proximal region of SALL2 promoter after 12 h treatment. Values are expressed as percent of input. E. ChIP analysis for the presence of p53 on the proximal region after 24h treatment with doxorubicin. G. Densitometry analysis of a representative ChIP experiment on the proximal region of SALL2 promoter after 24h with doxorubicin. All experiments were performed in triplicate.
Figure 6
Figure 6. Inhibition of Sall2 expression by p53.
Early passages MEFs p53ER/ER were treated with 4 hydroxytamoxifen (4-OH Tamoxifen) or vehicle for 4 hours before doxorubicin treatment. A. Western blot analysis of SALL2 and p21, using whole-cell lysates from early-passage MEFs p53ER/ER that were cultured in either the presence (4-OH Tamoxifen) or the absence (vehicle) of 4-hydroxytamoxifen. β-actin and GAPDH show equal loading. Shown below densitometric analysis of the data using ImageJ. Sall2 band intensities were normalized by GAPDH. Results are expressed as fold changes relative to control vehicle treated cells, and representative of three independent experiments with similar results. B. RT-PCR analysis of Sall2 on total RNA isolated from same experiment as in A. Cyclofilin is used as normalizing gene. Shown below densitometric analysis of Sall2 mRNA levels normalized to cyclofilin. Results are expressed as fold changes relative to control vehicle treated cells. C. Western blot analysis of SALL2 and p53 using total protein lysates obtained from Rat PC12 pheocromocitoma cells transfected with various concentrations of p53. Lysates were subjected to SDS-PAGE and levels of endogenous SALL2 and exogenous p53 were evaluated by western blotting. Actin shows equal loading. D. Rat PC12 pheocromocitoma cells were transfected with 4 µg of wild type p53 and lysates were collected after 7, 14, and 24h post transfection. Endogenous SALL2 and exogenous p53 levels were evaluated by western blotting. GAPDH shows equal loading. E. Western blot analysis of endogenous SALL2 and p53 in rat PC12 cells treated with 10µM Etoposide for 12h. Actin shows equal loading. F. Western blot analysis of endogenous SALL2 and p53 in human HCT116 (p53+/+) colon cancer cells treated with 10µM etoposide for 24h. Actin shows equal loading. For all western blot molecular weight markers are indicated on the left side.
Figure 7
Figure 7. Activation of p53 by genotoxic insults decreases Sall2 levels in vivo.
p53 ER/ER mice were treated with 4OH Tamoxifen or vehicle and then exposed to gamma radiation as described in Material and Methods. A. Western blot analysis of Sall2 protein levels using total lysates obtained from sections of brain, thymus and small intestine from the p53 ER/ER mice. Actin and GAPDH show equal loading. Molecular weight markers are indicated on the left side. B. RT-PCR analysis of Sall2 gene on total RNA isolated from sections of brain, thymus and small intestine and brain from p53 ER/ER mice. Actin was used as normalizing gene. All tissues tested were from four individual mouse /condition. Representative tissues lysates are shown.

Similar articles

Cited by

References

    1. de Celis JF, Barrio R (2008) Regulation and function of Spalt proteins during animal development. Int J Dev Biol 52: 1-14. doi:10.1387/ijdb.072494mr. PubMed: 18033666. - DOI - PubMed
    1. Sweetman D, Münsterberg A (2006) The vertebrate spalt genes in development and disease. Dev Biol 293: 285-293. doi:10.1016/j.ydbio.2006.02.009. PubMed: 16545361. - DOI - PubMed
    1. Pincheira R, Baerwald M, Dunbar JD, Donner DB (2009) Sall2 is a novel p75NTR-interacting protein that links NGF signalling to cell cycle progression and neurite outgrowth. EMBO J 28: 261-273. doi:10.1038/emboj.2008.274. PubMed: 19131967. - DOI - PMC - PubMed
    1. Böhm J, Buck A, Borozdin W, Mannan AU, Matysiak-Scholze U et al. (2008) Sall1, sall2, and sall4 are required for neural tube closure in mice. Am J Pathol 173: 1455-1463. doi:10.2353/ajpath.2008.071039. PubMed: 18818376. - DOI - PMC - PubMed
    1. Kultima K, Jergil M, Salter H, Gustafson AL, Dencker L et al. (2010) Early transcriptional responses in mouse embryos as a basis for selection of molecular markers predictive of valproic acid teratogenicity. Reprod Toxicol 11: 64-68. PubMed: 20546886. - PubMed

Publication types

MeSH terms