. 2013 Sep 10;8(9):e74244.
doi: 10.1371/journal.pone.0074244. eCollection 2013.

Prion protein accumulation in lipid rafts of mouse aging brain

Affiliations

Prion protein accumulation in lipid rafts of mouse aging brain

Federica Agostini et al. PLoS One. .

Abstract

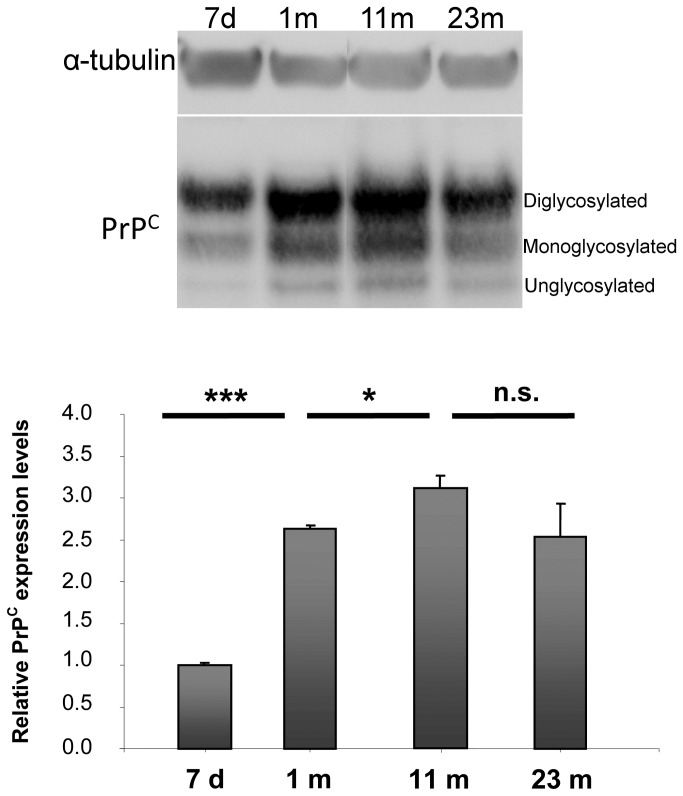
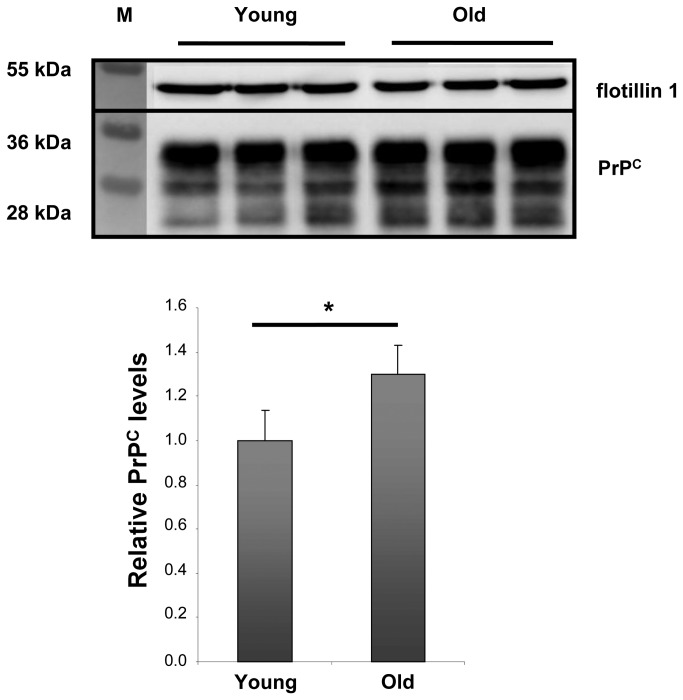
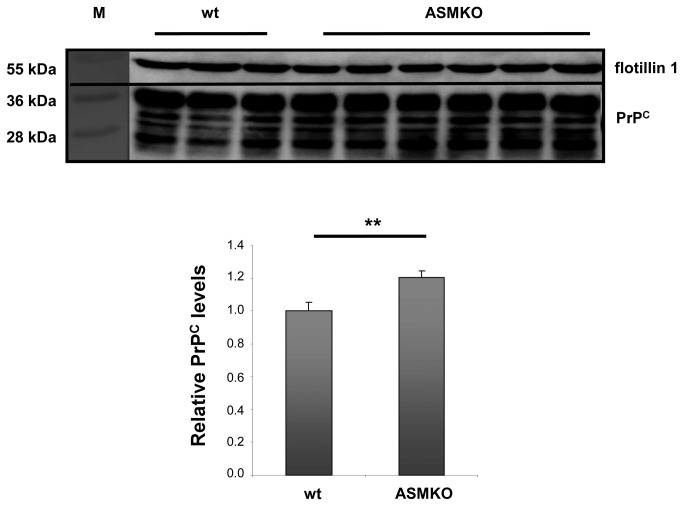
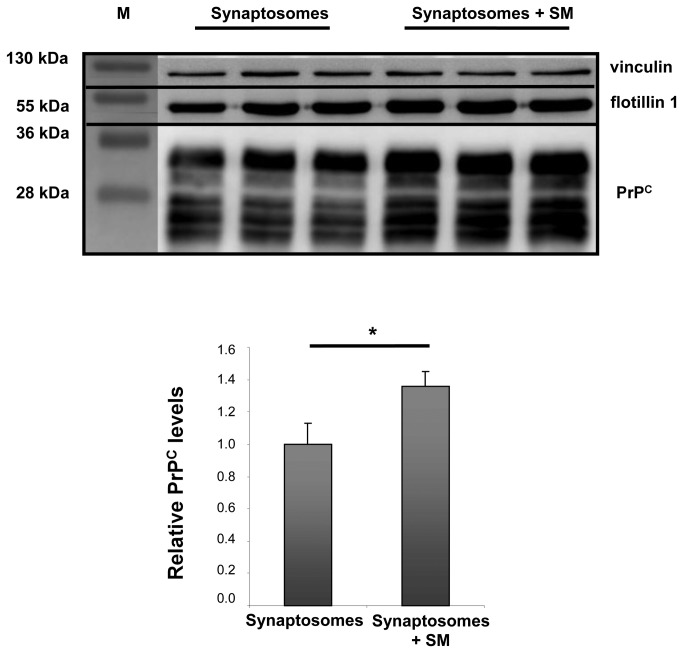
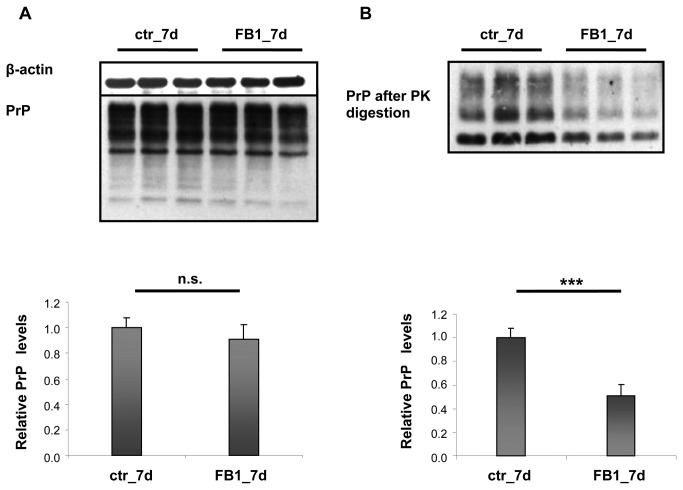
The cellular form of the prion protein (PrP(C)) is a normal constituent of neuronal cell membranes. The protein misfolding causes rare neurodegenerative disorders known as transmissible spongiform encephalopathies or prion diseases. These maladies can be sporadic, genetic or infectious. Sporadic prion diseases are the most common form mainly affecting aging people. In this work, we investigate the biochemical environment in which sporadic prion diseases may develop, focusing our attention on the cell membrane of neurons in the aging brain. It is well established that with aging the ratio between the most abundant lipid components of rafts undergoes a major change: while cholesterol decreases, sphingomyelin content rises. Our results indicate that the aging process modifies the compartmentalization of PrP(C). In old mice, this change favors PrP(C) accumulation in detergent-resistant membranes, particularly in hippocampi. To confirm the relationship between lipid content changes and PrP(C) translocation into detergent-resistant membranes (DRMs), we looked at PrP(C) compartmentalization in hippocampi from acid sphingomyelinase (ASM) knockout (KO) mice and synaptosomes enriched in sphingomyelin. In the presence of high sphingomyelin content, we observed a significant increase of PrP(C) in DRMS. This process is not due to higher levels of total protein and it could, in turn, favor the onset of sporadic prion diseases during aging as it increases the PrP intermolecular contacts into lipid rafts. We observed that lowering sphingomyelin in scrapie-infected cells by using fumonisin B1 led to a 50% decrease in protease-resistant PrP formation. This may suggest an involvement of PrP lipid environment in prion formation and consequently it may play a role in the onset or development of sporadic forms of prion diseases.


Conflict of interest statement

Competing Interests: The authors have declared that no competing interests exist.

Figures

Figure 1
Figure 1. PrPC expression levels in membrane extracts from mouse hippocampi at different developmental stages.
Western blot analysis of equal amounts of protein from hippocampal membrane extracts (25 µg per lane) at the indicated ages. 7 d = 7 days old; 1 m = 1 month old; 11 m = 11 months old; 23 m = 23 months old. Each lane corresponds to a single animal. Antibodies used: D18 (1:1,000; InPro Biotechnology, Inc, South San Francisco), mouse monoclonal anti α-tubulin (1:10,000; Calbiochem). The three major PrPC glycosylation forms are visible. Relative PrPC expression levels were analyzed from 3 to 4 mice per time point. Each data point represents the relative protein level normalized over α-tubulin ± SD. Changes in band intensity were analyzed and quantified with ImageJ 1.37v software (NIH, USA) followed by comparison with ANOVA test for groups of mice at different ages. Differences were considered significant when p<0.05. PrPC levels in hippocampal membrane from mice increased dramatically at the time of synaptogenesis (1 m), rose further during adulthood (11 m) and then remained at plateau during aging (23 m). n.s.: not significant, *: p<0.05, ***: p<0.001.
Figure 2
Figure 2. PrPC in DRM preparation of young (3-4 months) vs. old (20-21 months) mice.
Western blot analysis of DRMs prepared from equal amounts of total hippocampal protein extracts (100 µg of total protein) at the indicated ages. Young = 3-4 months old; old = 21-22 months old. Each lane corresponds to a single animal. Antibodies used: D18 (1:1,000; InPro Biotechnology, Inc, South San Francisco), mouse monoclonal anti flotillin1 (1:1,000; BD Biosciences). Relative PrPC amounts from 3 mice per time point were analyzed. Each data point represents the relative protein level normalized over flotillin1 ± SD.
Figure 3
Figure 3. PrPC in DRMs from hippocampal membrane of young wild-type mice compared with age-matched ASMKO mice.
Western blot analysis of DRMs prepared from equal amounts of hippocampal extracts (100 µg of protein) from young (4-5 months old) wild-type and ASMKO mice. Each lane corresponds to a single animal. Antibodies used: D18 (1:1,000; InPro Biotechnology, Inc, South San Francisco), mouse monoclonal anti flotillin1 (1:1,000; BD Biosciences). Quantification of relative PrPC amounts from 3 control mice and 6 ASMKO mice. Each data point represents the relative PrP level normalized over flotillin1 ± SD. PrPC levels are 20% higher in ASMKO mice compared to age-matched wild-type mice. **: p<0.01.
Figure 4
Figure 4. PrPC in DRMs from functional synaptosomes treated with sphingomyelin.
Western blot analysis of DRMs prepared from synaptosomes treated with sphingomyelin for 30 min (100 µg/mL) and relative controls. Antibodies used: D18 (1:1,000; InPro Biotechnology, Inc, South San Francisco), mouse monoclonal anti flotillin1 (1:1,000; BD Biosciences), mouse monoclonal anti vinculin (1:5,000; Sigma-Aldrich). Relative PrPC amounts from 3 preparations per condition. Each data point represents the relative PrP level normalized over vinculin ± SD. Sphingomyelin treatment determined about 30% increase in PrPC levels in DRMs. *: p<0.05.
Figure 5
Figure 5. PrPC expression levels in total protein extracts from primary neurons at different developmental stages.
Relative PrPC amount from 3 cultures per time point. Each data point represents the mean protein level normalized over tubuline ± SD. n.s.: not significant, *: p<0.05.
Figure 6
Figure 6. PrPC co-immunolabeling with Tau.
Confocal images of hippocampal primary neurons at different developmental stages. Normal (left) and surface (right) immunolabeling of PrPC (green) coupled with Tau staining (red). Antibodies used: D18 (10 µg/mL and 20 µg/mL in surface immunolabeling; InPro Biotechnology, Inc, South San Francisco), MN7.51, mouse monoclonal anti Tau (1:10; previously described in Novak et al., 1991). Scale bar = 10 µm.
Figure 7
Figure 7. PrPC co-immunolabeling with MAP2.
Confocal images of hippocampal primary neurons at different developmental stages. Normal (left) and surface (right) immunolabeling of PrPC (green) coupled with MAP2 staining (red). Antibodies used: D18 (10 µg/mL and 20 µg/mL in surface immunolabeling InPro Biotechnology, Inc, South San Francisco), rabbit polyclonal anti MAP2 (1:500; Santa Cruz). Scale bar = 10 µm.
Figure 8
Figure 8. PrPC co-immunolabeling with Tau and MAP2.
Confocal images of 21 DIV hippocampal primary neurons. Surface immunolabeling of PrPC (green) coupled with Tau staining (red) (left) or MAP2 staining (red) (right). Antibodies used: see figures 6 and 7. Scale bar = 10 µm.
Figure 9
Figure 9. PrPC co-immunolabeling with synaptophysin (left) and PSD95 (right).
Confocal images of fully developed hippocampal primary neurons (21 DIV). Normal (above) and surface immunolabeling (below) of PrPC (green) coupled with synaptophysin and PSD95 (red). Antibodies used: D18 (10 µg/mL and 20 µg/mL in surface immunolabeling InPro Biotechnology, Inc, South San Francisco), mouse monoclonal anti Synaptophisin (1:100; SySy), mouse monoclonal anti PSD95 (1:100; Sigma). Scale bar = 10 µm.
Figure 10
Figure 10. Total PrP and PK-resistant PrP in ScGT1 cells after treatment with FB1.
ScGT1 cells were treated for 7 days (7d) with FB1 (25 µM). A) Western blot analysis of equal amounts of protein from ScGT1 cells (25 µg per lane). Antibodies used: D18 (1:1,000; InPro Biotechnology, Inc, South San Francisco), mouse monoclonal anti β-actin (1:25,000; Sigma-Aldrich). Each data point represents the mean protein level normalized over β-actin ± SD. B) Western blot analysis of equal amounts of protein from ScGT1 cells (250 µg per lane) after PK digestion. Antibodies used: D18 (1:1,000; InPro Biotechnology, Inc, South San Francisco) and mouse monoclonal anti β-actin (Sigma). Each data point represents the mean protein level normalized over total PrP ± SD. No significant changes in PrP levels were detected in the total protein extracts or in protease-resistant PrP after sphingomyelin treatment. FB1 treatment did not affect total PrP levels while protease-resistant PrP decreased to 50% compared to control cultures. n.s.: not significant, ***: p<0.001.

References

    1. Manson J, West JD, Thomson V, McBride P, Kaufman MH et al. (1992) The prion protein gene: a role in mouse embryogenesis? Development 115: 117-122. PubMed: 1353438. - PubMed
    1. Ford MJ, Burton LJ, Li H, Graham CH, Frobert Y et al. (2002) A marked disparity between the expression of prion protein and its message by neurones of the CNS. Neuroscience 111: 533-551. doi:10.1016/S0306-4522(01)00603-0. PubMed: 12031342. - DOI - PubMed
    1. Salès N, Hässig R, Rodolfo K, Di Giamberardino L, Traiffort E et al. (2002) Developmental expression of the cellular prion protein in elongating axons. Eur J Neurosci 15: 1163-1177. doi:10.1046/j.1460-9568.2002.01953.x. PubMed: 11982627. - DOI - PubMed
    1. Benvegnù S, Poggiolini I, Legname G (2010) Neurodevelopmental expression and localization of the cellular prion protein in the central nervous system of the mouse. J Comp Neurol 518: 1879-1891. doi:10.1002/cne.22357. PubMed: 20394048. - DOI - PubMed
    1. Pan KM, Baldwin M, Nguyen J, Gasset M, Serban A et al. (1993) Conversion of alpha-helices into beta-sheets features in the formation of the scrapie prion proteins. Proc Natl Acad Sci U S A 90: 10962-10966. doi:10.1073/pnas.90.23.10962. PubMed: 7902575. - DOI - PMC - PubMed

Publication types

MeSH terms