. 2013 Sep 5;8(9):e74458.
doi: 10.1371/journal.pone.0074458. eCollection 2013.

Status epilepticus induces vasogenic edema via tumor necrosis factor-α/ endothelin-1-mediated two different pathways

Affiliations

Status epilepticus induces vasogenic edema via tumor necrosis factor-α/ endothelin-1-mediated two different pathways

Ji-Eun Kim et al. PLoS One. .

Abstract

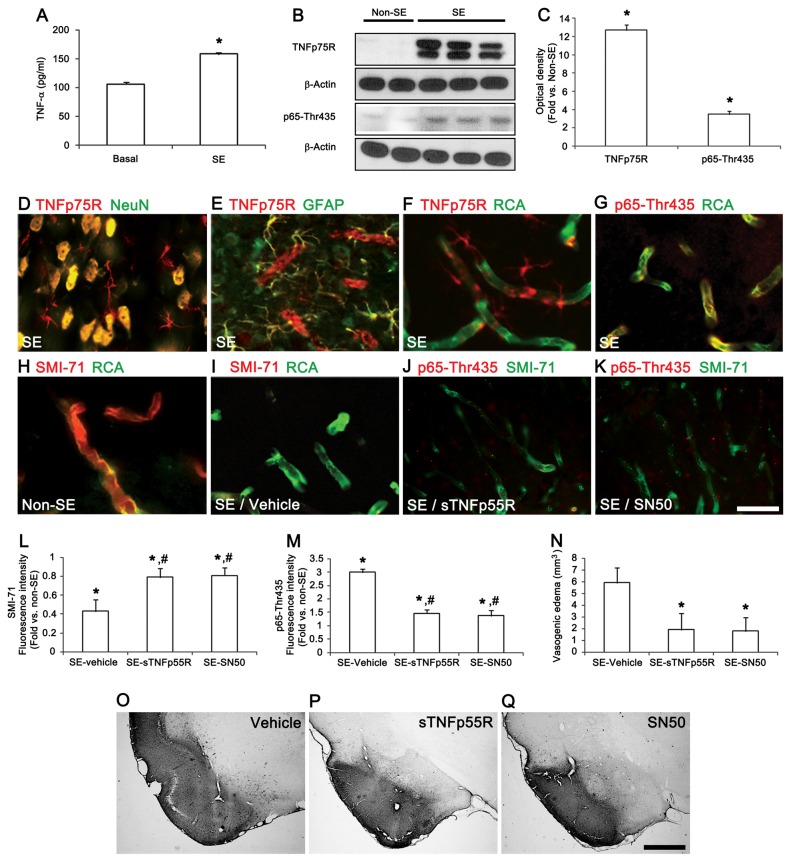
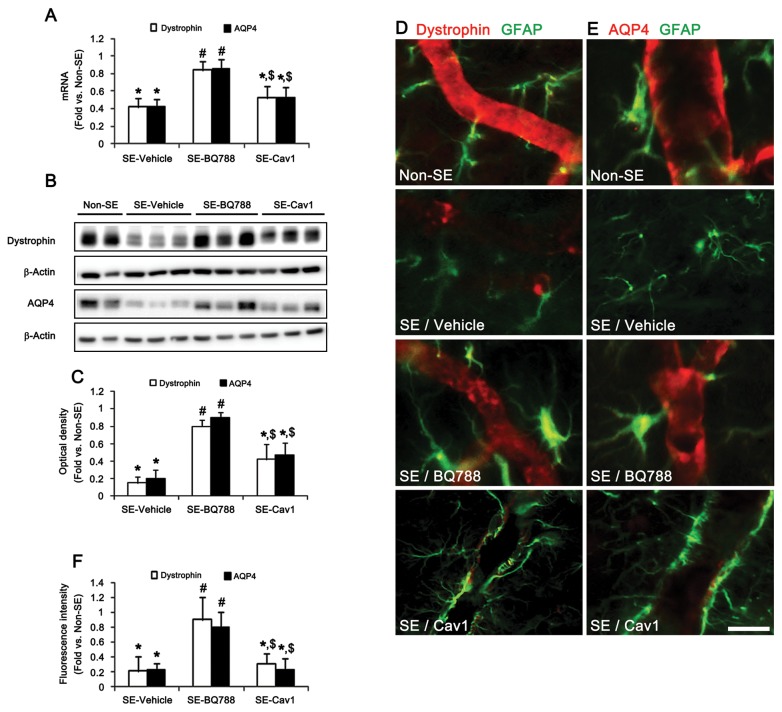
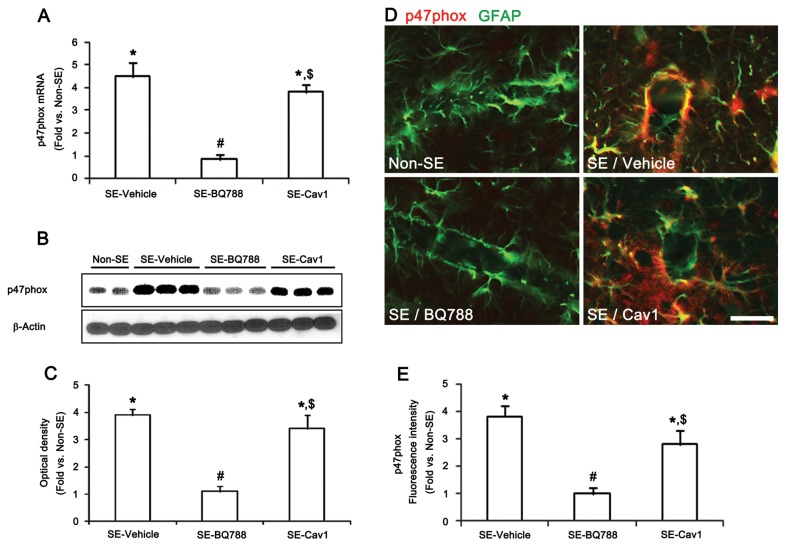
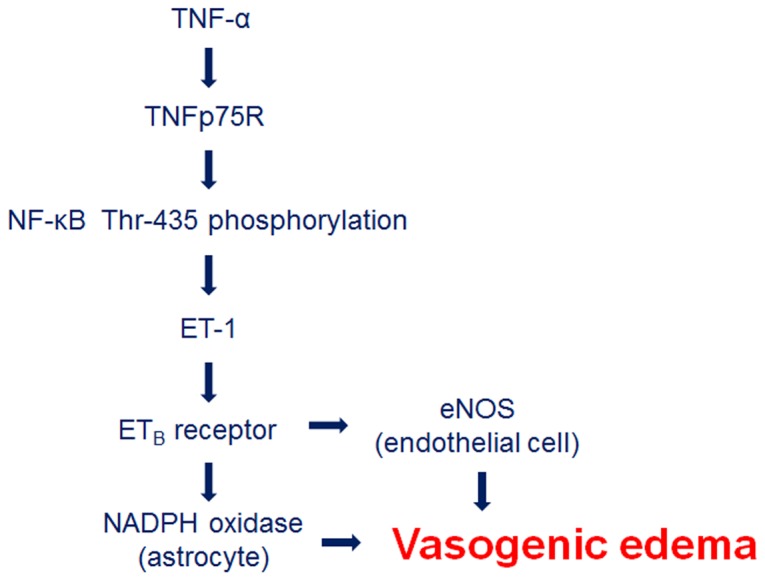
Status epilepticus (SE) induces vasogenic edema in the piriform cortex with disruptions of the blood-brain barrier (BBB). However, the mechanisms of vasogenic edema formation following SE are still unknown. Here we investigated the endothelin B (ETB) receptor-mediated pathway of SE-induced vasogenic edema. Following SE, the release of tumor necrosis factor-α (TNF-α) stimulated endothelin-1 (ET-1) release and expression in neurons and endothelial cells. In addition, TNF-α-induced ET-1 increased BBB permeability via ETB receptor-mediated endothelial nitric oxide synthase (eNOS) activation in endothelial cells. ETB receptor activation also increased intracellular reactive oxygen species by NADPH oxidase production in astrocytes. These findings suggest that SE results in BBB dysfunctions via endothelial-astroglial interactions through the TNF-α-ET-1-eNOS/NADPH oxidase pathway, and that these ETB receptor-mediated interactions may be an effective therapeutic strategy for vasogenic edema in various neurological diseases.


Conflict of interest statement

Competing Interests: The authors have declared that no competing interests exist.

Figures

Figure 1
Figure 1. The roles of TNF-α in SE-induced vasogenic edema in the PC.
(A) The extracellular TNF-α concentration after SE (mean ± s.d., n = 5): *P < 0.05 versus the basal level; paired Student’s t-test. (B and C) Quantification of western blots for TNF-α protein expression and p65-Thr435 NFκB phosphorylation 12 h after SE (means ± s.e.m., n = 5, respectively); *P < 0.05 by Student’s t-test. (DI) Immunofluorescence data for TNFp75R, p65-Thr435 NFκB phosphorylation and SMI-71 12 h after SE. (JK) Effects of TNFp55R and SN50 on p65-Thr435 NF-κB phosphorylation and SMI-71 immunoreactivity. (LM) Quantification of the fluorescence intensities of SMI-71 expression and p65-Thr435 NFκB phosphorylation 12 h after SE (means ± s.e.m., n = 5, respectively); *P < 0.05 versus non-SE animals; #P < 0.05 versus vehicle-treated animals; one-way analysis of variance (ANOVA) followed by Tukey’s test. (NQ) Quantification of vasogenic edema attenuation by sTNFp55R and SN50 3 days after SE (means ± s.e.m., n = 5, respectively); *P < 0.05 versus vehicle treated animals by one-way ANOVA followed by Tukey’s test. Scale bars: D–K, 25 μm; O-Q, 400 μm.
Figure 2
Figure 2. TNF-α/NFκB-mediated ET-1 release and expression in the PC following SE.
(A) The extracellular ET-1 concentration in the PC after SE (mean ± s.d., n = 5): *P < 0.05 versus basal level; paired Student’s t-test. (B) The effect of sTNFp55R, and SN50 pretreatment on ET-1 mRNA expression 12 h after SE (means ± s.e.m., n = 5, respectively); *P < 0.05 versus non-SE animals; #P < 0.05 versus vehicle-treated animals; one-way ANOVA followed by Tukey’s test. (CF) ET-1 expression in neurons and endothelial cells 12 h after SE. (GH) Effects of sTNFp55R and SN50 pretreatment on ET-1 expression and SMI-71 immunoreactivity 12 h after SE. (IK) Quantification of ETB receptor levels by western blotting and qRT-PCR in the PC 12 h after SE (means ± s.e.m., n = 5, respectively); *P < 0.05 versus non-SE animals; #P < 0.05 versus vehicle-treated animals; one-way ANOVA followed by Tukey’s test. (LO) Effect of SN50 on ETB receptor expression and SMI-71 immunoreactivity 12h after SE. Scale bars: C–H, L-O, 25 μm.
Figure 3
Figure 3. SE-induced vasogenic edema formation via the ETB receptor-mediated eNOS pathway.
(AB) Effect of BQ788 on SMI-71 expression and ETB receptor expression 12 h after SE. (C) Effect of BQ788 on ETB receptor mRNA expression 12 h after SE (means ± s.e.m., n = 5, respectively); paired Student’s t-test. (D) Nitrate/nitrite (NO products) concentration in the PC after SE (mean ± s.d., n = 5): *P < 0.05 versus basal level; paired Student’s t-test. (EG) Effects of BQ788 and Cav1-peptide on eNOS mRNA/protein expression 12 h after SE (means ± s.e.m., n = 5, respectively); *P < 0.05 versus non-SE animals; #P < 0.05 versus vehicle-treated animals; $P < 0.05 versus BQ788-treated animals; one-way ANOVA followed by Tukey’s test. (HJ) Effects of of BQ788 and Cav1-peptide on eNOS, SMI-71 and NT expression 12 h after SE (means ± s.e.m., n = 5, respectively); *P < 0.05 versus non-SE animals; #P < 0.05 versus vehicle-treated animals; $P < 0.05 versus BQ788-treated animals; one-way ANOVA followed by Tukey’s test. (KN) Quantification of vasogenic edema formation 3days after SE (means ± s.e.m., n = 5, respectively); *P < 0.05 versus vehicle-treated animals; #P < 0.05 versus BQ788-treated animals; one-way ANOVA followed by Tukey’s test. Scale bars: A, B, H and I, 25 μm; K-M, 400 μm.
Figure 4
Figure 4. ETB receptor-mediated reduction of dystrophin and AQP4 expression in astrocytes.
(AC) Effects of BQ788 and Cav1-peptide on dystrophin and AQP4 mRNA/protein expression levels 12 h after SE (means ± s.e.m., n = 5, respectively); *P < 0.05 versus non-SE animals; #P < 0.05 versus vehicle-treated animals; $P < 0.05 versus BQ788-treated animals; one-way ANOVA followed by Tukey’s test. (DF) Effects of BQ788 and Cav-1 peptide on dystrophin and AQP4 expression in astrocytes 12 h after SE (means ± s.e.m., n = 5, respectively); *P < 0.05 versus non-SE animals; #P < 0.05 versus vehicle-treated animals; $P < 0.05 versus BQ788-treated animals; one-way ANOVA followed by Tukey’s test. Scale bar: D and E, 12.5 μm.
Figure 5
Figure 5. ETB receptor-mediated p47phox expression in astrocytes.
(AC) Effects of BQ788 and Cav1-peptide on p47phox mRNA/protein expression level 12 h after SE (means ± s.e.m., n = 5, respectively); *P < 0.05 versus non-SE animals; #P < 0.05 versus vehicle-treated animals; $P < 0.05 versus BQ788-treated animals; one-way ANOVA followed by Tukey’s test. (DE) Effects of BQ788 and Cav-1 peptide on p47phox expression in astrocytes 12 h after SE (means ± s.e.m., n = 5, respectively); *P < 0.05 versus non-SE animals; #P < 0.05 versus vehicle-treated animals; $P < 0.05 versus BQ788-treated animals; one-way ANOVA followed by Tukey’s test (E). Scale bar: D, 25 μm.
Figure 6
Figure 6. SE-induced vasogenic edema formation via ETB receptor-mediated NADPH oxidase pathway.
(AE) Effects of BQ788 and apocynin on SE-induced up-regulation of 4-HNE immunoreactivity in astrocytes 12 h after SE (means ± s.e.m., n = 5, respectively); *P < 0.05 versus non-SE induced animals; #P < 0.05 versus vehicle-treated animals; one-way ANOVA followed by Tukey’s test. (FJ) Effects of BQ788 and apocynin on dystrophin and AQP4 expression 12h after SE (means ± s.e.m., n = 5, respectively); *P < 0.05 versus non-SE induced animals; #P < 0.05 versus vehicle-treated animals; one-way ANOVA followed by Tukey’s test. (KM) Effect of apocynin on dystrophin and AQP4 mRNA/protein expression levels after SE (means ± s.e.m., n = 5, respectively); *P < 0.05 versus non-SE animals; #P < 0.05 versus vehicle-treated animals; one-way ANOVA followed by Tukey’s test. (NQ) Quantification of the attenuation of vasogenic edema formation by BQ788 and apocynin in the PC (means ± s.e.m., n = 5, respectively); *P < 0.05 versus vehicle treated animals; #P < 0.05 versus BQ788-treated animals; one-way ANOVA followed by Tukey’s test. Scale bars: A-D, 12.5 μm; insertion in B, 10 μm; F–I, 25 μm; N–P, 400 μm.
Figure 7
Figure 7. Scheme depicting the role of the ET-1 in vasogenic edema formation induced by SE.

References

    1. Marmarou A (2007) A review of progress in understanding the pathophysiology and treatment of brain edema. Neurosurg Focus 22: E1. doi:10.3171/foc.2007.22.3.1. PubMed: 17613227. - DOI - PubMed
    1. Nitsch C, Suzuki R, Fujiwara K, Klatzo I (1985) Incongruence of regional cerebral blood flow increase and blood-brain barrier opening in rabbits at the onset of seizures induced by bicuculline, methoxypyridoxine, and kainic acid. J Neurol Sci 67: 67-79. doi:10.1016/0022-510X(85)90023-1. PubMed: 3981213. - DOI - PubMed
    1. Seiffert E, Dreier JP, Ivens S, Bechmann I, Tomkins O et al. (2004) Lasting blood-brain barrier disruption induces epileptic focus in the rat somatosensory cortex. J Neurosci 24: 7829-7836. doi:10.1523/JNEUROSCI.1751-04.2004. PubMed: 15356194. - DOI - PMC - PubMed
    1. Kim JE, Yeo SI, Ryu HJ, Kim MJ, Kim DS et al. (2010) Astroglial loss and edema formation in the rat piriform cortex and hippocampus following pilocarpine-induced status epilepticus. J Comp Neurol 518: 4612-4628. doi:10.1002/cne.22482. PubMed: 20886625. - DOI - PubMed
    1. Sheen SH, Kim JE, Ryu HJ, Yang Y, Choi KC et al. (2011) Decrease in dystrophin expression prior to disruption of brain-blood barrier within the rat piriform cortex following status epilepticus. Brain Res 1369: 173-183. doi:10.1016/j.brainres.2010.10.080. PubMed: 21029730. - DOI - PubMed

Publication types

MeSH terms

LinkOut - more resources