. 2013 Sep 11;8(9):e74687.
doi: 10.1371/journal.pone.0074687. eCollection 2013.

The rab11 effector protein FIP1 regulates adiponectin trafficking and secretion

Affiliations

The rab11 effector protein FIP1 regulates adiponectin trafficking and secretion

Brian P Carson et al. PLoS One. .

Abstract

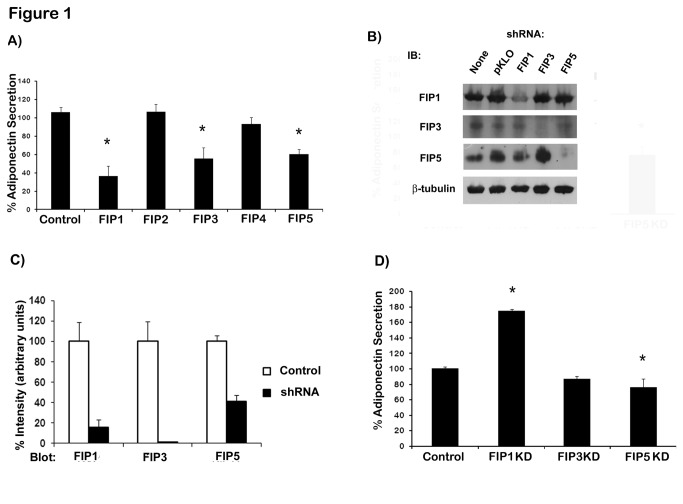
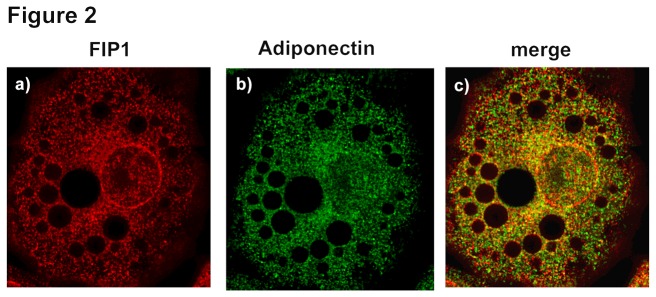
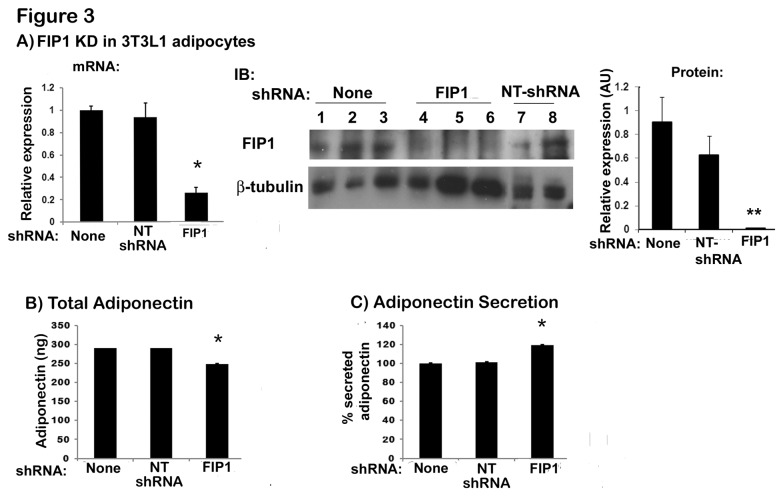
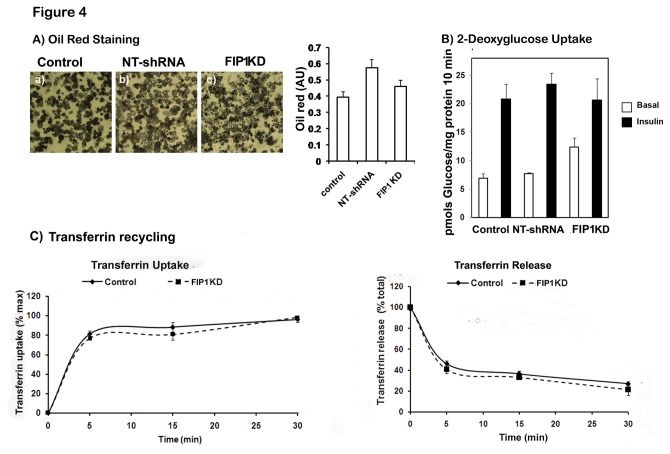
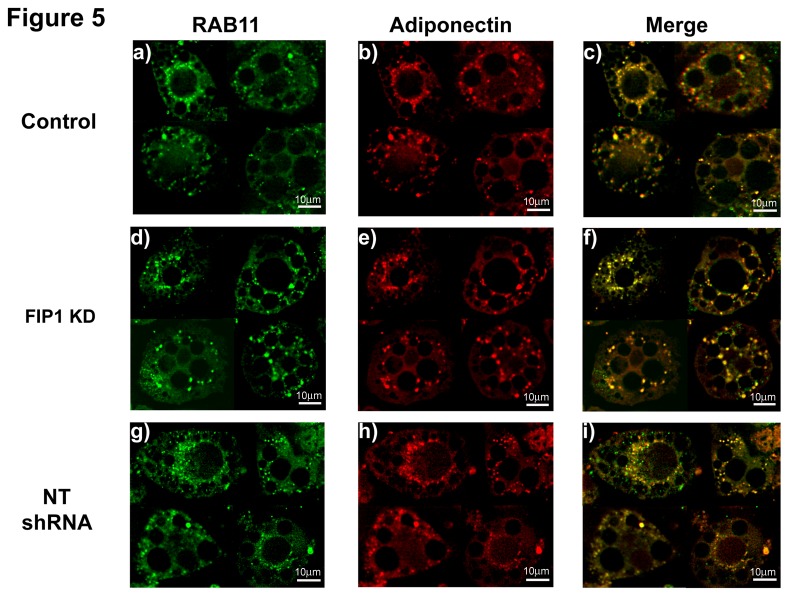
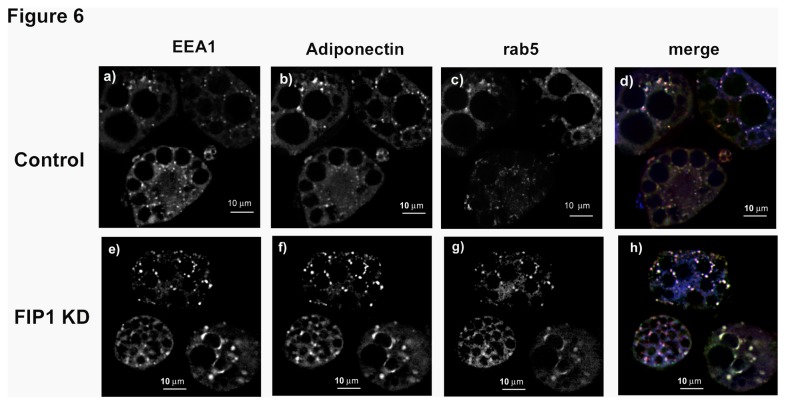
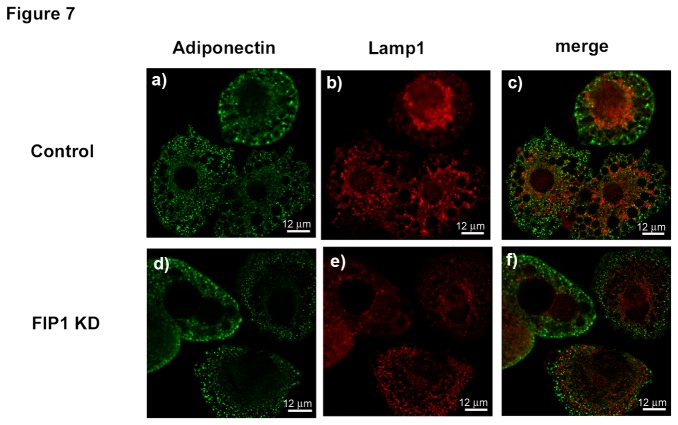
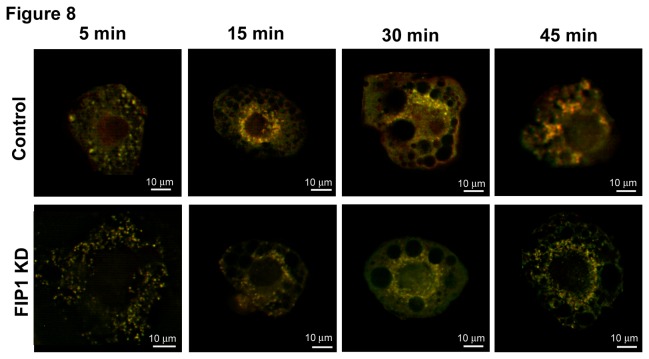
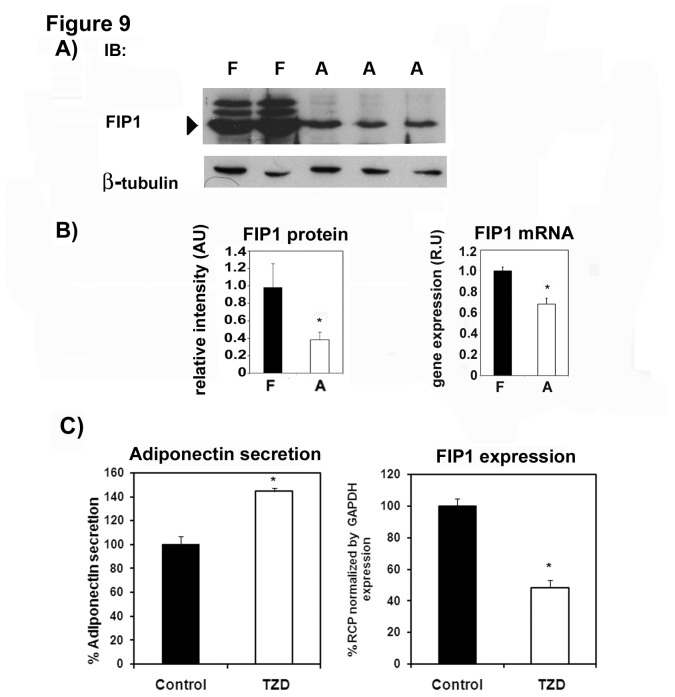
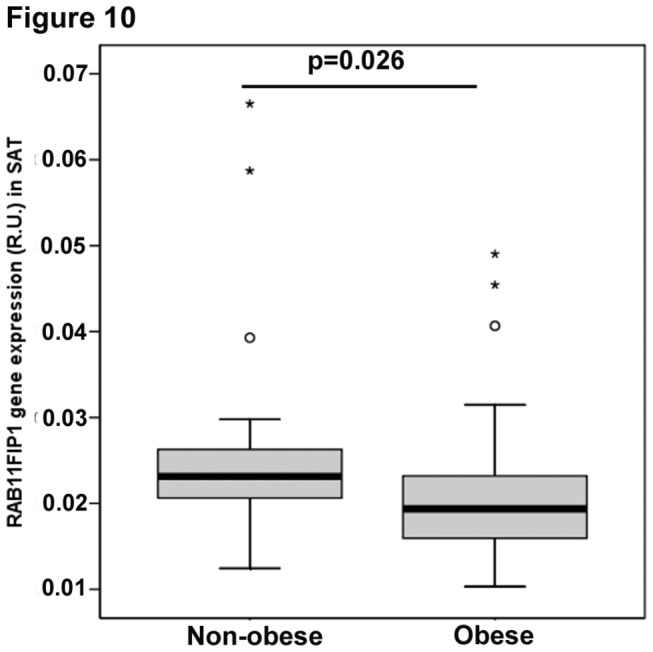
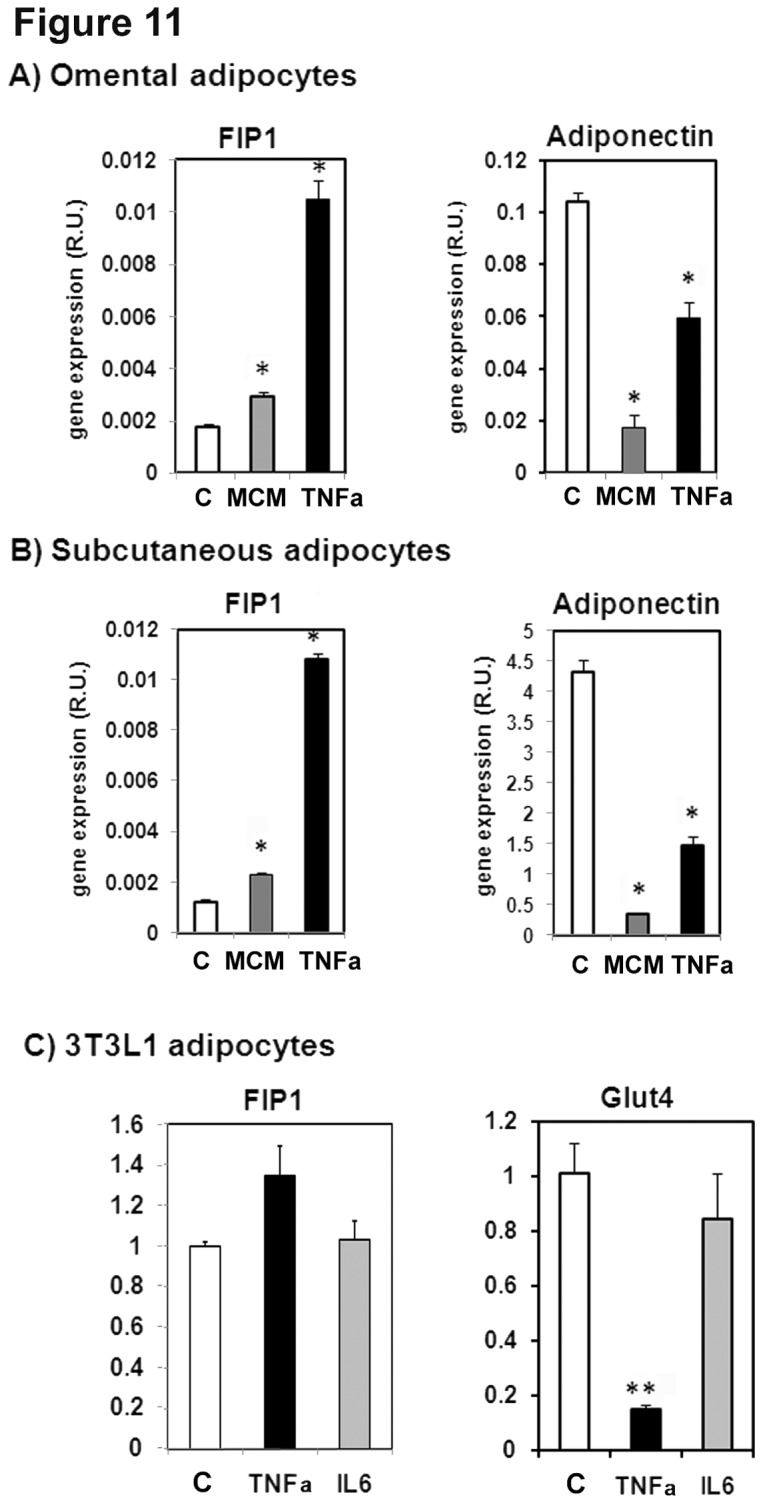
Adiponectin is an adipokine secreted by white adipocytes involved in regulating insulin sensitivity in peripheral tissues. Secretion of adiponectin in adipocytes relies on the endosomal system, however, the intracellular machinery involved in mediating adiponectin release is unknown. We have previously reported that intracellular adiponectin partially compartmentalizes with rab 5 and rab11, markers for the early/sorting and recycling compartments respectively. Here we have examined the role of several rab11 downstream effector proteins (rab11 FIPs) in regulating adiponectin trafficking and secretion. Overexpression of wild type rab11 FIP1, FIP3 and FIP5 decreased the amount of secreted adiponectin expressed in HEK293 cells, whereas overexpression of rab11 FIP2 or FIP4 had no effect. Furthermore shRNA-mediated depletion of FIP1 enhanced adiponectin release whereas knock down of FIP5 decreased adiponectin secretion. Knock down of FIP3 had no effect. In 3T3L1 adipocytes, endogenous FIP1 co-distributed intracellularly with endogenous adiponectin and FIP1 depletion enhanced adiponectin release without altering insulin-mediated trafficking of the glucose transporter Glut4. While adiponectin receptors internalized with transferrin receptors, there were no differences in transferrin receptor recycling between wild type and FIP1 depleted adipocytes. Consistent with its inhibitory role, FIP1 expression was decreased during adipocyte differentiation, by treatment with thiazolidinediones, and with increased BMI in humans. In contrast, FIP1 expression increased upon exposure of adipocytes to TNFα. In all, our findings identify FIP1 as a novel protein involved in the regulation of adiponectin trafficking and release.


Conflict of interest statement

Competing Interests: The authors have declared that no competing interests exist.

Figures

Figure 1
Figure 1. Rab11 FIP proteins regulate adiponectin release in HEK293 cells.
A) GFP tagged wild type RAB11-FIPs and myc tagged adiponectin were transiently co-transfected in HEK293 cells. 24hr following transfection adiponectin was quantitated by ELISA as indicated in the materials and methods section B) Knock down of FIP proteins in HEK293 cells. HEK293 were left untransfected or transfected with a shRNA empty vector (pKLO.1puro) or transfected with a pool of plasmid expressing shRNA sequences specific for FIP proteins as indicated. Whole cell lysates were obtained and protein samples were separated on SDS-PAGE, transferred to nitrocellulose filters and immunoblotted with specific antibodies detecting the human isoforms of FIP1, FIP3 and FIP5 proteins. Anti β-tubulin antibody was used as loading control. C) Quantification of the FIP knockdown efficiency for each FIP protein. Data are mean ± SEM from three independent experiments. D) HEK293 were transfected with a shRNA expression (pKLO.1puro) empty vector or shRNA vectors containing shRNA sequences for FIP proteins (as indicated, mission shRNA SIGMA). Cells were selected for 96 hours in puromycin (2 µg/ml) containing media and surviving cells were transfected with a plasmid coding for adiponectin-myc. 24hr following transfection adiponectin was quantitated by ELISA in cell lysates and media and adiponectin secretion was calculated as indicated in the materials and methods section. Data are means ± SEM of at least three independent experiments Statistical analysis: One way ANOVA * indicates statistically different from control cells (p < 0.05).
Figure 2
Figure 2. Intracellular distribution of FIP1, and adiponectin in adipocytes.
3T3L1 cells were cultured and differentiated to adipocytes as described in the methods section. Cells were fixed, permeabilized and immunostained with anti-FIP1 (Sigma) and anti-adiponectin (R and D) primary antibodies and Alexa-488 and Alexa-594 –conjugated secondary antibodies. Data shown is representative of cells obtained from three independent sets of cells. Determination of colocalization was carried out as described (n = 27).
Figure 3
Figure 3. Knock down of FIP1 in 3T3L1 adipocytes increases adiponectin secretion.
3T3L1 cell lines stably expressing non-targeting shRNAs or shRNAs for FIP1 were generated as described in the methods section. Cells were cultured in the presence of 3-5 µg/ml puromycin to select for shRNA expressing cells and subsequently differentiated into adipocytes and used on day 10 after differentiation. A) Knock down of FIP1 in adipocytes. Left panel: total RNA was extracted from control (uninfected), non-targeting shRNA expressing and FIP1 shRNA expressing cells, and the mRNA for FIP1 was quantified by qPCR. Gene expression was normalized to Cyclophilin A using the ΔΔCT method. Graph is the mean ± SEM of 3 independent experiments each quantified in triplicate. Statistical analysis: one way ANOVA. *indicates p<0.05 relative to control cells. Middle panel: Cell lysates were obtained from differentiated control (non-infected) cells, cells expressing FIP1 specific shRNAs or non-targeting (NT) shRNAs. Samples were separated by SDS-PAGE, transferred to nitrocellulose filter and immunoblotted with an anti-FIP1 antibody or anti β-tubulin antibody as shown. The right panel shows quantification of the western blot normalized to tubulin. Statistical analysis: one way ANOVA, ** indicates p<0.01 relative to control non-infected cells. B) Adiponectin expression. Total intracellular adiponectin content was determined in control (non-infected) cells, in cells expressing non-targeting shRNAs or shRNAS for FIP1. Cellular lysates were obtained from fully differentiated cells, and adiponectin content quantified as described in the methods section. Data from two independent experiments, with n=5 replicates each. Data are mean ± SEM. * Statistic analysis: one way ANOVA, * indicates p<0.05 relative to control cells. C) Adiponectin secretion. Culture media and cell lysates were obtained from control cells (non infected), non-targeting shRNA expressing cells, or FIP1-depleted cells the amount of adiponectin quantitated using ELISA. Secretion was calculated as indicated in the methods section. Secretion is expressed as a percentage of total adiponectin expressed. Data from two independent experiments, with n=5 replicates each. Data are mean ± SEM. * indicates statistically different from control cells (p < 0.05). NT shRNA = non-targeting shRNA.
Figure 4
Figure 4. Knock down of FIP1 does not alter adipogenesis, insulin-stimulated Glut4 translocation or transferrin receptor recycling.
Control 3T3L1 cells (non-infected), and 3T3L1 cell lines stably expressing a non-targeting shRNA or shRNAs for FIP1 were cultured and differentiated to adipocytes and used on day 10 after differentiation. A) Cells were fixed and stained with oil red and visualized under a light microscope. Images were taken in a Leica microscope. Representative images are shown from at least three independent experiments. Oil red stain was extracted in isopropanol and the absorbance quantified at 500 nm. B) Cells were serum starved in DMEM for 3 hours and either left untreated or treated with insulin (100 nM) for 30 minutes. 3H-2-deoxyglucose uptake was then measured for 10 minutes as indicated in the material and methods section. 3H -2-deoxyglucose uptake at 1 mM final concentration for 10 minutes is within the linear range in these cells (not shown) C) Transferrin recycling. Transferrin uptake: control and FIP1 Knock down 3T3L1 cells were incubated with Alexa-488 conjugated transferrin as indicated in the methods section. At different time points cells were washed and the intracellular fluorescence determined by flow cytometry. Transferrin release: Cells were first loaded with Alexa-488 transferrin for 45 minutes at 37°C and then washed at different time points as indicated. Cells were collected and intracellular fluorescence quantitated by flow cytometry as described in the methods section. Results show mean ± SEM of 2 independent experiments quantified in triplicate.
Figure 5
Figure 5. Knock Down of FIP1 does not impair traffic of adiponectin to the ERC compartment.
Control uninfected 3T3L1 cells or expressing non-targeting shRNAs or FIP1- shRNAs cultured and differentiated to adipocytes and used on day 10 after differentiation. Cells were fixed, permeabilized and stained with specific antibodies to detect endogenous rab11 and adiponectin proteins. Secondary antibodies conjugated to Alexa-488 or Alexa-594 respectively were used to visualize the proteins. Cells were visualized using a Leica DMI6000 microscope. Representative cells from 3 independent experiments are shown. Determination of colocalization was carried out as described (Control (n = 10), FIP1 shRNA (n = 9), NT shRNA (n = 4)). Panels c, f and i show the merged images.
Figure 6
Figure 6. Knock down of FIP1 does not impair traffic of adiponectin to the sorting endosome.
Control, uninfected 3T3L1 cells, or cells stably expressing shRNAs for FIP1 were cultured and differentiated to adipocytes and used on day 10 after differentiation. Cells were fixed, permeabilized and stained with specific antibodies to detect endogenous EEA1, Rab5 and adiponectin proteins. Secondary antibodies conjugated to Alexa-350, Alexa-488 and Alexa-594 were used to visualize the proteins. Cells were imaged in a Leica DMI6000 microscope. Representative cells are shown obtained in three independent experiments. Determination of colocalization was carried out as described (Rab 5: Control (n = 9), FIP1 shRNA (n = 7); EEA1: Control (n = 10), FIP1 shRNA (n = 11) Panels d and h show the merged images.
Figure 7
Figure 7. Adiponectin does not localize with Lamp1 containing membranes in adipocytes.
Control (uninfected) 3T3L1 cells or cells expressing shRNAs for FIP1 were cultured and differentiated to adipocytes and used on day 10 after differentiation. Cells were fixed, permeabilized and stained with specific antibodies to detect endogenous adiponectin or lamp1. Secondary antibodies conjugated to Alexa488 and Alexa594 were used to visualize the proteins. Representative cells are shown from 3 independent experiments. Panels c, and f show the merged images.
Figure 8
Figure 8. Adiponectin receptors are internalized and localize with transferrin receptor in intracellular membranes.
Control uninfected 3T3L1 cells or cells expressing shRNAs for FIP1 were cultured and differentiated to adipocytes and used on day 10 after differentiation. Cells were labelled with biotin-adiponectin and Alexa-594 conjugated transferrin at 4°C for 30 minutes and then incubated in Alexa488-streptavidin. Internalization of adiponectin and transferrin bound receptors was allowed at 37°C for the times as indicated. Cells were then transferred to ice, and fixed in PFA as detailed in the methods section. Cells were imaged in a Leica DMI6000 microscope. Data shown are the merged images. Representative cells are shown selected from three independent experiments.
Figure 9
Figure 9. FIP1 expression decreases during adipogenesis, and by treatment with troglitazone.
A) Cell lysates were obtained from 3T3L1 fibroblasts (F) or fully differentiated adipocytes (A). Samples were separated by SDS-PAGE, transferred to a nitrocellulose filter and immunoblotted with an anti-FIP1 or β-tubulin antibody as shown. Representative blot of two independent experiments. B) Quantification of FIP1 protein levels (left panel) or FIP1 mRNA levels (right panel) following the differentiation of 3T3L1 cells to adipocytes. Data shows mean ± SEM of triplicate values. Statistic analysis: One way ANOVA * indicates p<0.05. C) 3T3L1 cells were cultured and differentiated to adipocytes. At day 8 of differentiation, cells were either left untreated or treated with vehicle or with 10 µM troglitazone for 3 days. Conditioned media and cellular lysates were harvested for adiponectin quantification by ELISA as described in the methods section A subset of cell plates were used for total RNA isolation and mRNA for FIP1 was quantified by real time PCR as described in the methods section. Data shows mean ± SEM of 2 independent experiments each performed in triplicate. Statistical analysis, one way ANOVA: * indicates p<0.05.
Figure 10
Figure 10. Expression of FIP1 mRNA in subcutaneous adipose tissue in association with obesity status.
Expression of FIP1 gene in human adipose tissue biopsies was quantified as described in the methods section and correlated with BMI (body mass index). Subjects were classified as non-obese if BMI<30 kg/m2(N=21) and obese if BMI>30 kg/m2(N=55). Diabetic patients were excluded. Boxplots showing the median, interquartile range, outliers, and extreme cases. Statistical analysis T-test, p=0.026.
Figure 11
Figure 11. Pro-inflammatory cytokines increase the expression of FIP1 in adipocytes.
Human preadipocyte cells from omental (A) or subcutaneous (B) adipose tissue were obtained from Zen-Bio and differentiated as per their instructions for 14 days. A subset of cells were left untreated (control, C) or were incubated in media supplemented with macrophage conditioned media (MCM, 5% v/v) or with 100 ng/ml of Tumor necrosis factor alpha (TNFα), Total RNA was isolated and FIP1 and adiponectin mRNA was quantitated by real time PCR as indicated in the methods section. Relative quantification was carried out using the ∆∆Ct method using PPIA gene expression as an internal control. Statistical analysis: One way ANOVA. * indicates statistical significance p<0.05. Data from one experiment with triplicate cell dishes. C) Fully differentiated 3T3L1 adipocytes were incubated in the absence (control, C) or presence of TNFα (TNFα) or Interleukin 6 (IL6) at 50 ng/ml for 24 hours, Total RNA was isolated and the amount of mRNA for FIP1, or Glut4 was determined by real time PCR. Quantification was carried out using the ∆∆Ct method using cyclophyllin A as internal control. The graph shows data from a representative experiment of two independent experiments each carried out with triplicate cell dishes for each group. Statistical analysis: One way ANOVA, ** indicates p<0.01.

Similar articles

Cited by

References

    1. Hu E, Liang P, Spiegelman BM (1996) AdipoQ is a Novel Adipose-specific Gene Dysregulated in Obesity. J Biol Chem 271: 10697-10703. doi:10.1074/jbc.271.18.10697. PubMed: 8631877. - DOI - PubMed
    1. Scherer PE, Williams S, Fogliano M, Baldini G, Lodish HF (1995) A Novel Serum Protein Similar to C1q Produced exclusively in Adipocytes. J Biol Chem 270: 26746-26749. doi:10.1074/jbc.270.45.26746. PubMed: 7592907. - DOI - PubMed
    1. Maeda K, Okubo K, Shimomura I, Funahashi T, Matsuzawa Y et al. (1996) cDNA cloning and Expression of a ovel Adipose Specific Collagen-like Factor, apM1 (Adipose Most Abundant Gene Transcript 1). Biochem Biophys Res Commun 221: 286-289. doi:10.1006/bbrc.1996.0587. PubMed: 8619847. - DOI - PubMed
    1. Yamauchi T, Kamon J, Terauchi Y, Kubota N, Hara K et al. (2001) The fat-derived hormone adiponectin reverses insulin resistance associated with both lipoatrophy and obesity. Nat Med 7: 941-945. doi:10.1038/90984. PubMed: 11479627. - DOI - PubMed
    1. Berg A, Combs T, Du X, Brownlee M, Scherer PE (2001) The adipocyte-secreted protein Acrp30 enhances hepatic insulin action. Nat Med 7: 847-853. doi:10.1038/89977. PubMed: 11433351. - DOI - PubMed

Publication types

MeSH terms