

Identification of an evolutionarily conserved cis-regulatory element controlling the Peg3 imprinted domain
- PMID: 24040411
- PMCID: PMC3769284
- DOI: 10.1371/journal.pone.0075417
Identification of an evolutionarily conserved cis-regulatory element controlling the Peg3 imprinted domain
Abstract
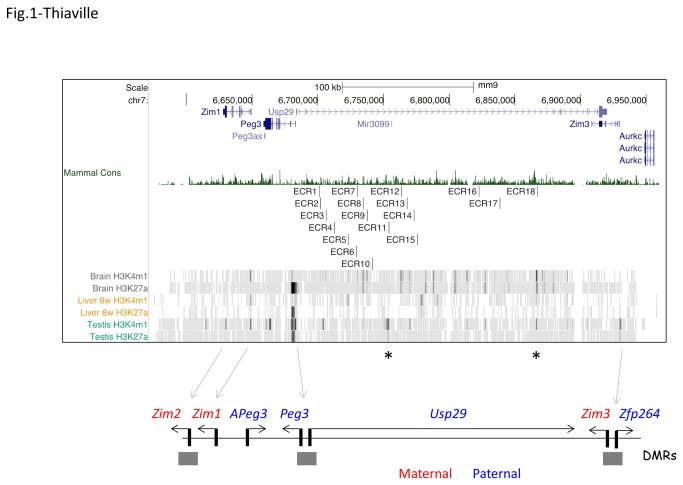
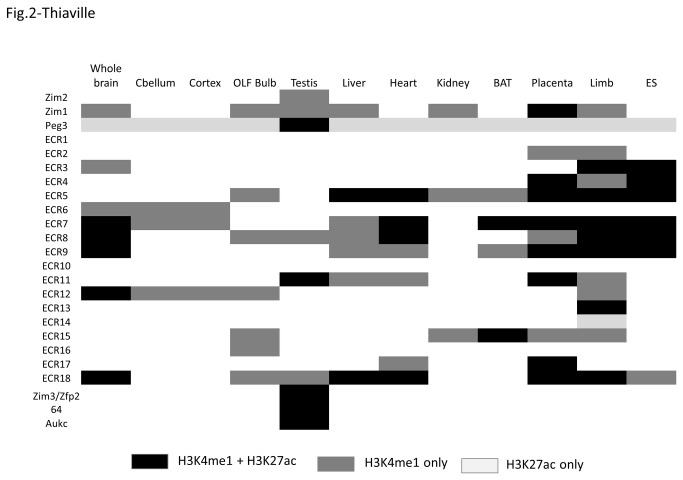
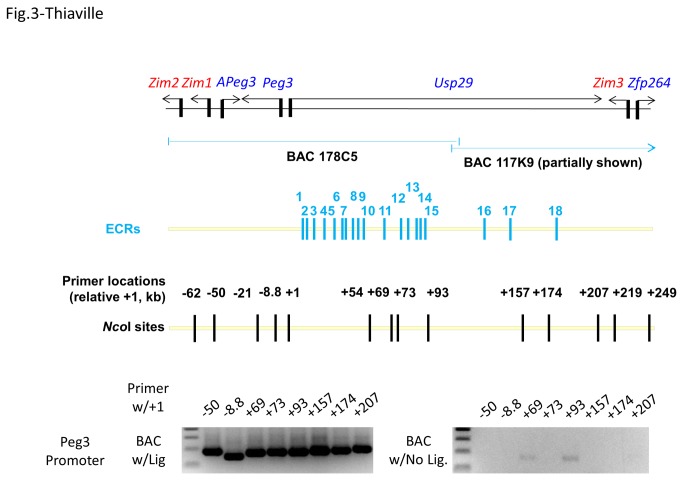
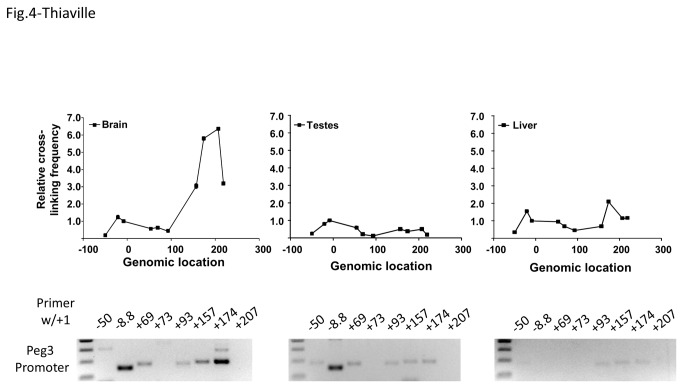
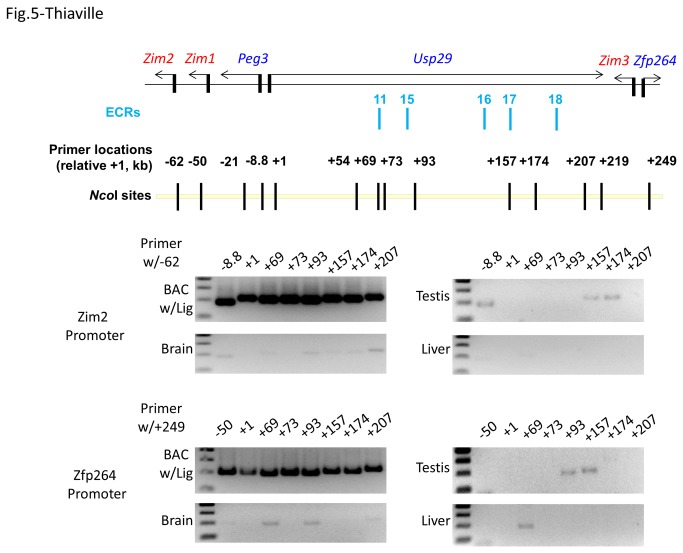
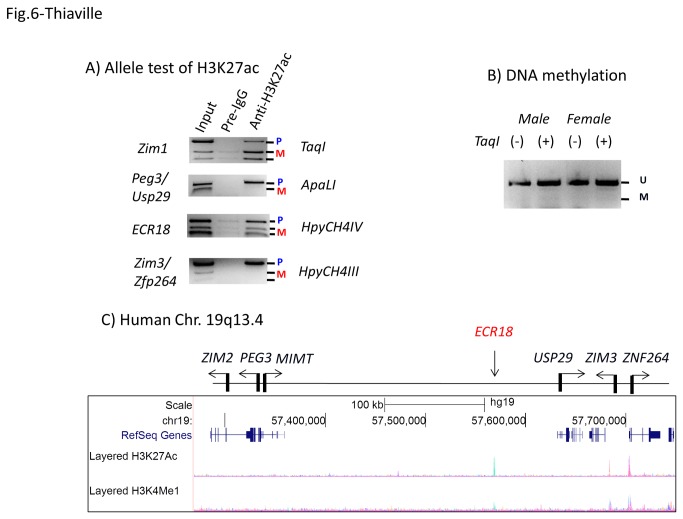
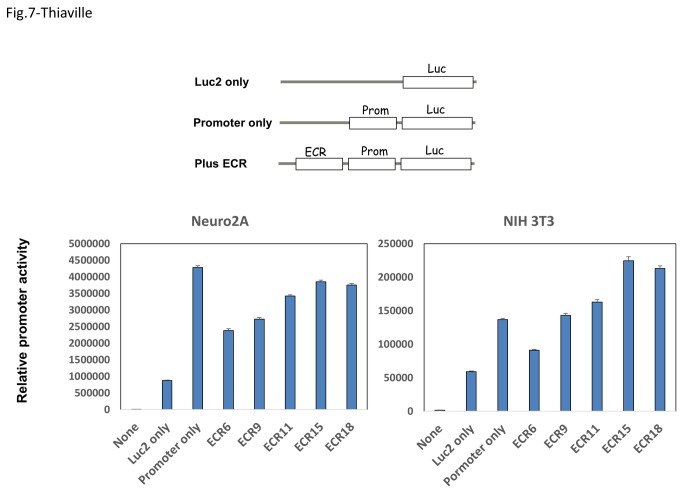
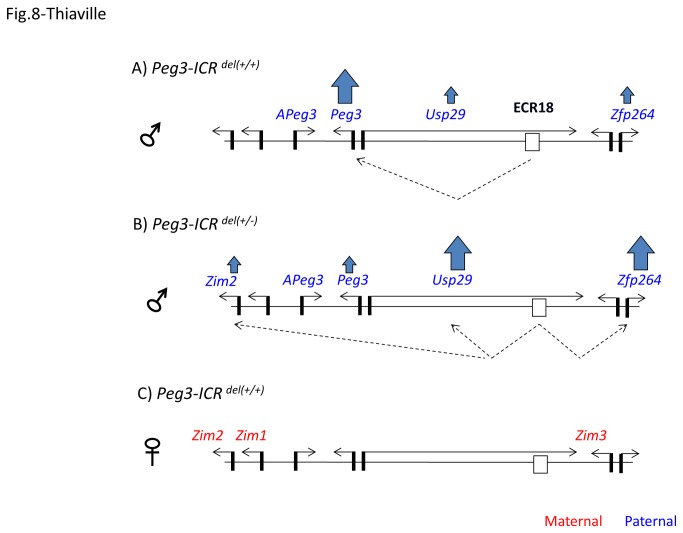
The mammalian Peg3 domain harbors more than 20 evolutionarily conserved regions (ECRs) that are spread over the 250-kb genomic interval. The majority of these ECRs are marked with two histone modifications, H3K4me1 and H3K27ac, suggesting potential roles as distant regulatory elements for the transcription of the nearby imprinted genes. In the current study, the chromatin conformation capture (3C) method was utilized to detect potential interactions of these ECRs with the imprinted genes. According to the results, one region, ECR18, located 200-kb upstream of Peg3 interacts with the two promoter regions of Peg3 and Zim2. The observed interaction is most prominent in brain, but was also detected in testis. Histone modification and DNA methylation on ECR18 show no allele bias, implying that this region is likely functional on both alleles. In vitro assays also reveal ECR18 as a potential enhancer or repressor for the promoter of Peg3. Overall, these results indicate that the promoters of several imprinted genes in the Peg3 domain interact with one evolutionarily conserved region, ECR18, and further suggest that ECR18 may play key roles in the transcription and imprinting control of the Peg3 domain as a distant regulatory element.
Conflict of interest statement
Figures
Similar articles
-
Phylogenetic and Epigenetic Footprinting of the Putative Enhancers of the Peg3 Domain.PLoS One. 2016 Apr 22;11(4):e0154216. doi: 10.1371/journal.pone.0154216. eCollection 2016. PLoS One. 2016. PMID: 27104590 Free PMC article.
-
Lineage-specific imprinting and evolution of the zinc-finger gene ZIM2.Genomics. 2004 Jul;84(1):47-58. doi: 10.1016/j.ygeno.2004.02.007. Genomics. 2004. PMID: 15203203
-
Inversion of the imprinting control region of the Peg3 domain.PLoS One. 2017 Jul 18;12(7):e0181591. doi: 10.1371/journal.pone.0181591. eCollection 2017. PLoS One. 2017. PMID: 28719641 Free PMC article.
-
Regulation and function of the peg3 imprinted domain.Genomics Inform. 2014 Sep;12(3):105-13. doi: 10.5808/GI.2014.12.3.105. Epub 2014 Sep 30. Genomics Inform. 2014. PMID: 25317109 Free PMC article. Review.
-
Genomic imprinting: cis-acting sequences and regional control.Int Rev Cytol. 2005;243:173-213. doi: 10.1016/S0074-7696(05)43003-X. Int Rev Cytol. 2005. PMID: 15797460 Review.
Cited by
-
Bipartite structure of the inactive mouse X chromosome.Genome Biol. 2015 Aug 7;16(1):152. doi: 10.1186/s13059-015-0728-8. Genome Biol. 2015. PMID: 26248554 Free PMC article.
-
Parental and sexual conflicts over the Peg3 imprinted domain.Sci Rep. 2016 Nov 30;6:38136. doi: 10.1038/srep38136. Sci Rep. 2016. PMID: 27901122 Free PMC article.
-
Phylogenetic and Epigenetic Footprinting of the Putative Enhancers of the Peg3 Domain.PLoS One. 2016 Apr 22;11(4):e0154216. doi: 10.1371/journal.pone.0154216. eCollection 2016. PLoS One. 2016. PMID: 27104590 Free PMC article.
-
Sex and Tissue Specificity of Peg3 Promoters.PLoS One. 2016 Oct 6;11(10):e0164158. doi: 10.1371/journal.pone.0164158. eCollection 2016. PLoS One. 2016. PMID: 27711129 Free PMC article.
-
cfDNA Methylation Profiles and T-Cell Differentiation in Women with Endometrial Polyps.Cells. 2022 Dec 9;11(24):3989. doi: 10.3390/cells11243989. Cells. 2022. PMID: 36552753 Free PMC article.
References
-
- Bartolomei MS, Ferguson-Smith AC (2011) Mammalian genomic imprinting. Cold Spring Harb Perspect Biol. 3(7)pii : 10.1101/cshperspect.a002592. - DOI - PMC - PubMed
-
- Spahn L, Barlow DP (2003) An ICE pattern crystallizes. Nat Genet 35: 11-12. doi:10.1038/ng0903-11. PubMed: 12947402. - DOI - PMC - PubMed
-
- Edwards CA, Ferguson-Smith AC (2007) Mechanisms regulating imprinted genes in clusters. Curr Opin Cell Biol 19: 281-289. doi:10.1016/j.ceb.2007.04.013. PubMed: 17467259. - DOI - PubMed
-
- Ideraabdullah FY, Vigneau S, Bartolomei MS (2008) Genomic imprinting mechanisms in mammals. Mutat Res 647: 77-85. doi:10.1016/j.mrfmmm.2008.08.008. PubMed: 18778719. - DOI - PMC - PubMed
-
- Abramowitz LK, Bartolomei MS (2012) Genomic imprinting: recognition and marking of imprinted loci. Curr Opin Genet Dev 22: 72-78. doi:10.1016/j.gde.2011.12.001. PubMed: 22195775. - DOI - PMC - PubMed
Publication types
MeSH terms
Substances
Grants and funding
LinkOut - more resources
Full Text Sources
Other Literature Sources
