

DNA topoisomerases participate in fragility of the oncogene RET
- PMID: 24040417
- PMCID: PMC3770543
- DOI: 10.1371/journal.pone.0075741
DNA topoisomerases participate in fragility of the oncogene RET
Abstract
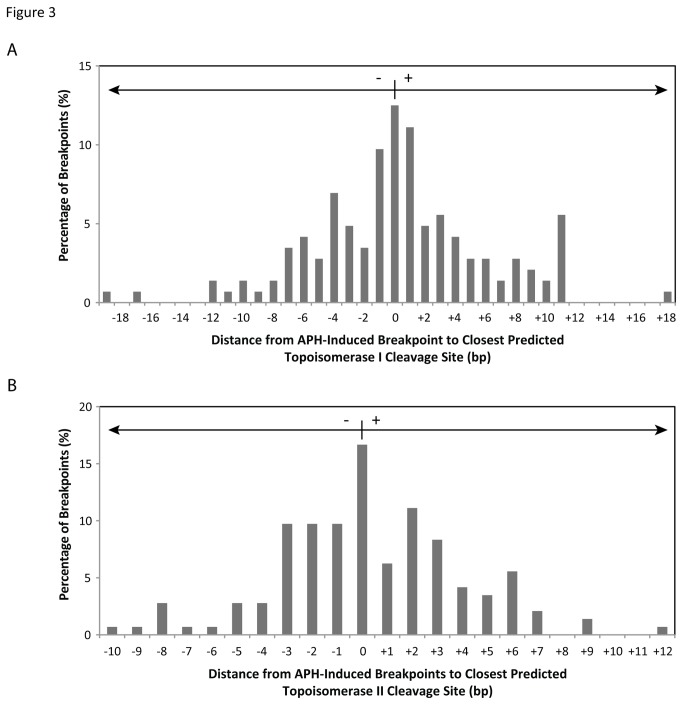
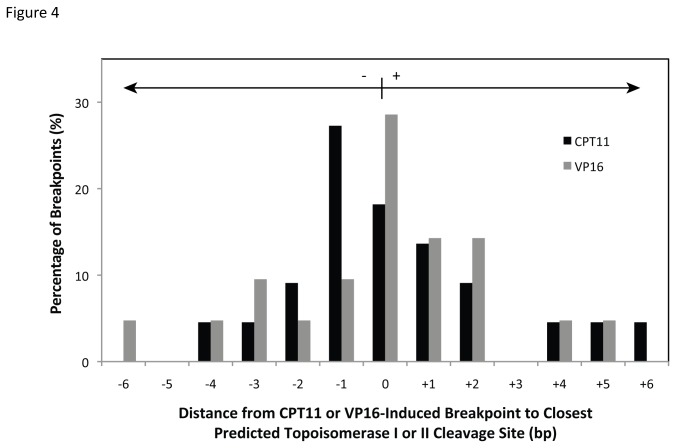
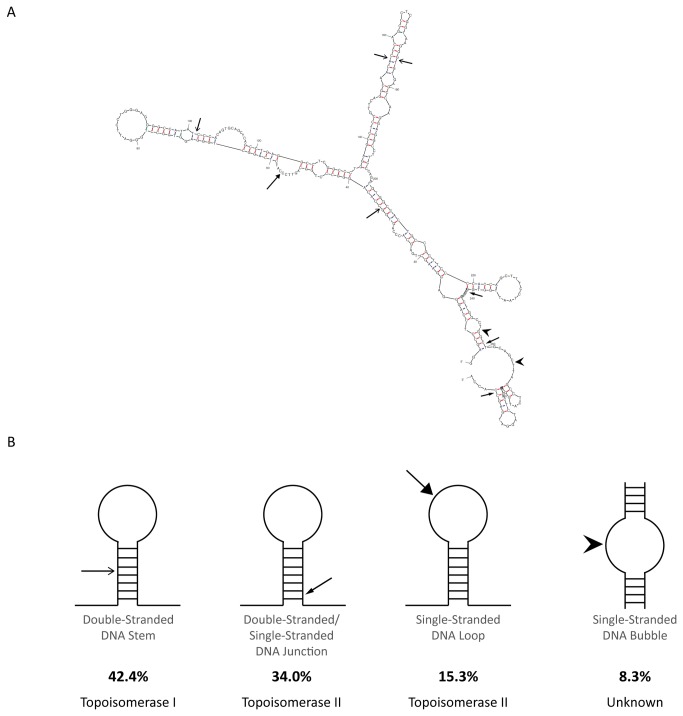
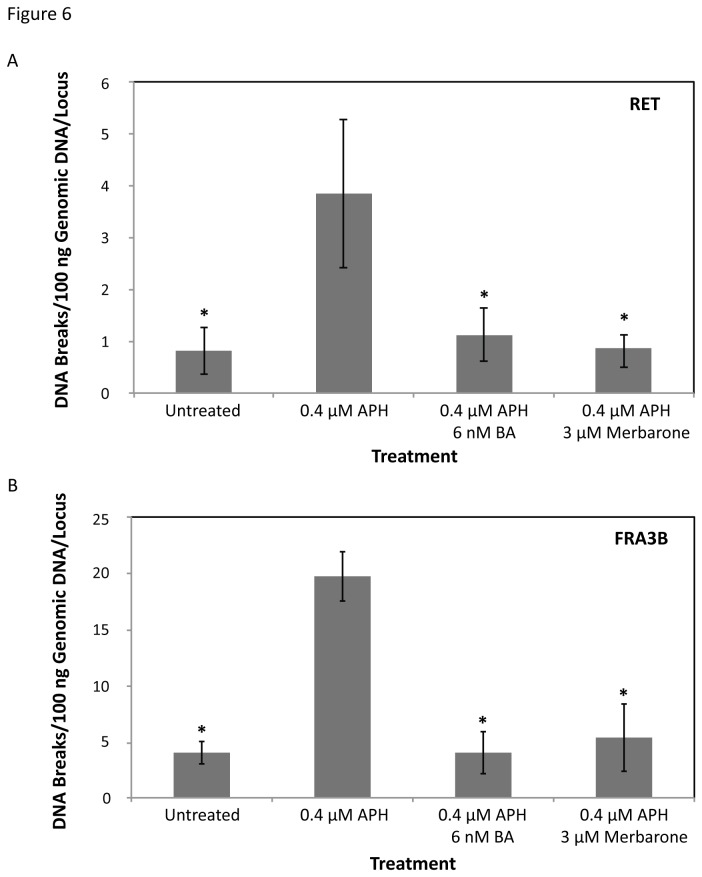
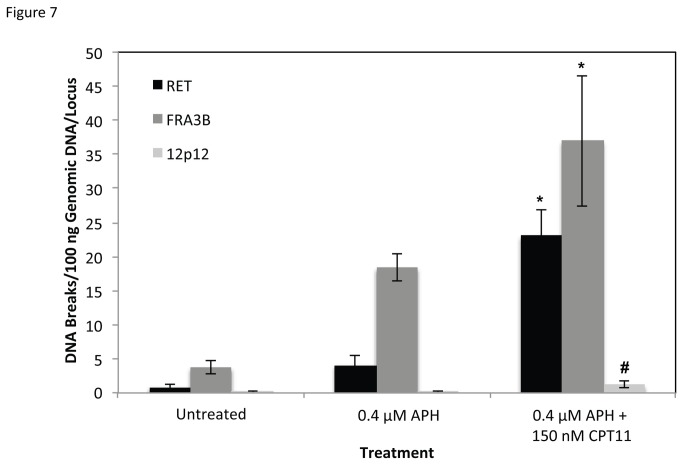
Fragile site breakage was previously shown to result in rearrangement of the RET oncogene, resembling the rearrangements found in thyroid cancer. Common fragile sites are specific regions of the genome with a high susceptibility to DNA breakage under conditions that partially inhibit DNA replication, and often coincide with genes deleted, amplified, or rearranged in cancer. While a substantial amount of work has been performed investigating DNA repair and cell cycle checkpoint proteins vital for maintaining stability at fragile sites, little is known about the initial events leading to DNA breakage at these sites. The purpose of this study was to investigate these initial events through the detection of aphidicolin (APH)-induced DNA breakage within the RET oncogene, in which 144 APH-induced DNA breakpoints were mapped on the nucleotide level in human thyroid cells within intron 11 of RET, the breakpoint cluster region found in patients. These breakpoints were located at or near DNA topoisomerase I and/or II predicted cleavage sites, as well as at DNA secondary structural features recognized and preferentially cleaved by DNA topoisomerases I and II. Co-treatment of thyroid cells with APH and the topoisomerase catalytic inhibitors, betulinic acid and merbarone, significantly decreased APH-induced fragile site breakage within RET intron 11 and within the common fragile site FRA3B. These data demonstrate that DNA topoisomerases I and II are involved in initiating APH-induced common fragile site breakage at RET, and may engage the recognition of DNA secondary structures formed during perturbed DNA replication.
Conflict of interest statement
Figures


Similar articles
-
DNA breaks at fragile sites generate oncogenic RET/PTC rearrangements in human thyroid cells.Oncogene. 2010 Apr 15;29(15):2272-80. doi: 10.1038/onc.2009.502. Epub 2010 Jan 25. Oncogene. 2010. PMID: 20101222 Free PMC article.
-
RET rearrangements in radiation-induced papillary thyroid carcinomas: high prevalence of topoisomerase I sites at breakpoints and microhomology-mediated end joining in ELE1 and RET chimeric genes.Genomics. 2001 Apr 15;73(2):149-60. doi: 10.1006/geno.2000.6434. Genomics. 2001. PMID: 11318605
-
DNA fragile site breakage as a measure of chemical exposure and predictor of individual susceptibility to form oncogenic rearrangements.Carcinogenesis. 2017 Mar 1;38(3):293-301. doi: 10.1093/carcin/bgw210. Carcinogenesis. 2017. PMID: 28069693 Free PMC article.
-
Topoisomerase Inhibitors and Targeted Delivery in Cancer Therapy.Curr Top Med Chem. 2019;19(9):713-729. doi: 10.2174/1568026619666190401112948. Curr Top Med Chem. 2019. PMID: 30931860 Review.
-
Breakpoint clusters: reason or consequence?Crit Rev Eukaryot Gene Expr. 2004;14(1-2):65-77. Crit Rev Eukaryot Gene Expr. 2004. PMID: 15104528 Review.
Cited by
-
Are common fragile sites merely structural domains or highly organized "functional" units susceptible to oncogenic stress?Cell Mol Life Sci. 2014 Dec;71(23):4519-44. doi: 10.1007/s00018-014-1717-x. Epub 2014 Sep 20. Cell Mol Life Sci. 2014. PMID: 25238782 Free PMC article. Review.
-
Innovative Tools for DNA Topology Probing in Human Cells Reveal a Build-Up of Positive Supercoils Following Replication Stress at Telomeres and at the FRA3B Fragile Site.Cells. 2024 Aug 15;13(16):1361. doi: 10.3390/cells13161361. Cells. 2024. PMID: 39195250 Free PMC article.
-
Molecular Process Producing Oncogene Fusion in Lung Cancer Cells by Illegitimate Repair of DNA Double-Strand Breaks.Biomolecules. 2015 Sep 30;5(4):2464-76. doi: 10.3390/biom5042464. Biomolecules. 2015. PMID: 26437441 Free PMC article. Review.
-
RET Gene Fusions in Malignancies of the Thyroid and Other Tissues.Genes (Basel). 2020 Apr 15;11(4):424. doi: 10.3390/genes11040424. Genes (Basel). 2020. PMID: 32326537 Free PMC article. Review.
-
Environmental and chemotherapeutic agents induce breakage at genes involved in leukemia-causing gene rearrangements in human hematopoietic stem/progenitor cells.Mutat Res. 2015 Sep;779:86-95. doi: 10.1016/j.mrfmmm.2015.06.011. Epub 2015 Jun 27. Mutat Res. 2015. PMID: 26163765 Free PMC article.
References
-
- Kondo T, Ezzat S, Asa SL (2006) Pathogenetic mechanisms in thyroid follicular-cell neoplasia. Nat Rev Cancer 6: 292-306. doi:10.1038/nrc1836. PubMed: 16557281. - DOI - PubMed
-
- Nikiforov YE, Nikiforova MN (2011) Molecular genetics and diagnosis of thyroid cancer. Nat Rev Endocrinol 7: 569-580. doi:10.1038/nrendo.2011.142. PubMed: 21878896. - DOI - PubMed
-
- Kohno T, Ichikawa H, Totoki Y, Yasuda K, Hiramoto M et al. (2012) KIF5B-RET fusions in lung adenocarcinoma. Nat Med 18: 375-377. doi:10.1038/nm.2644. PubMed: 22327624. - DOI - PMC - PubMed
-
- Takeuchi K, Soda M, Togashi Y, Suzuki R, Sakata S et al. (2012) RET, ROS1 and ALK fusions in lung cancer. Nat Med 18: 378-381. doi:10.1038/nm.2658. PubMed: 22327623. - DOI - PubMed
-
- Nikiforov YE (2002) RET/PTC rearrangement in thyroid tumors. Endocr Pathol 13: 3-16. doi:10.1385/EP:13:1:03. PubMed: 12114746. - DOI - PubMed
Publication types
MeSH terms
Substances
Grants and funding
LinkOut - more resources
Full Text Sources
Other Literature Sources
Research Materials
