. 2013 Dec 1;591(23):6017-37.
doi: 10.1113/jphysiol.2013.263079. Epub 2013 Sep 16.

Altered skeletal muscle mitochondrial biogenesis but improved endurance capacity in trained OPA1-deficient mice

Affiliations

Altered skeletal muscle mitochondrial biogenesis but improved endurance capacity in trained OPA1-deficient mice

F Caffin et al. J Physiol. .

Abstract

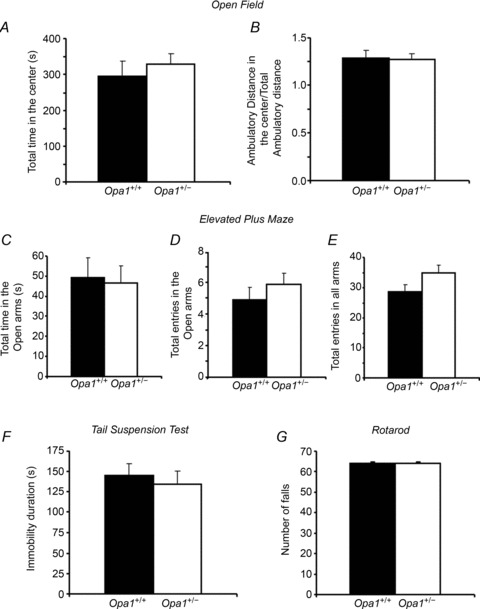
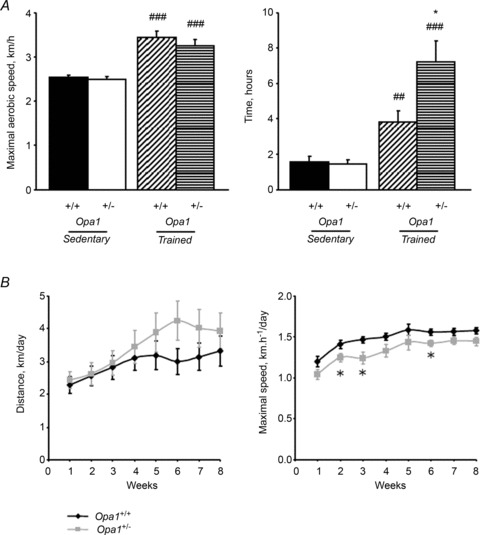
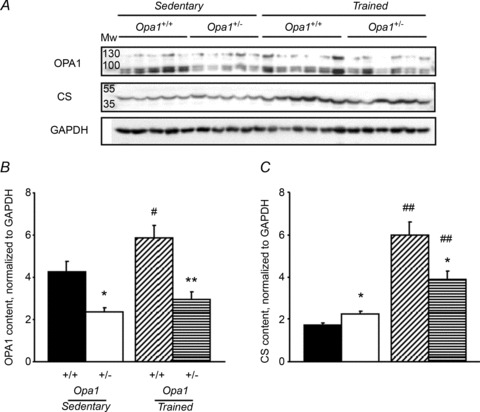
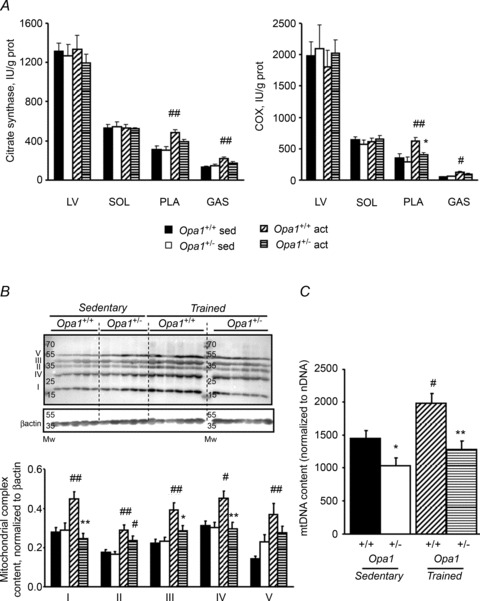
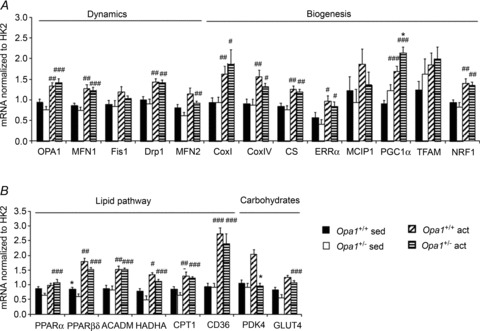
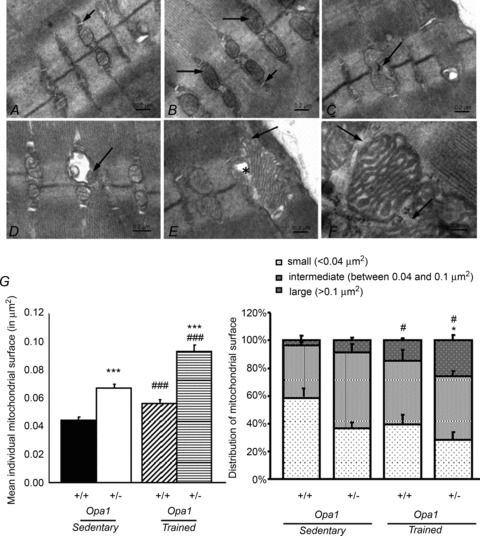
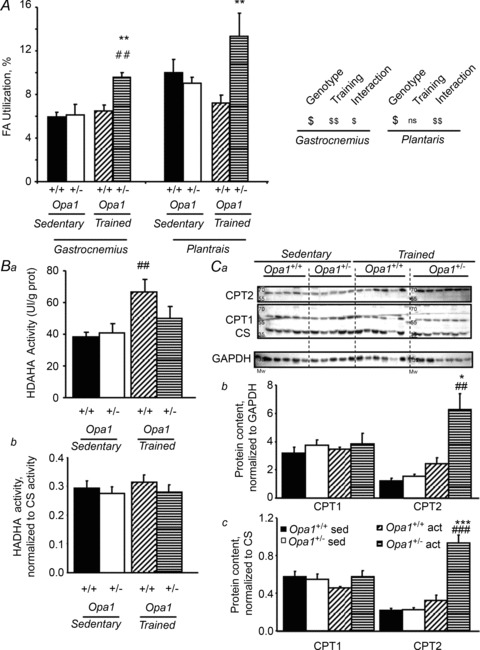
The role of OPA1, a GTPase dynamin protein mainly involved in the fusion of inner mitochondrial membranes, has been studied in many cell types, but only a few studies have been conducted on adult differentiated tissues such as cardiac or skeletal muscle cells. Yet OPA1 is highly expressed in these cells, and could play different roles, especially in response to an environmental stress like exercise. Endurance exercise increases energy demand in skeletal muscle and repeated activity induces mitochondrial biogenesis and activation of fusion-fission cycles for the synthesis of new mitochondria. But currently no study has clearly shown a link between mitochondrial dynamics and biogenesis. Using a mouse model of haploinsufficiency for the Opa1 gene (Opa1(+/-)), we therefore studied the impact of OPA1 deficiency on the adaptation ability of fast skeletal muscles to endurance exercise training. Our results show that, surprisingly, Opa1(+/-) mice were able to perform the same physical activity as control mice. However, the adaptation strategies of both strains after training differed: while in control mice mitochondrial biogenesis was increased as expected, in Opa1(+/-) mice this process was blunted. Instead, training in Opa1(+/-) mice led to an increase in endurance capacity, and a specific adaptive response involving a metabolic remodelling towards enhanced fatty acid utilization. In conclusion, OPA1 appears necessary for the normal adaptive response and mitochondrial biogenesis of skeletal muscle to training. This work opens new perspectives on the role of mitochondrial dynamics in skeletal muscle cells and during adaptation to stress.


Figures

Figure 1
Figure 1. Similar behaviour of Opa1+/+ and Opa1+/− mice
A and B, effects of OPA1 deficiency on anxiety behaviours in the open field test. Anxiety is measured as mean of the total time spent in the centre in seconds (A). Locomotor activity is measured as total ambulatory distance travelled (B). C–E, effects of OPA1 deficiency on anxiety behaviours in the elevated plus maze. Anxiety is expressed as mean total time in the open arms (C), as mean total entries in the open arms (D) and as mean total entries in all arms as an index of their locomotion (E). F, effects of OPA1 deficiency on behaviour in the tail suspension test. Results are expressed as mean of immobility duration (in seconds) as their resignation indices. G, effects of OPA1 deficiency in the rotarod test. The number of falls during accelerating rotarod test as balance capabilities indicator. Values are means ± SEM. Sedentary Opa1+/+ (n= 12) and Opa1+/− (n= 12) 6-month-old animals.
Figure 2
Figure 2. Similar training capacity of Opa1+/+ and Opa1+/− mice but increased endurance performance in trained Opa1+/− mice
A, forced activity of 6-month-old or after 2 months of training Opa1+/− and Opa1+/+ animals expressed as means of maximal running speed (left panel) or running time before exhaustion (right panel). Values are means ± SEM. Significantly different: *P < 0.05, ##P < 0.01, ###P < 0.001. *=Opa1+/− versus Opa1+/+, #= active versus sedentary. Sedentary Opa1+/+ (n= 16), Opa1+/− (n= 15), trained Opa1+/+ (n= 9) and Opa1+/− (n= 7) mice. B, voluntary wheel running capacity of Opa1+/+ (n= 21) and Opa1+/− (n= 20) 6-month-old animals expressed as daily running distance (left panel) or maximal running speed (right panel) over a 8 week period. Values are means ± SEM. *Significantly different from Opa1+/+, P < 0.05.
Figure 3
Figure 3. Decreased expression of mitochondrial proteins following training in Opa1+/− mice
A, original recording of OPA1 and CS protein content. GAPDH was used for normalization. Each lane was loaded with 50 μg of total white gastrocnemius muscle extracts of 8-month-old sedentary or active Opa1+/+ and Opa1+/− mice. B, OPA1 content normalized to GAPDH. C, CS content normalized to GAPDH. Values are means ± SEM. Significant differences: #P < 0.05, ##P < 0.01 trained versus sedentary, *P < 0.05, **P < 0.01. Opa1+/− versus Opa1+/+ for sedentary or trained mice. Sedentary Opa1+/+ (n= 5), Opa1+/− (n= 5), trained Opa1+/+ (n= 6) and Opa1+/− (n= 6) 8-month-old mice.
Figure 4
Figure 4. Mitochondrial protein and mtDNA content following training in Opa1+/− mice
A, citrate synthase (CS) and cytochrome oxidase (COX) activities. Activities were measured spectrophotometrically in left ventricle (LV), soleus (SOL), plantaris (PLA) and white gastrocnemius (GAS) muscles of sedentary and trained mice. B, original recording of subunits of mitochondrial complexes in GAS (upper lane). Proteins were normalized to β-actin (lower lane). C, ratio of mitochondrial to nuclear DNA content. Sedentary Opa1+/+ (n= 5), Opa1+/− (n= 5), trained Opa1+/+ (n= 6), and Opa1+/− (n= 6) 8-month-old mice. Values are means ± SEM. Significant differences: #P < 0.05, ##P < 0.01 trained versus sedentary, *P < 0.05, **P < 0.01 Opa1+/− versus Opa1+/+ for sedentary or trained mice.
Figure 5
Figure 5. Increased mitochondrial biogenesis in white gastrocnemius muscle
A and B, mRNA expression levels of proteins. A, proteins involved in mitochondrial dynamics and biogenesis. B, proteins in glucose and lipid utilization pathways. mRNA levels were normalized to mRNA level of HK2. Values are means ± SEM. Significant differences: *,#P < 0.05, **, ##P < 0.01, ***, ###P < 0.001. *=Opa1+/− versus Opa1+/+,#= active versus sedentary. 6-month-old, 2-month trained.
Figure 6
Figure 6. Altered ultrastructure of trained Opa1+/− white gastrocnemius muscle
A, control mice. Skeletal muscle shows normal mitochondria with abundant cristae, there is absence of ultrastructural changes inside mitochondria. Mitochondria are placed in their para-Z-disc distribution between the myofibrils, small arrow – triad. B–F, Opa1+/− mice. B, the electron micrograph shows slightly dilated mitochondria, some mitochondria deprived of cristae (arrows); small arrow – triad. C, a slightly dilated mitochondrion with regression of cristae and signs of mitochondrial destruction (arrow). D, a vesicular swollen mitochondrion with remnants of matrix compartment (arrow). E, a giant subsarcolemmal mitochondrion showing fragmentation and disappearance of cristae (arrow). The loss of matrix in the mitochondrion is accompanied by the presence of irregular vacuoles (*). F, high magnification of mitochondria with remodelled morphology of cristae, and evidence of disrupted outer mitochondrial membrane (arrows). G, quantification of individual mitochondrial surface in Opa1+/+ and Opa1+/− mice before and after training by analysis of EM white gastrocnemius tissue images. Left panel, average of individual mitochondrial surface estimated on 18 slices per animal (5 different animals for trained and 2 for sedentary animals). Right panel, distribution of individual mitochondrial surface between small (<0.04 μm2), intermediate (between 0.04 and 0.1 μm2) or large (>0.1 μm2) mitochondria. Values are means ± SEM. Significant differences: *,#P < 0.05, ***,###P < 0.001. *= Opa1+/− versus Opa1+/+, #= active versus sedentary.
Figure 7
Figure 7. Increased fatty acid oxidation rates in trained fast skeletal muscles of Opa1+/− mice
A, respiration rates were measured in saponin-permeabilized fibres of white gastrocnemius and plantaris muscles. Fatty acid utilization rate with carnitine and palmitoyl-CoA is expressed relative to maximal respiration rate with FA, pyruvate, glutamate and succinate. Ba, β-hydroxyacyl-CoA dehydrogenase (HADHA) activity measured spectrophotometrically in white gastrocnemius (GAS) muscles of sedentary and trained mice; Bb, same measurement, normalized to CS activity. Ca, original recording of CPT2 and CPT1 protein content. CS and GAPDH content were used for normalization. Quantification of CPT1 and CPT2, normalized to GAPDH (Cb) or CS (Cc). Values are means ± SEM Significantly different: *P < 0.05. **,##P < 0.01. ***,###P < 0.001. *=Opa1+/− versus Opa1+/+, #= trained versus sedentary.

References

    1. Adhihetty PJ, Irrcher I, Joseph AM, Ljubicic V, Hood DA. Plasticity of skeletal muscle mitochondria in response to contractile activity. Exp Physiol. 2003;88:99–107. - PubMed
    1. Agier V, Oliviero P, Laine J, L’Hermitte-Stead C, Girard S, Fillaut S, Jardel C, Bouillaud F, Bulteau AL, Lombes A. Defective mitochondrial fusion, altered respiratory function, and distorted cristae structure in skin fibroblasts with heterozygous OPA1 mutations. Biochim Biophys Acta. 2012;1822:1570–1580. - PubMed
    1. Alavi MV, Bette S, Schimpf S, Schuettauf F, Schraermeyer U, Wehrl HF, Ruttiger L, Beck SC, Tonagel F, Pichler BJ, Knipper M, Peters T, Laufs J, Wissinger B. A splice site mutation in the murine Opa1 gene features pathology of autosomal dominant optic atrophy. Brain. 2007;130:1029–1042. - PubMed
    1. Alavi MV, Fuhrmann N, Nguyen HP, Yu-Wai-Man P, Heiduschka P, Chinnery PF, Wissinger B. Subtle neurological and metabolic abnormalities in an Opa1 mouse model of autosomal dominant optic atrophy. Exp Neurol. 2009;220:404–409. - PubMed
    1. Amati-Bonneau P, Valentino ML, Reynier P, Gallardo ME, Bornstein B, Boissiere A, Campos Y, Rivera H, de la Aleja JG, Carroccia R, Iommarini L, Labauge P, Figarella-Branger D, Marcorelles P, Furby A, Beauvais K, Letournel F, Liguori R, La Morgia C, Montagna P, Liguori M, Zanna C, Rugolo M, Cossarizza A, Wissinger B, Verny C, Schwarzenbacher R, Martin MA, Arenas J, Ayuso C, Garesse R, Lenaers G, Bonneau D, Carelli V. OPA1 mutations induce mitochondrial DNA instability and optic atrophy ‘plus’ phenotypes. Brain. 2008;131:338–351. - PubMed

Publication types

LinkOut - more resources