. 2013 Nov;33(22):4473-91.
doi: 10.1128/MCB.01050-13. Epub 2013 Sep 16.

MEF2 is a converging hub for histone deacetylase 4 and phosphatidylinositol 3-kinase/Akt-induced transformation

Affiliations

MEF2 is a converging hub for histone deacetylase 4 and phosphatidylinositol 3-kinase/Akt-induced transformation

Eros Di Giorgio et al. Mol Cell Biol. 2013 Nov.

Abstract

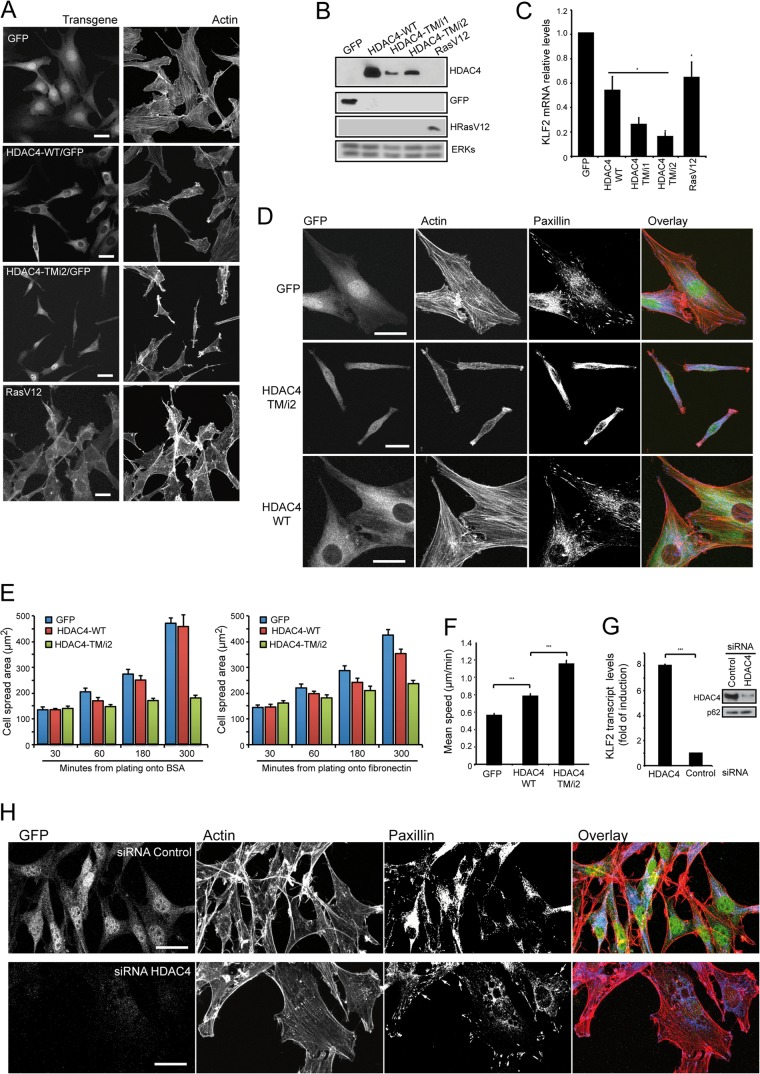
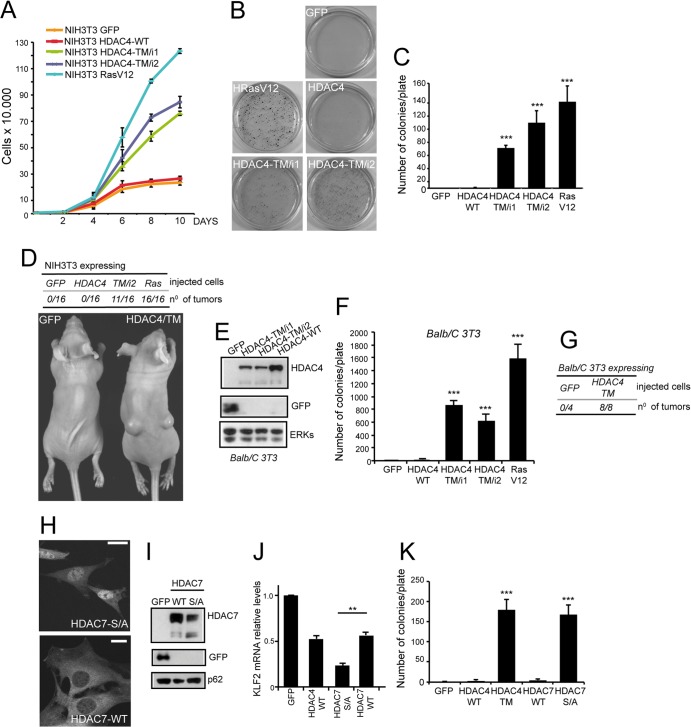
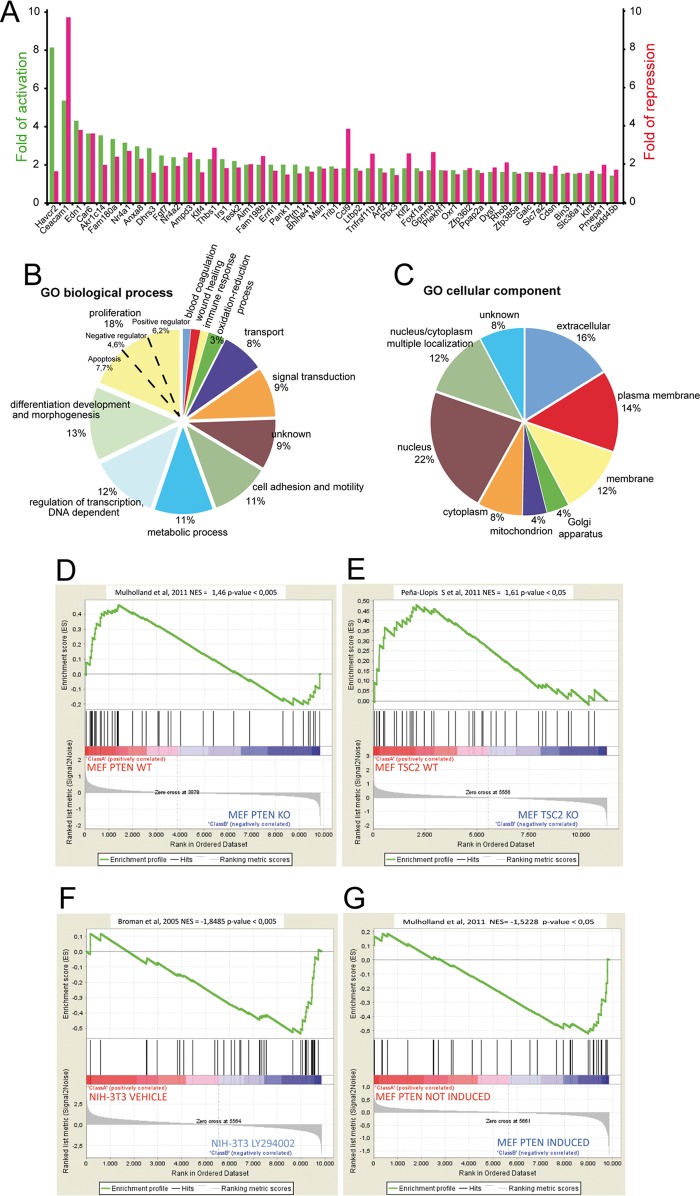
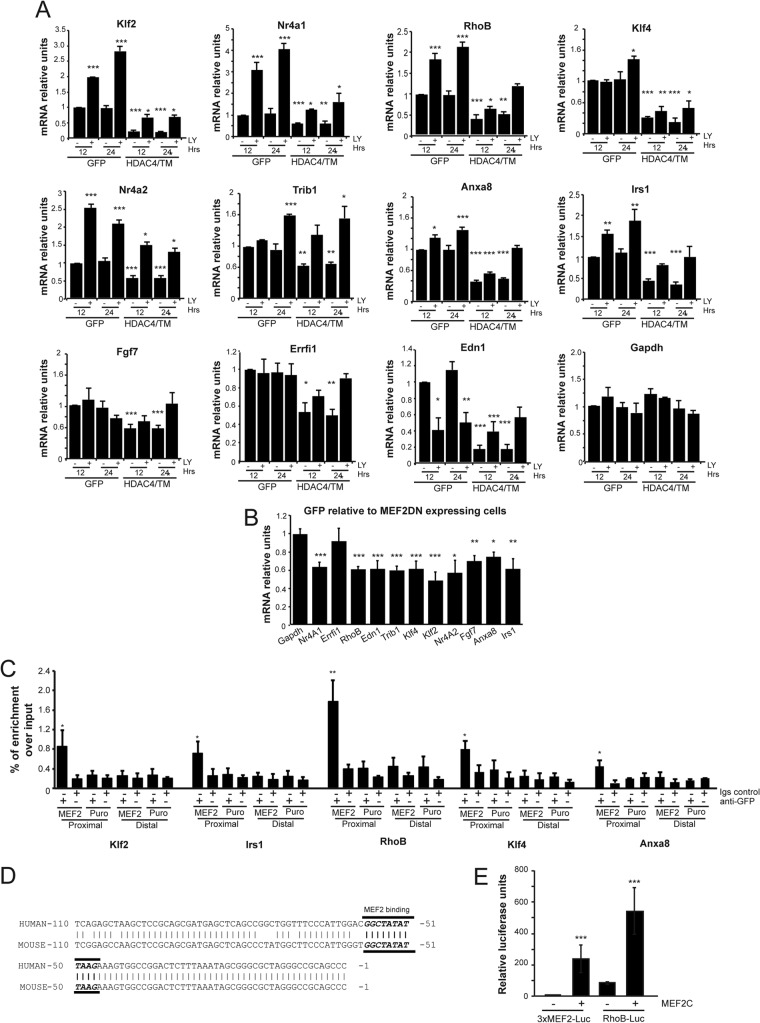
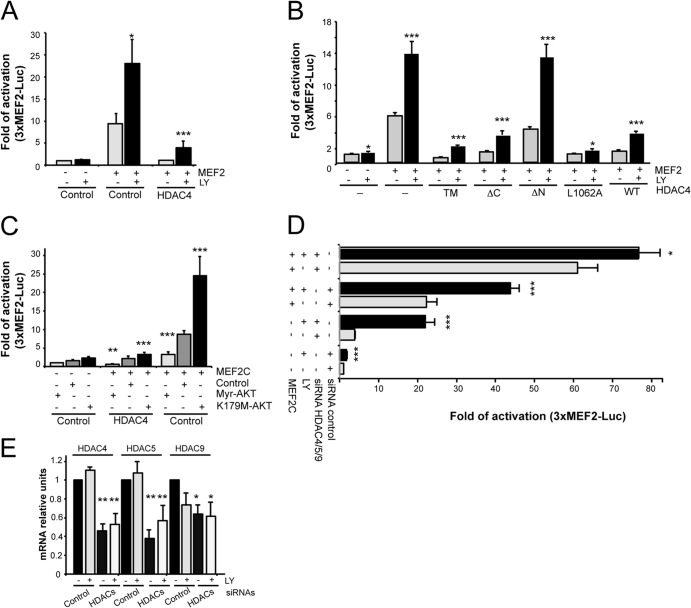
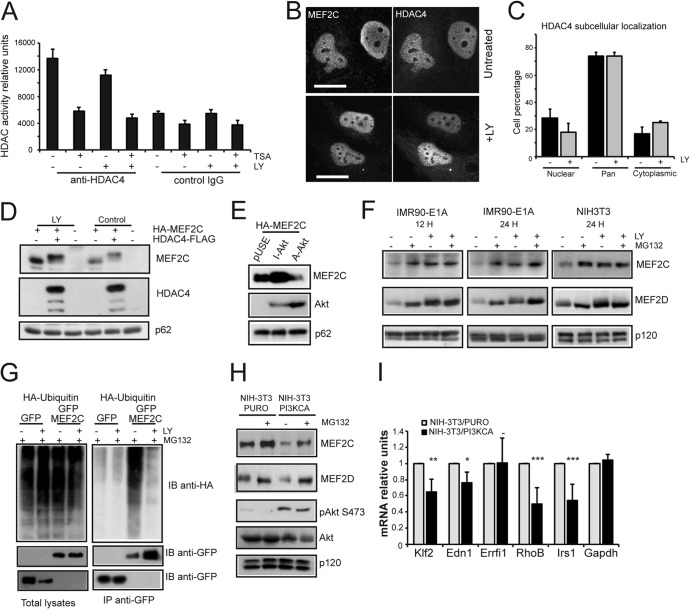
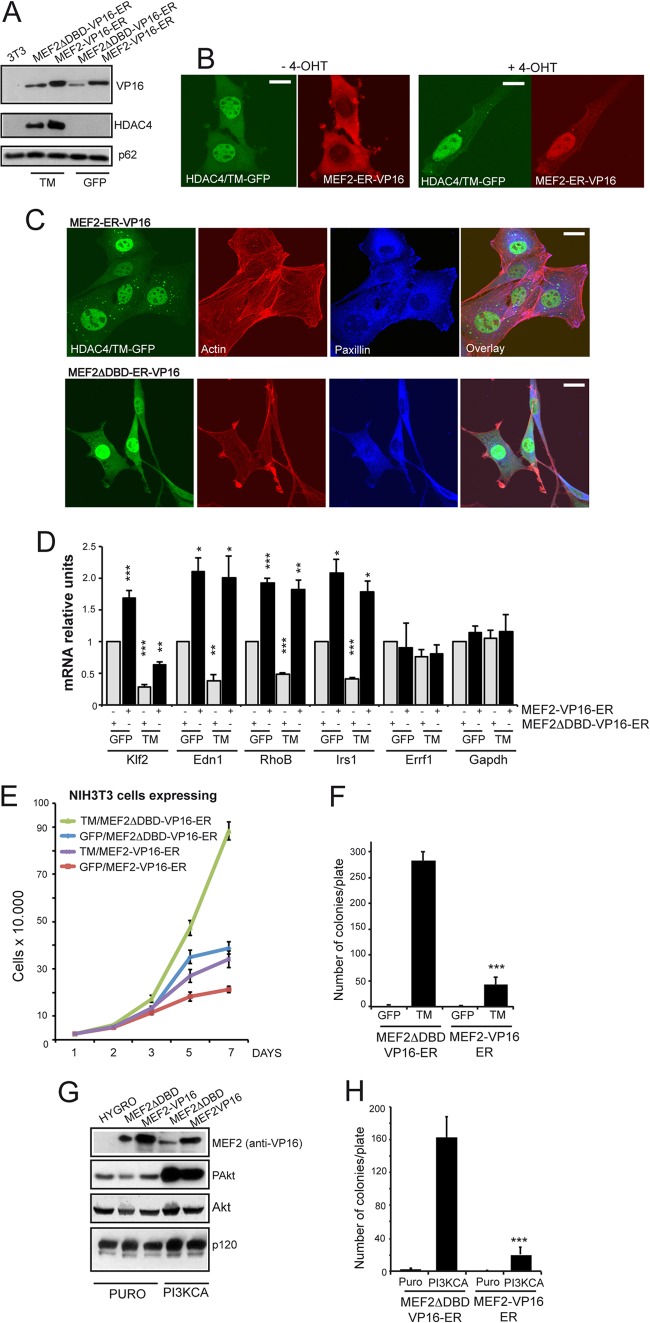
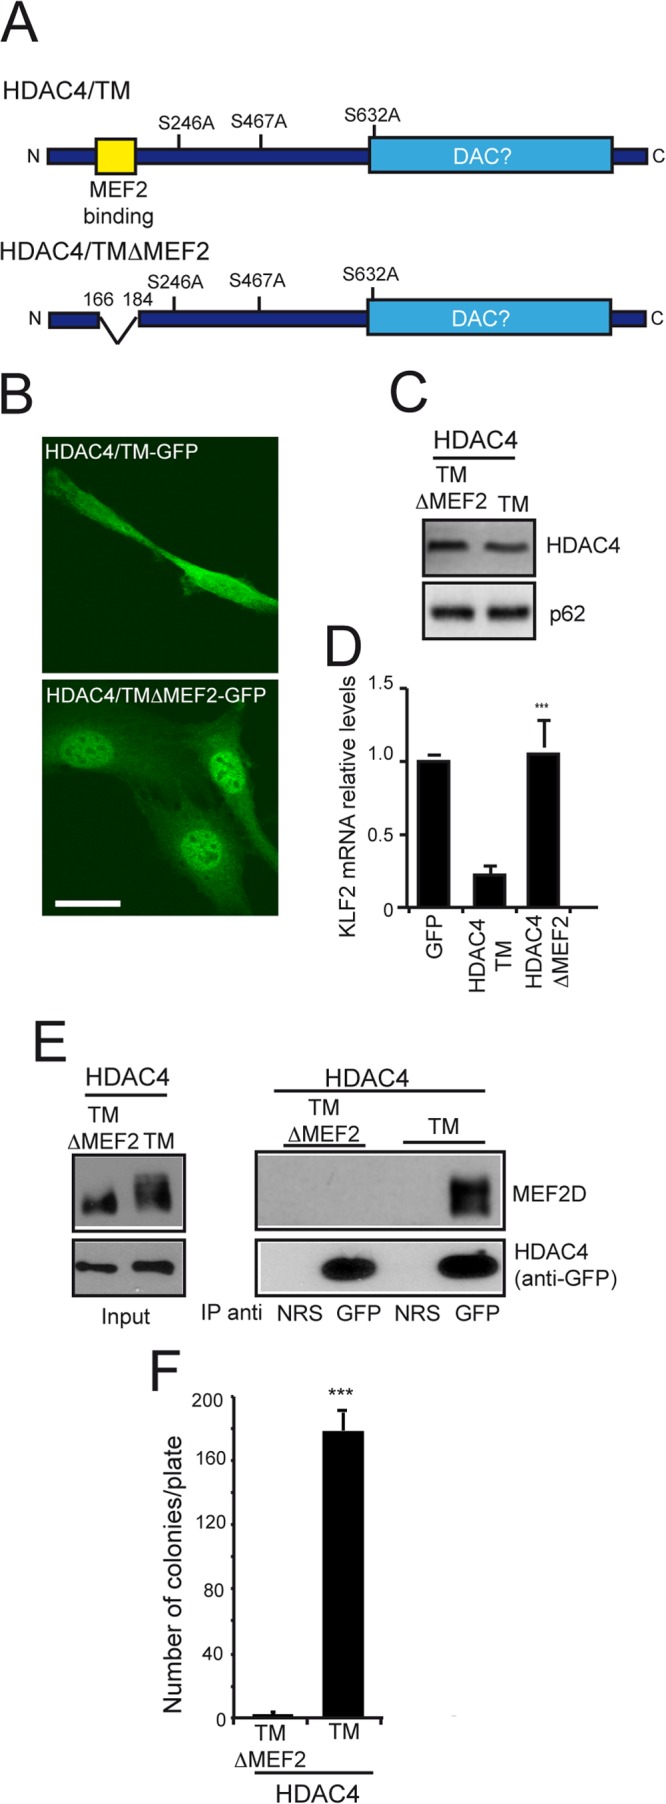
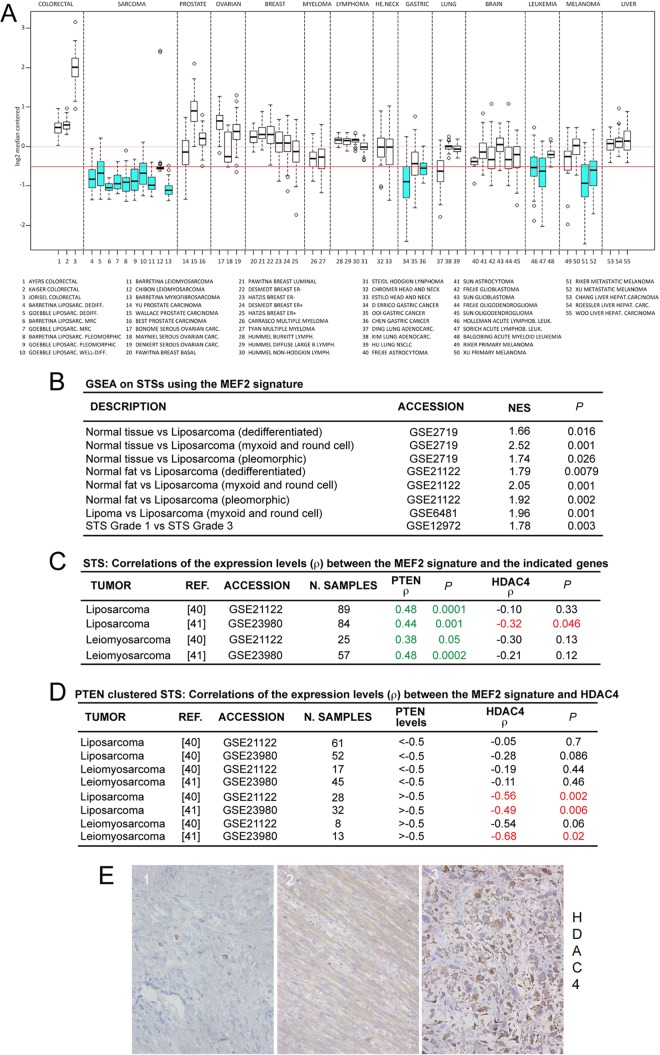
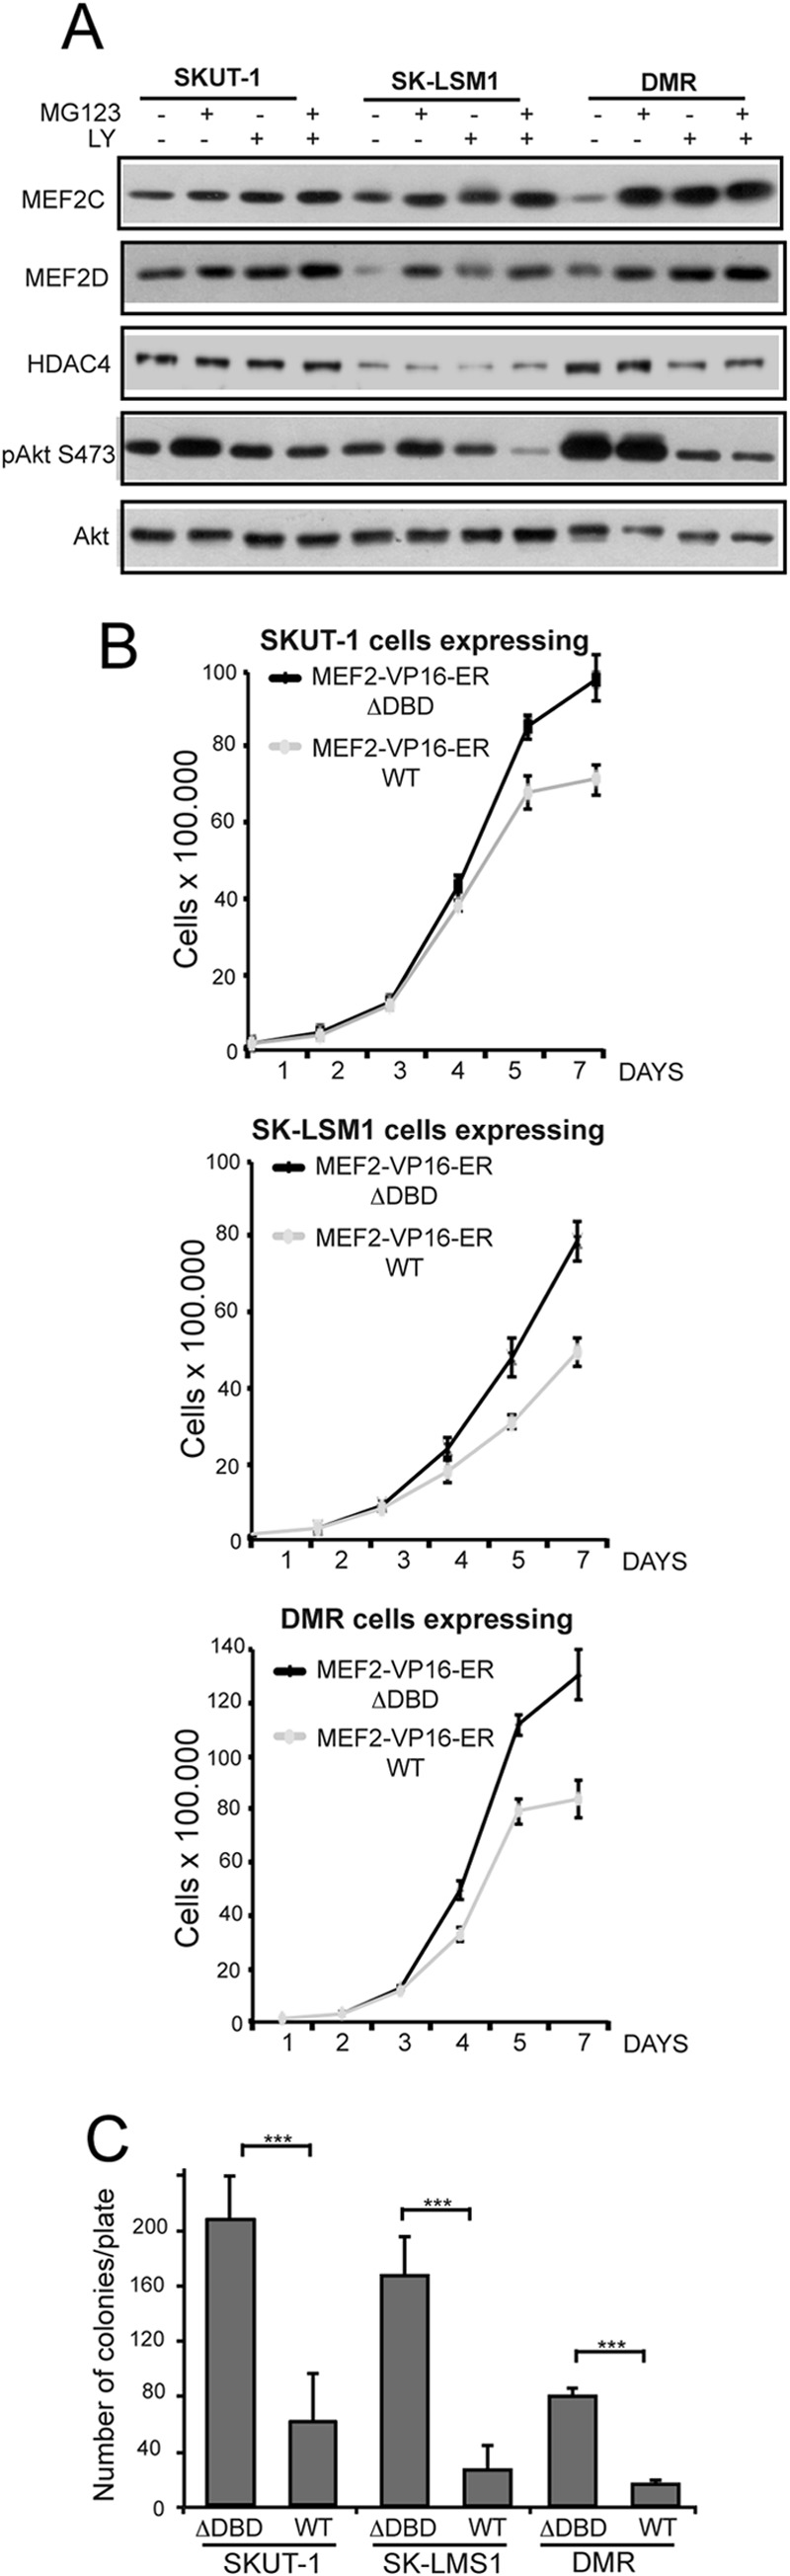
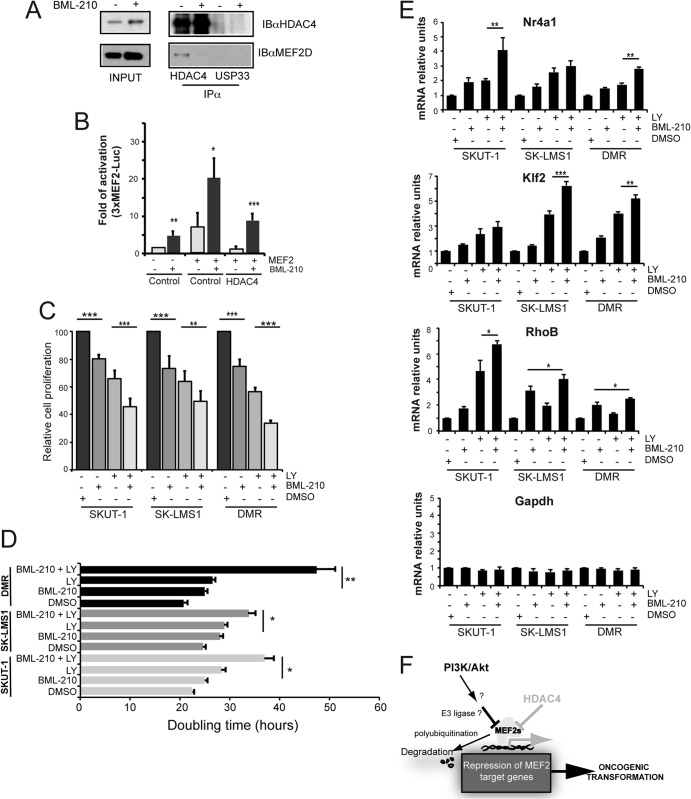
The MEF2-class IIa histone deacetylase (HDAC) axis operates in several differentiation pathways and in numerous adaptive responses. We show here that nuclear active HDAC4 and HDAC7 display transforming capability. HDAC4 oncogenic potential depends on the repression of a limited set of genes, most of which are MEF2 targets. Genes verified as targets of the MEF2-HDAC axis are also under the influence of the phosphatidylinositol 3-kinase (PI3K)/Akt pathway that affects MEF2 protein stability. A signature of MEF2 target genes identified by this study is recurrently repressed in soft tissue sarcomas. Correlation studies depicted two distinct groups of soft tissue sarcomas: one in which MEF2 repression correlates with PTEN downregulation and a second group in which MEF2 repression correlates with HDAC4 levels. Finally, simultaneous pharmacological inhibition of the PI3K/Akt pathway and of MEF2-HDAC interaction shows additive effects on the transcription of MEF2 target genes and on sarcoma cells proliferation. Overall, our work pinpoints an important role of the MEF2-HDAC class IIa axis in tumorigenesis.


Figures

Fig 1
Fig 1
Morphological changes in cells expressing HDAC4/TM. (A) Confocal pictures of NIH 3T3 cells expressing GFP and the different chimeras. Immunofluorescence analysis was performed to visualize HRasV12. AF546-phalloidin was used to decorate F-actin. Scale bar, 50 μm. (B) Immunoblot assays were performed to visualize the different transgenes. The antibodies used were anti-GFP to detect GFP and HDAC4-GFP, anti-HRas, and anti-Erks as a loading control. (C) qRT-PCR analysis was performed to quantify mRNAs levels of the HDAC4-target gene, Klf2. Gapdh was used as a control gene. The Klf2 mRNA levels were relative to GFP-expressing cells. (D) Confocal pictures of cells expressing GFP, GFP-HDAC4/WT, and GFP-HDAC4/TMi2. Immunofluorescence analysis was performed to visualize paxillin subcellular localization. AF546-phalloidin was used to decorate F-actin. Scale bar, 50 μm. (E) NIH 3T3 cells expressing HDAC4/WT, HDAC4/TMi2, or GFP were plated onto BSA- or fibronectin-covered dishes and subjected to time-lapse analysis for the indicated times. The data are presented as the average areas. (F) At 24 h after seeding, NIH 3T3 cells expressing HDAC4/WT, HDAC4/TMi2, or GFP were subjected to time-lapse analysis for 6 h. The data are presented as the average migration rates. (G) qRT-PCR analysis was performed to quantify Klf2 mRNAs after the transfection of cells expressing HDAC4/TMi2 with siRNA against HDAC4 or control siRNA. Klf2 mRNA levels were relative to GFP-expressing cells. Immunoblotting was performed with anti-GFP antibodies to prove the siRNA efficiency. (H) Confocal pictures of cells expressing HDAC4/TMi2 transfected with siRNAs against HDAC4 or control siRNA. Immunofluorescence analysis was performed as described in panel D. Scale bar, 50 μm. *, P < 0.05; ***, P < 0.001.
Fig 2
Fig 2
Transforming ability of HDAC4/TM. (A) NIH 3T3 cells expressing the indicated transgenes were grown in DMEM supplemented with 10% FBS. (B) Growth in soft agar of NIH 3T3 expressing the indicated transgenes, foci were stained with MTT. (C) Quantitative results of colony formation. (D) Analysis of the tumorigenic properties of NIH 3T3 cells expressing the indicated genes when injected into immunocompromised nude mice. HDAC4/TM-expressing cells generate tumors, with nodules becoming palpable ∼20 days later compared to HRasV12-transformed cells. Pictures were obtained at week 6. (E) Immunoblot assays were performed to visualize the different transgenes expressed in the BALB/c 3T3 cell lines. The antibodies used were anti-GFP to detect GFP and HDAC4-GFP. Anti-Erks antibody was used as a loading control. (F) Quantitative results of colony formation in soft agar of BALB/c cells expressing the indicated transgenes. (G) Analysis of the tumorigenic properties of BALB/c 3T3 cells expressing the indicated genes when injected into immunocompromised nude mice. (H) Confocal pictures of NIH 3T3 cells expressing GFP chimeras of HDAC7-WT and a mutant defective in the four serine binding sites for 14-3-3 proteins (HDAC7-S/A). Scale bar, 50 μm. (I) Immunoblot assays were performed to visualize the different transgenes expressed in the NIH 3T3 cell lines. The antibodies used were anti-GFP to detect GFP, HDAC7-WT, and HDAC7-S/A. Anti-p62 antibody was used as a loading control. (J) qRT-PCR analysis was performed to quantify mRNAs levels of Klf2. Gapdh was used as control gene. Klf2 mRNA levels were relative to GFP-expressing cells. (K) Quantitative results of colony formation in soft agar of NIH 3T3 cells expressing the indicated transgenes. **, P < 0.01; ***, P < 0.001.
Fig 3
Fig 3
Identification of genes repressed by HDAC4/TM. (A) Diagram representation of the HDAC4/TM target genes. Microarray analyses were performed on GFP- and HDAC4/TM-expressing cells (repressed genes are indicated in red) and in HDAC4/TM cells transfected with control siRNA and the same cells transfected with a siRNA against human HDAC4 (induced genes are indicated in green). (B) Gene ontology (GO) analysis using the PANTHER database was performed to interpret the biological processes under the regulation of the 47 genes repressed by HDAC4. (C) GO analysis using the PANTHER database was performed to classify the 47 genes repressed by HDAC4 in terms of subcellular localization. (D to G) GSEA plots show the enrichment of HDAC4-repressed genes among protein coding genes ranked according to PTEN and TSC2 status and the fold change in LY-treated cells versus control cells. See Materials and Methods for details.
Fig 4
Fig 4
Several HDAC4-repressed genes are MEF2 targets. (A) The mRNA expression levels for 11 HDAC4 target genes and Gapdh, as a control, were measured using qRT-PCR in GFP- and HDAC4/TM-expressing cells. Cells were also treated with LY for 12 or 24 h. The mRNA levels were relative to untreated GFP-expressing cells. (B) The mRNA expression levels of 11 HDAC4 target genes were measured using qRT-PCR in GFP- and MEF2DN-expressing cells. (C) Chromatin immunoprecipitation of NIH 3T3 cells overexpressing MEF2-GFP or control Puro. Chromatin was immunoprecipitated with anti-GFP antibody or anti-USP33 (2 μg) as a control. For each of the genes examined, we compared the fold enrichment over input (1/100) between the proximal (1 to 1,000 bp) and the distal (>3,000 bp) promoters, as indicated. (D) Nucleotide sequence analysis of the human and mouse RhoB proximal promoters. The putative MEF2 binding site is underlined. (E) Relative luciferase activity after cotransfection in IMR90-E1A cells of the reporter plasmids pRhoB-Luc (−300/−1) and p3×MEF2-luc, together with MEF2C, as indicated. The Renilla luciferase plasmid was used as an internal control. *, P < 0.05; **, P < 0.01; ***, P < 0.001.
Fig 5
Fig 5
Regulation of the MEF2-dependent transcription by the PI3K/Akt pathway. (A) IMR90-E1A cells were transfected with the 3×MEF2-Luc (1 μg), the internal control pRL-CMV (20 ng), pcDNA3.1-HA-MEF2C (1 μg), and 300 ng of pEGFP expressing HDAC4. Cells were treated or not for 24 h with LY. (B) IMR90-E1A cells were transfected as in panel A, together with the indicated HDAC4 mutants. Cells were treated or not for 24 h with LY. (C) IMR90-E1A cells were transfected with the 3×MEF2-Luc (1 μg), the internal control pRL-CMV (20 ng), pcDNA3.1-HA-MEF2C (1 μg), and 1 μg of pUSE vectors expressing Myr-Akt or its catalytically inactive point mutant K179M. (D) IMR90-E1A cells transfected with siRNAs against HDAC4, HDAC5, and HDAC9 or with the same amount of a control siRNA were cotransfected after 12 h with 3×MEF2-Luc (1 μg), the internal control pRL-CMV (20 ng), and eventually pcDNA3.1-HA-MEF2C (1 μg), as indicated. After 12 h, the cells were split into two plates and treated or not for 24 h with LY. (E) qRT-PCR analysis was performed to quantify the mRNA levels of HDAC4, HDAC5, and HDAC9 in IMR90-E1A cells, cotransfected with the indicated siRNAs. GAPDH was used as a control gene. *, P < 0.05; **, P < 0.01; ***, P < 0.001.
Fig 6
Fig 6
The PI3K/Akt pathway influences MEF2 protein stability. (A) HDAC4 was immunoprecipitated from NIH 3T3 cells treated or not for 18 h with LY. The HDAC activity was measured 15 min after the addition of the developer. (B) Confocal pictures of IMR90-E1A cells transfected with pcDNA3.1-HA-MEF2C (1 μg) and pEGFPN1-HDAC4 (300 ng) and treated or not with LY for 24 h. Immunofluorescence analysis was performed to visualize HDAC4 and MEF2C subcellular localization. Scale bar, 50 μm. (C) Quantification of endogenous HDAC4 subcellular localization in IMR90-E1A cells after the treatment with LY or DMSO for 24 h. For each experiment, at least 200 cells were counted (n = 3). (D) IMR90-E1A cells were transfected with pcDNA3.1-HA-MEF2C (1 μg), and 300 ng of pEGFP expressing HDAC4, as indicated. After 12 h, cells were harvested, split into two plates and treated with the PI3K inhibitor LY. After 24 h, cellular lysates were generated and subjected to immunoblot analysis using the anti-GFP and the anti-HA antibodies. Nucleoporin (p62) was used as loading control. (E) IMR90-E1A cells were transfected with pcDNA3.1-HA-MEF2C (1 μg), and 1 μg of pUSE vectors expressing Myr-Akt or its catalytically inactive point mutant K179M. After 24 h, cellular lysates were generated and subjected to immunoblot analysis with the anti-Akt and the anti-HA antibodies. Nucleoporin (p62) was used as loading control. (F) Immunoblot analysis of MEF2 family members in IMR90-E1A and NIH 3T3 cells treated with LY and the proteasome inhibitor MG132 as indicated. p120 was used as loading control. (G) IMR90-E1A cells were cotransfected with HA-ubiquitin and MEF2C-GFP or GFP. After 24 h, the cells were treated or not for 12 h with LY, followed by 12 h with MG132. GFP fusions were immunoprecipitated with an antibody to GFP and subjected to immunoblotting with an antiubiquitin antibody. After being stripped, the filter was probed with an anti-GFP antibody. Inputs have been included. (H) Immunoblot analysis of MEF2C and MEF2D levels in NIH 3T3 cells expressing the catalytically active PI3K (PI3KCA) treated with MG132 as indicated. Cellular lysates were generated and subjected to immunoblot analysis with the specific antibodies. The Akt phosphorylation levels were also probed. p120 was used as a loading control. (I) mRNA expression levels of selected MEF2-HDAC4 target genes and Gapdh, as a control, were measured using qRT-PCR in NIH 3T3 cells expressing PI3KCA or Puro. Samples were normalized to HPRT, GAPDH, and β-actin. *, P < 0.05; **, P < 0.01; ***, P < 0.001.
Fig 7
Fig 7
MEF2 transcriptional activation can revert the oncogenic phenotype. (A) Immunoblot analysis of MEF2-VP16-ER levels in NIH 3T3 cells expressing GFP or HDAC4-TM/GFP or control vector (Hygro-Puro). MEF2-VP16-ER-dependent transcription was induced by treating cells with 4-OHT for 24 h. Cellular lysates were generated and subjected to immunoblot analysis with anti-VP16 or anti-GFP antibodies. p62 (nucleoporin) was used as loading control. (B) Confocal pictures showing MEF2-ER-VP16 nuclear accumulation after the induction with 4-OHT in NIH 3T3 HDAC4/TM cells (Hygro) stably expressing MEF2-VP16-ER (Puro). Immunofluorescence analyses to visualize MEF2-VP16-ER subcellular localization were performed with an anti-VP16 antibody. Scale bar, 50 μm. (C) Confocal pictures of HDAC4/TM cells expressing MEF2-ER-VP16 chimera or its mutant defective in DNA binding MEF2ΔDBD-ER-VP16 grown in the presence of 4-OHT. Immunofluorescence analysis was performed to visualize HDAC4 and paxillin subcellular localizations. AF546-phalloidin was used to decorate F-actin. Scale bar, 50 μm. (D) mRNA expression levels of selected MEF2-HDAC4 target genes and Gapdh, as a control, were measured by using qRT-PCR in HDAC4/TM cells expressing MEF2-ER-VP16 or the mutant MEF2ΔDBD-ER-VP16. (E) HDAC4/TM cells were grown in DMEM supplemented with 10% FBS. The day after seeding, 4-OHT was added. (F) Quantitative results of colony formation in soft agar of NIH 3T3 cells expressing GFP or HDAC4/TM and the two MEF2 forms. The day after seeding, 4-OHT was added to culture medium. (G) Immunoblot analysis of MEF2-VP16-ER and MEF2ΔDBD-VP16-ER levels in NIH 3T3 cells expressing PI3KCA or the control vector (Puro). MEF2-dependent transcription was induced by treating cells with 4-OHT for 24 h. Cellular lysates were generated and subjected to immunoblot analysis with anti-VP16 or the indicated antibodies to monitor PI3K activation. p120 was used as a loading control. (H) Quantitative results of colony formation in soft agar of NIH 3T3 cells expressing Puro or PI3KCA and the two MEF2 forms. The day after seeding, 4-OHT was added to the culture medium. *, P < 0.05; **, P < 0.01; ***, P < 0.001.
Fig 8
Fig 8
HDAC4/TM defective in MEF2 binding loses its transforming activity. (A) Scheme of HDAC4/TM highlighting the deacetylase domain and the region involved in MEF2 binding. The deletion mutant generated for the present study is also illustrated. (B) Confocal pictures of NIH 3T3 cells expressing HDAC4/TM-GFP or its deleted version for MEF2 binding. Scale bar, 50 μm. (C) Immunoblot analysis of HDAC4/TM and HDAC4/TM/ΔMEF2 levels in NIH 3T3 cells. Immunoblot analysis was performed with anti-GFP antibodies. p62 (nucleoporin) was used as a loading control. (D) qRT-PCR analysis was performed to quantify mRNAs levels of the HDAC4 target gene, Klf2. Gapdh was used as a control gene. KLF2 mRNA levels were relative to GFP-expressing cells. (E) Cellular lysates from NIH 3T3 cells expressing HDAC4/TM and HDAC4/TM/ΔMEF2 were immunoprecipitated with an anti-GFP antibody. Immunoblots were performed with anti-MEF2D and anti-GFP antibodies. NRS, normal rabbit serum. (F) Quantitative results of colony formation in soft agar of NIH 3T3 cells expressing the indicated transgenes. ***, P < 0.001.
Fig 9
Fig 9
Expression of the MEF2 target genes in human tumors. (A) Box plots depicted in light-blue mark tumors where the MEF2 signature is significantly below zero and with at least the 50% of the values below an arbitrary threshold of −0.5. Significance was calculated by using the Poisson test (Holm-Bonferroni correction, P < 0.05). (B) GSEA on STSs, using the MEF2 signature as a gene set. (C) Expression level correlations between the MEF2 signature and HDAC4 or PTEN in three different types of STSs. Statistically significant correlations are indicated in green, whereas statistically significant inverse correlations are indicated in red. (D) Expression level correlations between MEF2 signature and HDAC4 in different types of STS subdivided into two subclasses according to the expression of PTEN. Log2(PTEN) of −0.5 was selected as the cutoff to identify the two populations. Statistically significant inverse correlations are shown in red. (E) Immunohistochemical analysis of HDAC4 expression in leiomyosarcoma. HDAC4 showed absent E1 (few positive inflammatory cells are present), low pan/cytoplasmic expression E2, or increased expression and nuclear localization E3.
Fig 10
Fig 10
Regulation and functions of MEF2s in human sarcoma cells. (A) Immunoblot analysis of MEF2C and MEF2D levels in human sarcoma cell lines treated or not with LY. Cellular lysates were generated and subjected to immunoblot analysis with the indicated antibodies. (B) Human sarcoma cells expressing MEF2-VP16-ER or MEF2ΔDBD-VP16-ER were grown in DMEM supplemented with 10% FBS. The day after seeding, 4-OHT was added to culture medium. (C) Quantitative results of colony formation in soft agar of human sarcoma cells expressing MEF2-VP16-ER or MEF2ΔDBD-VP16-ER. The day after seeding, 4-OHT was added to culture medium. ***, P < 0.001.
Fig 11
Fig 11
Pharmacological targeting of MEF2-HDAC axis and PI3K/Akt pathway. (A) Cellular lysates from IMR90-E1A cells treated or not for 36 h with BML-210 were immunoprecipitated with an anti-HDAC4 antibody. Immunoblots were performed with the anti-MEF2D and anti-HDAC4 antibodies. (B) IMR90-E1A cells were transfected as described in Fig. 5A. After 12 h, the cells were treated or not with BML-210 for 36 h. (C) Human sarcoma cells were seeded in 96-well and treated for 48 h with LY and/or BML-210. The proliferative rate was scored by using a resazurin assay. (D) Doubling time (DB) of human sarcoma cells (5 × 10⁴) treated as in panel C. The DB was calculated according to the following formula: DB = (t2t1)·[log2/log(q2/q1)], where t2 is time 2, t1 is time 1, q1 is the number cells at t1, and q2 is the number of cells at t2. (E) mRNA expression levels of selected MEF2-HDAC4 target genes and Gapdh, as a control, were measured using qRT-PCR in human sarcoma cells treated for 36 h as in panel C. (F) Model representing the two different actions of PI3K/Akt signaling and of HDAC4 on MEF2-dependent transcription. *, P < 0.05; **, P < 0.01; ***, P < 0.001.

Similar articles

Cited by

References

    1. Martin M, Kettmann R, Dequiedt F. 2007. Class IIa histone deacetylases: regulating the regulators. Oncogene 26:5450–5467 - PubMed
    1. Haberland M, Montgomery RL, Olson EN. 2009. The many roles of histone deacetylases in development and physiology: implications for disease and therapy. Nat. Rev. Genet. 10:32–42 - PMC - PubMed
    1. Fischle W, Dequiedt F, Hendzel MJ, Guenther MG, Lazar MA, Voelter W, Verdin E. 2002. Enzymatic activity associated with class II HDACs is dependent on a multiprotein complex containing HDAC3 and SMRT/N-CoR. Mol. Cell 9:45–57 - PubMed
    1. Lahm A, Paolini C, Pallaoro M, Nardi MC, Jones P, Neddermann P, Sambucini S, Bottomley MJ, Lo Surdo P, Carfí A, Koch U, De Francesco R, Steinkühler C, Gallinari P. 2007. Unraveling the hidden catalytic activity of vertebrate class IIa histone deacetylases. Proc. Natl. Acad. Sci. U. S. A. 104:17335–17340 - PMC - PubMed
    1. Yang XJ, Seto E. 2008. The Rpd3/Hda1 family of lysine deacetylases: from bacteria and yeast to mice and men. Nat. Rev. Mol. Cell. Biol. 9:206–218 - PMC - PubMed

Publication types

MeSH terms

LinkOut - more resources