. 2013 Nov;33(22):4552-61.
doi: 10.1128/MCB.00087-13. Epub 2013 Sep 16.

SIRT4 represses peroxisome proliferator-activated receptor α activity to suppress hepatic fat oxidation

Affiliations

SIRT4 represses peroxisome proliferator-activated receptor α activity to suppress hepatic fat oxidation

Gaëlle Laurent et al. Mol Cell Biol. 2013 Nov.

Abstract

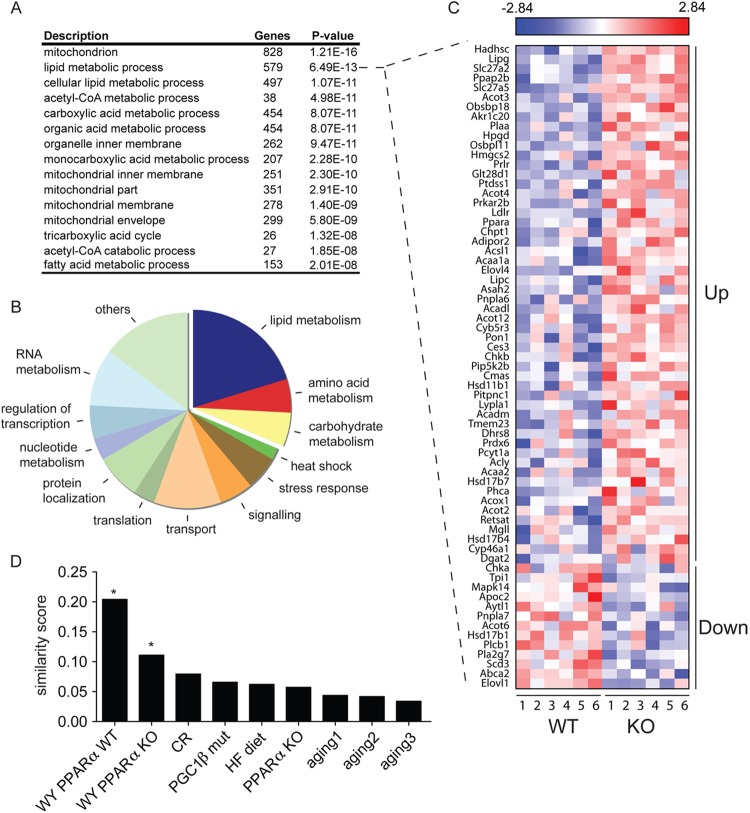
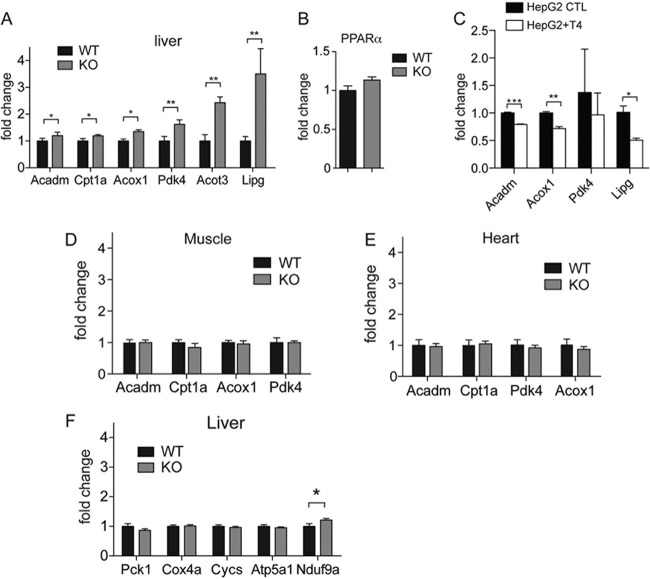
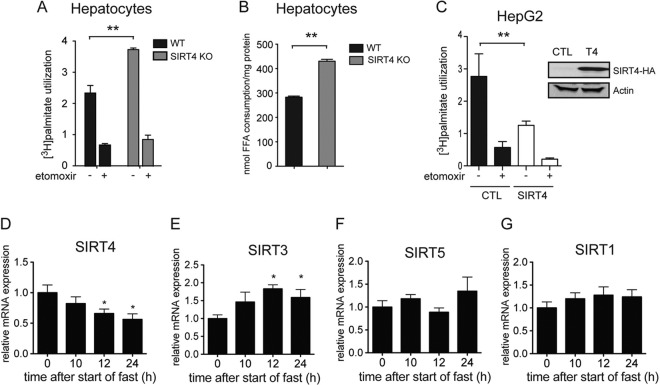
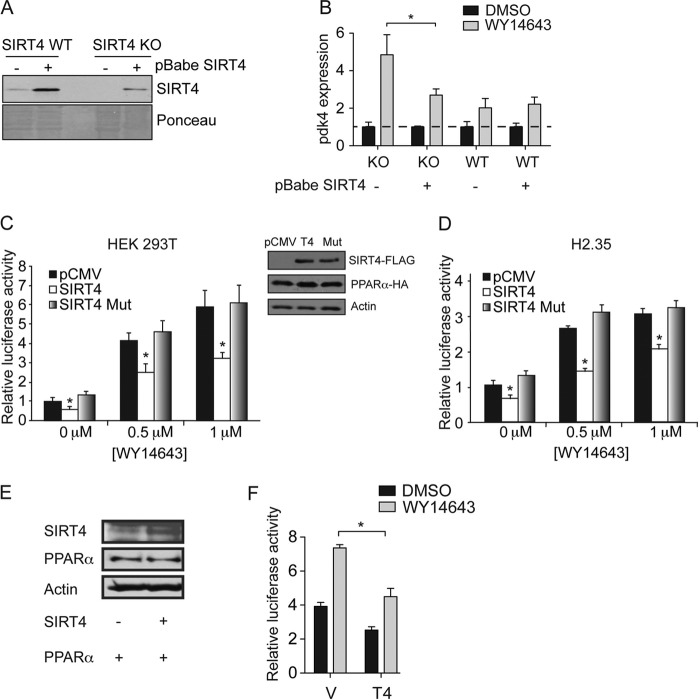
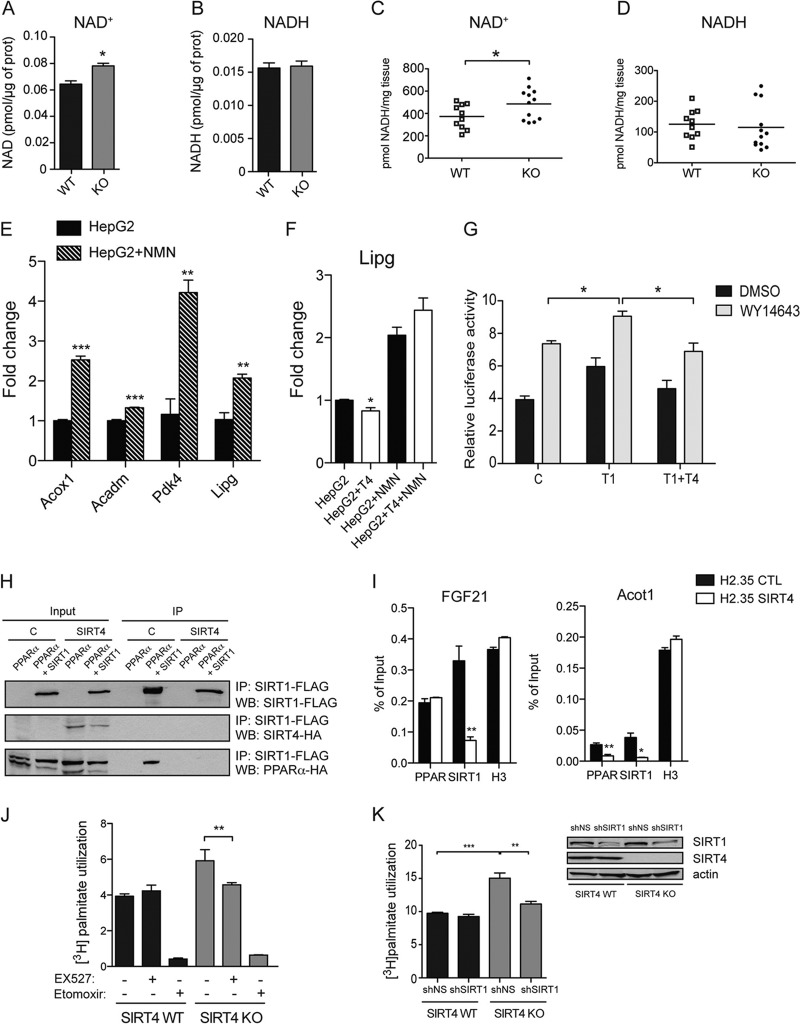
Sirtuins are a family of protein deacetylases, deacylases, and ADP-ribosyltransferases that regulate life span, control the onset of numerous age-associated diseases, and mediate metabolic homeostasis. We have uncovered a novel role for the mitochondrial sirtuin SIRT4 in the regulation of hepatic lipid metabolism during changes in nutrient availability. We show that SIRT4 levels decrease in the liver during fasting and that SIRT4 null mice display increased expression of hepatic peroxisome proliferator-activated receptor α (PPARα) target genes associated with fatty acid catabolism. Accordingly, primary hepatocytes from SIRT4 knockout (KO) mice exhibit higher rates of fatty acid oxidation than wild-type hepatocytes, and SIRT4 overexpression decreases fatty acid oxidation rates. The enhanced fatty acid oxidation observed in SIRT4 KO hepatocytes requires functional SIRT1, demonstrating a clear cross talk between mitochondrial and nuclear sirtuins. Thus, SIRT4 is a new component of mitochondrial signaling in the liver and functions as an important regulator of lipid metabolism.


Figures

Fig 1
Fig 1
SIRT4 loss enhances hepatic lipid catabolic gene expression. (A) Gene ontology terms overrepresented in the gene expression profile of SIRT4 KO mouse livers (n = 6 per genotype). Microarray data were analyzed using dChIP, and expression profiles were analyzed for overrepresentation using ErmineJ. Shown are the top significantly overrepresented 15 gene ontology terms (out of 58; P < 0.001), taking into account multiple testing using Benjamini-Hochberg. (B) Classification of pathways and metabolic processes of all annotated differentially expressed genes with a P value of <0.01. (C) Relative expression of genes (P < 0.1) associated with the GO term lipid metabolic process. SIRT4 KO and SIRT4 WT liver expression profiles are represented in a heat map. Genes are ordered according to direction of regulation and P value. (D) Similarity between SIRT4 KO liver transcriptome and published liver transcriptomes from Gene Expression Omnibus (GEO) and ArrayExpress. WY PPARα WT, WT mice treated for 5 days with WY14643 (GSE8295); WY PPARα KO, PPARα KO mice treated for 5 days with WY14643 (GSE8295); PPARα KO, WT versus PPARα KO mice (GSE8295); CR, long-term caloric restriction mice compared with mice on a control diet (GSE2431); PGC-1β mut, PGC-1β hypomorph mutant mice versus WT mice (GSE6210); HF diet, WT mice under a high-fat diet; aging1, 22- versus 4-month-old WT Snell dwarf mice (GSE3129); aging2, 22- versus 4-month-old WT Ames dwarf mice (GSE3150); aging3, 130- versus 13-week-old WT mice (ArrayExpress experiment E-MEXP-1504). Significance was calculated using permutation. *, P < 0.0001.
Fig 2
Fig 2
PPARα target genes are upregulated in the liver of SIRT4 KO mice. Quantitative real-time PCR of PPARα target genes (33) in SIRT4 KO and SIRT4 WT livers. (A and B) Expression of PPARα and its target genes in SIRT4 KO and WT livers. (C) Expression of PPARα target genes in HepG2 control cells (HepG2 CTL) and HepG2 cells overexpressing SIRT4 (HepG2+T4). (D and E) Expression of PPARα target genes in muscle and heart. (F) Expression of mitochondrial genes in SIRT4 WT and KO livers. Target gene expression is represented relative to the expression of reference genes for beta-2-microglobulin (B2m) and ribosomal protein 16 (Rps16) genes. Experiments were performed in mice fasted for 16 h (n = 6 per genotype). Data are represented as mean ± standard errors of the means (*, P < 0.05; **, P < 0.01; ***, P < 0.001).
Fig 3
Fig 3
SIRT4 expression is regulated by nutritional state repressing fatty acid oxidation in the fed state. (A) Palmitate oxidation rates in SIRT4 KO primary hepatocytes are higher than in SIRT4 WT primary cells. Treatment with etomoxir, a fatty acid oxidation inhibitor, was used as a control. (B) Consumption of palmitate from culture medium in SIRT4 KO and WT primary hepatocytes. (C) Oxidation of [3H]palmitate (nmol of [3H]palmitate/h/mg protein) from hepatocyte cell line HepG2 stably overexpressing SIRT4 and a control cell line. Data represent means ± standard errors of the means (n = 6 per genotype; **, P < 0.01). (D to G) Relative hepatic mRNA expression levels of Sirt4, Sirt3, Sirt5, and Sirt1 at 0, 10, 12, and 24 h after start of the fast. Expression of target genes was normalized to beta-2-microglobulin (B2m), peptidyl-prolyl isomerase (Ppia), and ribosomal protein 16 (Rps16) genes. Experiments were performed in 4-month-old 129/Sv males. Data are presented as means ± standard errors of the means (n = 4; *, P < 0.05).
Fig 4
Fig 4
SIRT4 loss induces mitochondrion enlargement and decreases the number of mitochondria in the periportal zone of the liver. (A) Representative images of periportal and pericentral zone in SIRT4 WT and KO liver. M, mitochondria; L, lipid droplet; N, nucleus. The arrows point to elongated mitochondria. (B to D) Quantification of mitochondrial number (B), length (C), and width (D) in periportal and pericentral zones of the liver in SIRT4 WT and KO mice. (E and F) Lipid droplet quantification in periportal and pericentral zones of SIRT4 WT and SIRT4 KO mice. Data are generated from 10 images from 3 mice per genotype. **, P < 0.01; ***, P < 0.001; ns, not significant.
Fig 5
Fig 5
SIRT4 suppresses PPARα activity cell autonomously. (A) Immunoblots showing SIRT4 expression in primary mouse embryonic fibroblasts (MEFs) from SIRT4 KO and SIRT4 WT mice. MEFs were stably infected with virus that contained SIRT4 (+) or a pBabe vector control (−). (B) Induction of Pdk4 expression by WY14643 is modulated by SIRT4. Primary SIRT4 KO and SIRT4 WT MEFs infected with control or SIRT4 expression virus were treated with WY14643 or with 0.5% DMSO for 24 h. Gene expression was normalized to B2m and Rps16 and normalized to the DMSO-treated conditions for each sample (dotted line). (C) SIRT4 expression decreased PPARα transcriptional activity in human embryonic kidney 293T (HEK293T) cells cotransfected with PPARα and RXRα plasmids, whereas the SIRT4 mutant did not have an effect on PPARα activity. Expression of pCMV empty vector control also showed no effect. Cells were incubated for 12 h with 0, 0.5, or 1 μM WY14643. Activity was assessed using PPARα luciferase constructs. Expression of SIRT4 and PPARα is shown in the right panel. Results are representative of two independent experiments. (D) PPARα transcriptional activity in H2.35 hepatoma cells endogenously expressing PPARα and RXRα and transfected with pCMV control (pCMV), SIRT4-FLAG (SIRT4), or mutant H125A SIRT4-FLAG (SIRT4 Mut). Cells were treated as described for panel C. (E and F) SIRT4 represses PPARα transcriptional activity. The Western blot in panel E shows expression of SIRT4-FLAG, HA-PPARα, and actin in transiently transfected MEFs. For the experiment shown in panel F, Cells were cotransfected with PPARα and SIRT4 (T4) or pCMV empty vector (V) as a control. Cells were incubated for 12 h with 1 μM WY14643. In all experiments, data are represented as means ± standard errors of the means (n = 3; *, P < 0.05).
Fig 6
Fig 6
SIRT4 suppresses PPARα by modulating SIRT1 activity. NAD+ (A) and NADH (B) levels were measured from SIRT4 WT and KO cells. (C) NAD+ was measured in SIRT4 WT and KO mice (n = 10 to 12). Each data point represents the NAD+ concentration (pmol of NAD+/mg of tissue) of one animal. The line represents the mean NAD+ concentration. (D) NADH was measured from livers of SIRT4 KO and SIRT4 WT mice (n = 10 to 12; same mice as used for the experiment shown in panel C). Each data point represents the NADH concentration (pmol of NADH/mg of tissue) in one animal. The line represents the mean NADH concentration. (E) NAD+ increases PPARα target gene expression. HepG2 cells were treated with 1 mM NMN overnight, and PPARα target gene expression was analyzed by qPCR (n = 3). (F) Lipg expression was measured in HepG2 control and SIRT4-overexpressing cells after treatment with NMN (n = 3). (G) PPARα activation by SIRT1 is repressed by SIRT4. Cells were cotransfected with PPARα and SIRT1, SIRT4 or pCMV empty vector as a control. Cells were incubated for 12 h with 1 μM WY14643. See also Fig. S1B in the supplemental material. (H) SIRT1-PPARα complex was assessed by anti-FLAG immunoprecipitations (IP) in 293T cells with or without stable expression of SIRT4-HA transiently transfected with a PPARα-HA construct together with a FLAG control or a SIRT1-FLAG construct. Immunoprecipitates and 1/100 of starting lysate (input) were analyzed by Western blotting (WB) and probed with HA or FLAG antibody. (I) SIRT4 represses the binding of SIRT1 to the PPRE of target genes. H2.35 cells were treated with 1 μM WY14643 overnight and subjected to ChIP with PPARα and SIRT1 antibodies and analyzed by qPCR with primers flanking PPRE in the promoter of FGF21 and Acot1. ChIP with H3 antibody was used as a positive control. (J) Oxidation of [3H]palmitate (nmol of [3H]palmitate/h/mg protein) was analyzed using primary hepatocytes isolated from SIRT4 WT and KO mice. Cells were cultured in the presence or absence of 10 μM Ex527, a SIRT1 inhibitor, for 16 h in the presence or absence of 200 μM etomoxir. (K) Oxidation of [3H]palmitate (nmol of [3H]palmitate/h/mg protein) was analyzed using primary hepatocytes isolated from SIRT4 WT and KO mice treated with an shRNA control or targeting SIRT1 (n = 3). At right, immunoblots show SIRT1 and SIRT4 expression in primary hepatocytes from SIRT4 KO and SIRT4 WT mice infected by adenovirus expressing a scrambled shRNA or an shRNA targeting SIRT1. In all panels, data represent means ± standard errors of the means (*, P < 0.05; **, P < 0.01; ***, P < 0.001).

Similar articles

Cited by

References

    1. Desvergne B, Michalik L, Wahli W. 2006. Transcriptional regulation of metabolism. Physiol. Rev. 86:465–514 - PubMed
    1. Kersten S, Seydoux J, Peters JM, Gonzalez FJ, Desvergne B, Wahli W. 1999. Peroxisome proliferator-activated receptor alpha mediates the adaptive response to fasting. J. Clin. Invest. 103:1489–1498 - PMC - PubMed
    1. Leone TC, Weinheimer CJ, Kelly DP. 1999. A critical role for the peroxisome proliferator-activated receptor alpha (PPARα) in the cellular fasting response: the PPARα-null mouse as a model of fatty acid oxidation disorders. Proc. Natl. Acad. Sci. U. S. A. 96:7473–7478 - PMC - PubMed
    1. Imai S, Armstrong CM, Kaeberlein M, Guarente L. 2000. Transcriptional silencing and longevity protein Sir2 is an NAD-dependent histone deacetylase. Nature 403:795–800 - PubMed
    1. Landry J, Sutton A, Tafrov ST, Heller RC, Stebbins J, Pillus L, Sternglanz R. 2000. The silencing protein SIR2 and its homologs are NAD-dependent protein deacetylases. Proc. Natl. Acad. Sci. U. S. A. 97:5807–5811 - PMC - PubMed

Publication types

MeSH terms