

A new framework and software to estimate time-varying reproduction numbers during epidemics
- PMID: 24043437
- PMCID: PMC3816335
- DOI: 10.1093/aje/kwt133
A new framework and software to estimate time-varying reproduction numbers during epidemics
Abstract
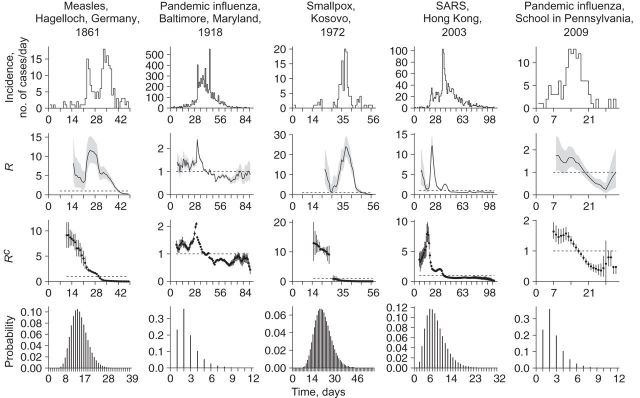
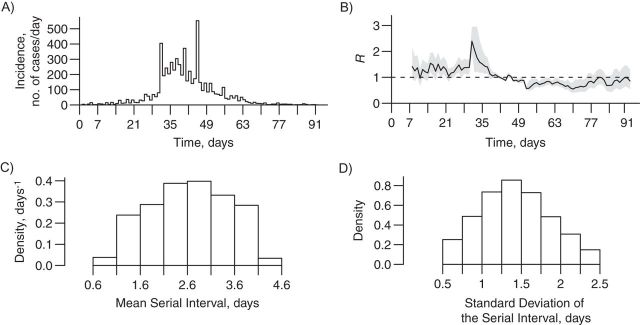
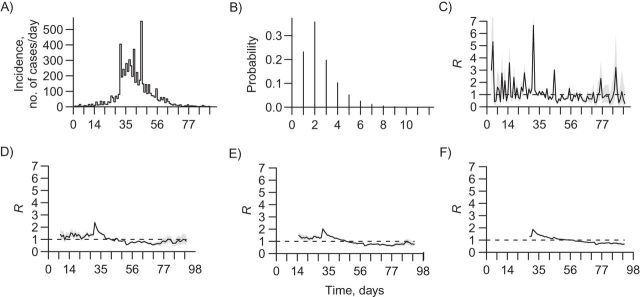
The quantification of transmissibility during epidemics is essential to designing and adjusting public health responses. Transmissibility can be measured by the reproduction number R, the average number of secondary cases caused by an infected individual. Several methods have been proposed to estimate R over the course of an epidemic; however, they are usually difficult to implement for people without a strong background in statistical modeling. Here, we present a ready-to-use tool for estimating R from incidence time series, which is implemented in popular software including Microsoft Excel (Microsoft Corporation, Redmond, Washington). This tool produces novel, statistically robust analytical estimates of R and incorporates uncertainty in the distribution of the serial interval (the time between the onset of symptoms in a primary case and the onset of symptoms in secondary cases). We applied the method to 5 historical outbreaks; the resulting estimates of R are consistent with those presented in the literature. This tool should help epidemiologists quantify temporal changes in the transmission intensity of future epidemics by using surveillance data.
Keywords: SARS; incidence; influenza; measles; reproduction number; smallpox; software.
Figures
Comment in
-
On the misuse of the reproduction number in the COVID-19 surveillance system in Italy.J Med Virol. 2021 May;93(5):2569-2570. doi: 10.1002/jmv.26881. Epub 2021 Feb 19. J Med Virol. 2021. PMID: 33590895 Free PMC article. No abstract available.
References
-
- Anderson R, May R. Infectious Diseases of Humans: Dynamics and Control. Oxford, United Kingdom: Oxford University Press; 1991.
-
- Anderson RM, May RM. Directly transmitted infectious diseases: control by vaccination. Science. 1982;215(4536):1053–1060. - PubMed
-
- Riley S, Fraser C, Donnelly CA, et al. Transmission dynamics of the etiological agent of SARS in Hong Kong: impact of public health interventions. Science. 2003;300(5627):1961–1966. - PubMed
Publication types
MeSH terms
Grants and funding
LinkOut - more resources
Full Text Sources
Other Literature Sources
Medical
Miscellaneous
