

A simple model-free method for direct assessment of fluorescent ligand binding by linear spectral summation
- PMID: 24043458
- PMCID: PMC3945049
- DOI: 10.1007/s10895-013-1290-y
A simple model-free method for direct assessment of fluorescent ligand binding by linear spectral summation
Abstract
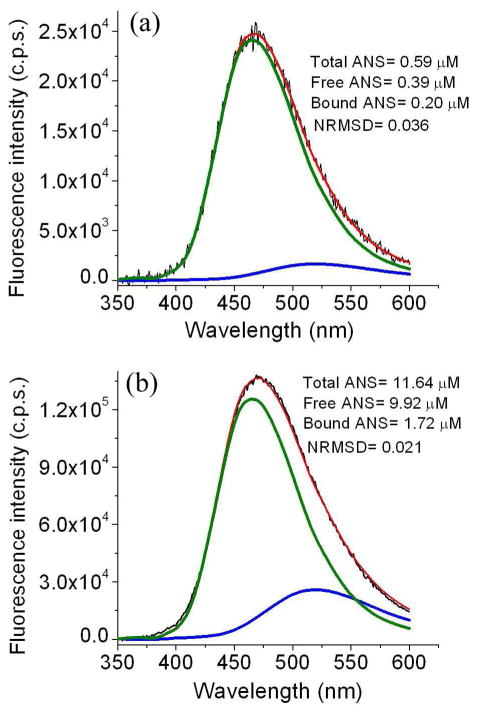
Fluorescent tagged ligands are commonly used to determine binding to proteins. However, bound and free ligand concentrations are not directly determined. Instead the response in a fluorescent ligand titration experiment is considered to be proportional to the extent of binding and, therefore, the maximum value of binding is scaled to the total protein concentration. Here, a simple model-free method is presented to be performed in two steps. In the first step, normalized bound and free spectra of the ligand are determined. In the second step, these spectra are used to fit composite spectra as the sum of individual components or linear spectral summation. Using linear spectral summation, free and bound 1-Anilinonaphthalene-8-Sulfonic Acid (ANS) fluorescent ligand concentrations are directly calculated to determine ANS binding to tear lipocalin (TL), an archetypical ligand binding protein. Error analysis shows that the parameters that determine bound and free ligand concentrations were recovered with high certainty. The linear spectral summation method is feasible when fluorescence intensity is accompanied by a spectral shift upon protein binding. Computer simulations of the experiments of ANS binding to TL indicate that the method is feasible when the fluorescence spectral shift between bound and free forms of the ligand is just 8 nm. Ligands tagged with environmentally sensitive fluorescent dyes, e.g., dansyl chromophore, are particularly suitable for this method.
Figures


Similar articles
-
Characterization of fluorescence of ANS-tear lipocalin complex: evidence for multiple-binding modes.Photochem Photobiol. 2007 Nov-Dec;83(6):1405-14. doi: 10.1111/j.1751-1097.2007.00180.x. Photochem Photobiol. 2007. PMID: 18028215 Free PMC article.
-
Ligand binding site of tear lipocalin: contribution of a trigonal cluster of charged residues probed by 8-anilino-1-naphthalenesulfonic acid.Biochemistry. 2008 Feb 5;47(5):1414-24. doi: 10.1021/bi701955e. Epub 2008 Jan 8. Biochemistry. 2008. PMID: 18179255 Free PMC article.
-
Evidence for internal and external binding sites on human tear lipocalin.Arch Biochem Biophys. 2007 Dec 1;468(1):15-21. doi: 10.1016/j.abb.2007.09.011. Epub 2007 Sep 21. Arch Biochem Biophys. 2007. PMID: 17945179 Free PMC article.
-
The binding of 1,8 ANS congeners to I-FABP and comparison of some hypotheses about ANS' spectral sensitivity to environment.Biochim Biophys Acta. 2005 Apr 15;1748(1):84-93. doi: 10.1016/j.bbapap.2004.12.011. Biochim Biophys Acta. 2005. PMID: 15752696
-
Photophysics of ANS. I. Protein-ANS complexes: Intestinal fatty acid binding protein and single-trp mutants.Biophys Chem. 2007 Jan;125(1):1-12. doi: 10.1016/j.bpc.2006.07.016. Epub 2006 Aug 12. Biophys Chem. 2007. PMID: 16978762
Cited by
-
Ligand binding studies by high speed centrifugal precipitation and linear spectral summation using ultraviolet-visible absorption spectroscopy.MethodsX. 2018 Apr 17;5:345-351. doi: 10.1016/j.mex.2018.04.007. eCollection 2018. MethodsX. 2018. PMID: 30050754 Free PMC article.
-
Conformational modulation of the farnesoid X receptor by prenylflavonoids: Insights from hydrogen deuterium exchange mass spectrometry (HDX-MS), fluorescence titration and molecular docking studies.Biochim Biophys Acta. 2016 Dec;1864(12):1667-1677. doi: 10.1016/j.bbapap.2016.08.019. Epub 2016 Sep 3. Biochim Biophys Acta. 2016. PMID: 27596062 Free PMC article.
-
Interaction of ceramides and tear lipocalin.Biochim Biophys Acta Mol Cell Biol Lipids. 2018 Apr;1863(4):399-408. doi: 10.1016/j.bbalip.2018.01.004. Epub 2018 Jan 11. Biochim Biophys Acta Mol Cell Biol Lipids. 2018. PMID: 29331331 Free PMC article.
References
-
- Oravcova J, Bohs B, Lindner W. Drug-protein binding sites. New trends in analytical and experimental methodology. J Chromatogr B Biomed Appl. 1996;677(1):1–28. 0378434795004254 [pii] - PubMed
-
- Hage DS, Tweed SA. Recent advances in chromatographic and electrophoretic methods for the study of drug-protein interactions. J Chromatogr B Biomed Sci Appl. 1997;699 (1–2):499–525. - PubMed
Publication types
MeSH terms
Substances
Grants and funding
LinkOut - more resources
Full Text Sources
Other Literature Sources
