. 2013 Sep 23;210(10):2119-34.
doi: 10.1084/jem.20130252. Epub 2013 Sep 16.

Phosphofructokinase deficiency impairs ATP generation, autophagy, and redox balance in rheumatoid arthritis T cells

Affiliations

Phosphofructokinase deficiency impairs ATP generation, autophagy, and redox balance in rheumatoid arthritis T cells

Zhen Yang et al. J Exp Med. .

Abstract

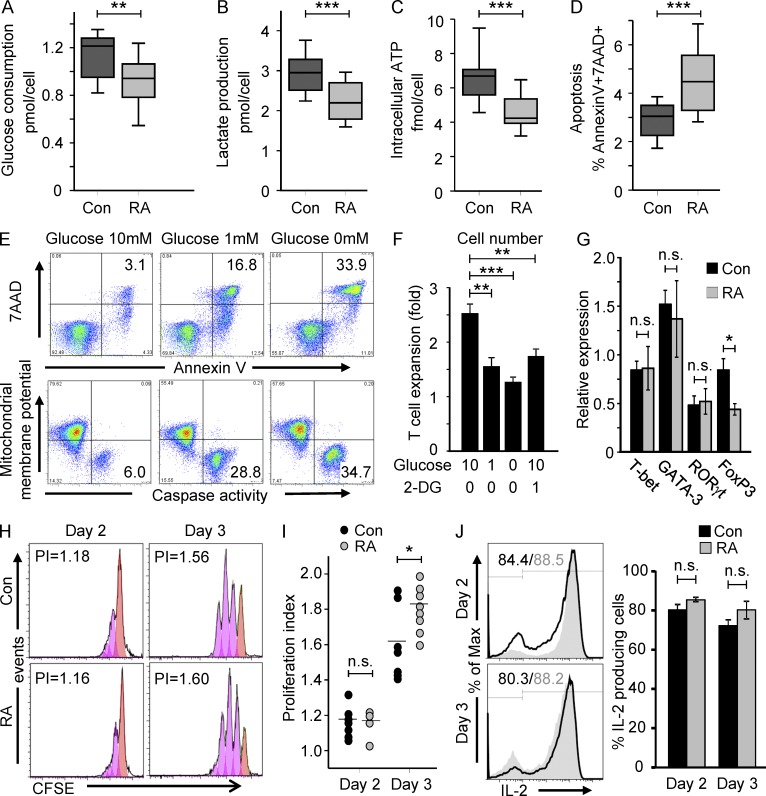
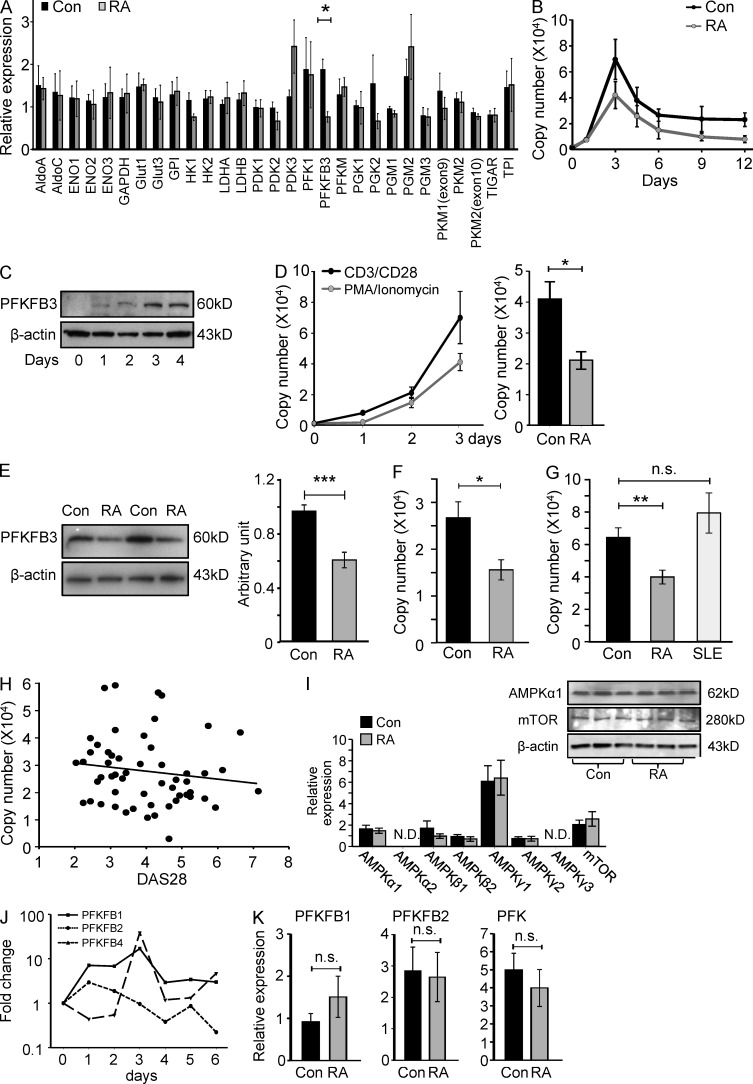
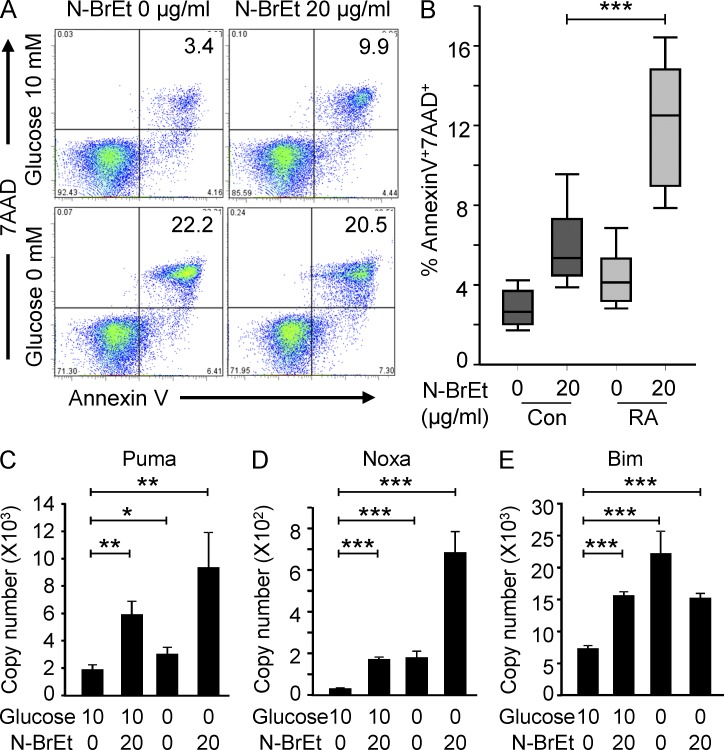
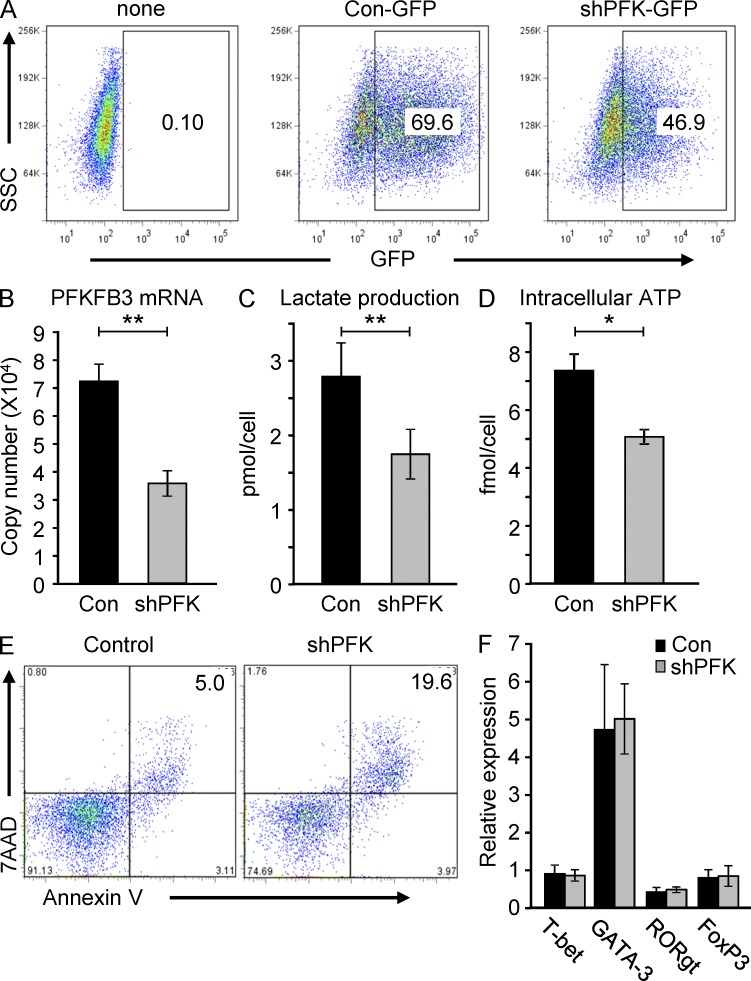
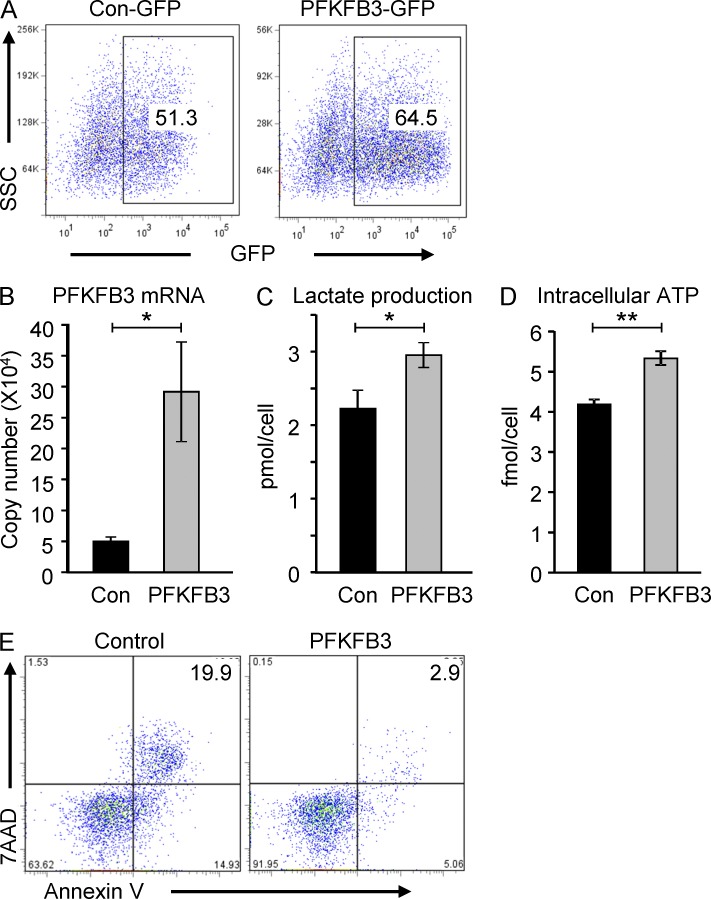
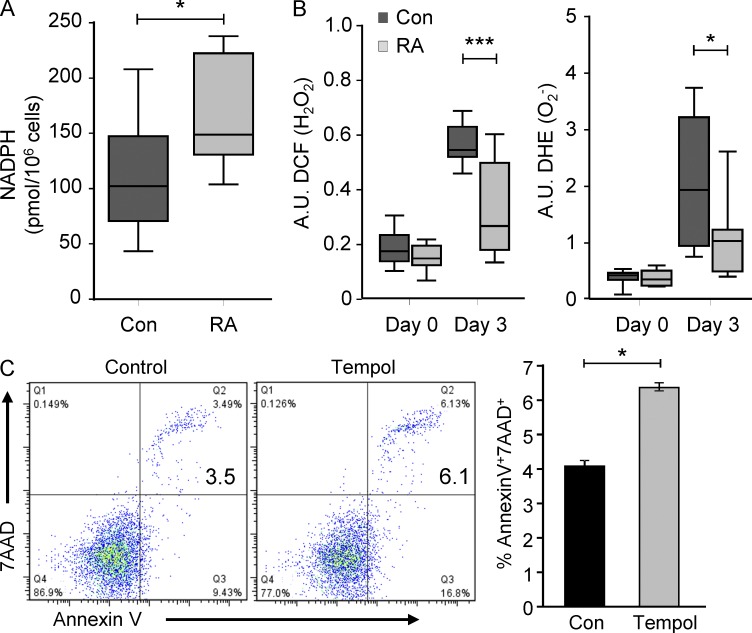
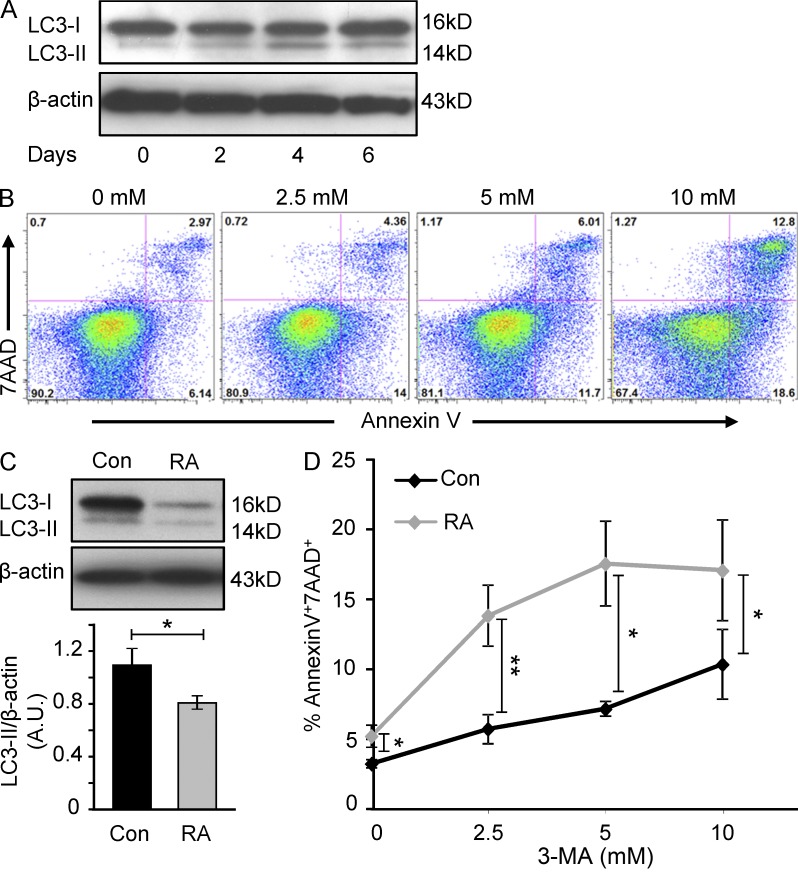
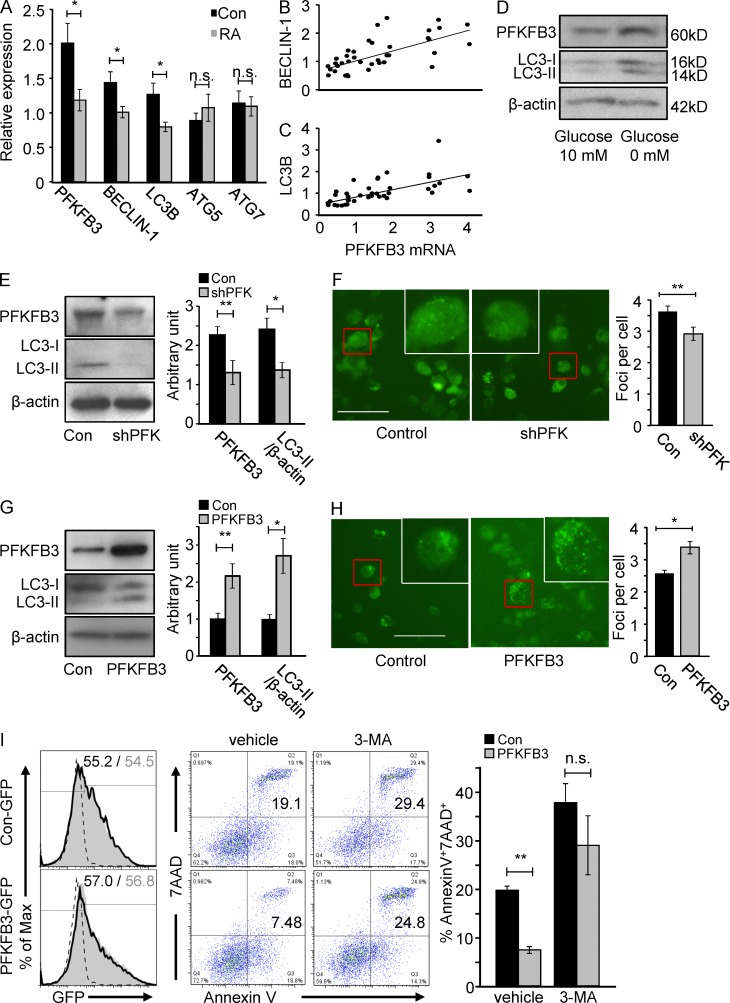
In the HLA class II-associated autoimmune syndrome rheumatoid arthritis (RA), CD4 T cells are critical drivers of pathogenic immunity. We have explored the metabolic activity of RA T cells and its impact on cellular function and fate. Naive CD4 T cells from RA patients failed to metabolize equal amounts of glucose as age-matched control cells, generated less intracellular ATP, and were apoptosis-susceptible. The defect was attributed to insufficient induction of 6-phosphofructo-2-kinase/fructose-2,6-bisphosphatase 3 (PFKFB3), a regulatory and rate-limiting glycolytic enzyme known to cause the Warburg effect. Forced overexpression of PFKFB3 in RA T cells restored glycolytic flux and protected cells from excessive apoptosis. Hypoglycolytic RA T cells diverted glucose toward the pentose phosphate pathway, generated more NADPH, and consumed intracellular reactive oxygen species (ROS). PFKFB3 deficiency also constrained the ability of RA T cells to resort to autophagy as an alternative means to provide energy and biosynthetic precursor molecules. PFKFB3 silencing and overexpression identified a novel extraglycolytic role of the enzyme in autophagy regulation. In essence, T cells in RA patients, even those in a naive state, are metabolically reprogrammed with insufficient up-regulation of the glycolytic activator PFKFB3, rendering them energy-deprived, ROS- and autophagy-deficient, apoptosis-sensitive, and prone to undergo senescence.


Figures

Figure 1.
Figure 1.
Glucose hypometabolism in RA T cells. Naive CD4 (CD4+CD45RO) T cells were isolated from RA patients (RA) and age-matched controls (Con) and stimulated with anti-CD3/CD28 microbeads. On day 3, cells were harvested, washed, and recultured for a period of 4 h. Culture medium was collected at 0 and 4 h to measure glucose (A, 14 RA patients and 11 healthy controls) and lactate concentration (B, 21 RA patients and 18 healthy controls). Intracellular ATP was determined in cell pellets (C, 17 RA patients and 18 healthy controls). Frequencies of apoptotic (7AAD+ and Annexin V+) T cells were assessed by flow cytometry (D). Results are shown as box plots. Median, 25th, and 75th percentiles (box), and 10th and 90th percentiles (whiskers) are displayed. T cell apoptosis and caspase activity (E) in relation to glucose availability were evaluated by stimulating T cells for 2 d, washing them and reculturing them in the absence or presence of glucose (10 or 1 mM), n = 3. To block glycolytic activity, 2-deoxy-d-glucose (2-DG) was added to T cell cultures on day 0. T cell expansion (F) was measured after 72 h, n = 4. T cell responsiveness was compared in RA and control CD4+CD45RO T cells 48 and 72 h after stimulation. Expression of the lineage commitment transcription factors T-bet, Gata-3, FoxP3, and RORγt was measured by RT-PCR after 48 h (G, 10 RA patients and 11 healthy controls). T cell proliferation was quantified by CFSE dilution and representative histograms are shown (H). Proliferation indices from four to eight RA patients and seven age-matched controls are presented (I). Frequencies of IL-2–producing T cells were quantified by cytometric analysis of intracellular staining (J). Results from 4 RA patients and 4 age-matched controls are shown as mean ± SEM. *, P < 0.05; **, P < 0.01; ***, P < 0.001; n.s., non-significant.
Figure 2.
Figure 2.
PFKFB3 induction is suppressed in RA T cells. Naive CD4 (CD4+CD45RO) T cells were isolated from RA patients and age-matched controls and stimulated with anti-CD3/CD28 microbeads for 3 d. Glycolysis-related gene transcripts were quantified by qPCR (A, n = 3). Kinetics of the expression of PFKFB3 in T cells following TCR ligation were monitored by RT-PCR over 12 d (B, 6 RA patients and 6 healthy controls) or by Western blotting over 4 d (C). Naive CD4 T cells were stimulated with either anti-CD3/CD28 microbeads or 20 ng/ml PMA and 200 µg/ml ionomycin and PFKFB3 transcript levels were monitored over 72 h in six samples. PMA/ionomycin-induced PFKFB3 transcripts from 5 RA patients and 6 controls are shown (D). Protein levels of PFKFB3 were quantified by Western blotting. Representative data for 2 patients and 2 controls are shown. Quantification of band densities from five independent experiments in 10 patients and 10 control samples are given as mean ± SEM (E). Expression of PFKFB3 in CD4+CD45RO+ memory T cells was quantified in 10 controls and 5 RA patients by RT-PCR (F). Activation-induced up-regulation of PFKFB3 was compared in control T cells, RA T cells, and SLE T cells on day 3 after TCR ligation. PFKFB3 mRNA levels were determined by RT-PCR in n = 16 RA patients, n = 33 controls, and n = 11 SLE patients. Results are given as mean ± SEM (G). PFKFB3 transcripts quantified by qPCR on day 3 after T cell stimulation were correlated with RA disease activity (DAS28; r2 = 0.020, P = 0.306; H). Expression of AMPK family members and mTOR was determined by qPCR and Western blotting, respectively. Data from 6 RA patients and 6 age-matched controls are presented as mean ± SEM and representative immunoblots are shown (I). Transcripts of PFKFB1, 2, and 4 were quantified by qPCR over 6 d (J). Activation-induced up-regulation of PFKFB1, 2, and 4 were compared in control and RA T cells (n = 8 each) on day 3 after TCR ligation. Results are given as mean ± SEM (K). *, P < 0.05; **, P < 0.01; ***, P < 0.001; n.s., non-significant.
Figure 3.
Figure 3.
PFKFB3 deficiency renders CD4 T cells apoptosis susceptible. Naive CD4 T cells were purified and activated as in Fig. 1. On day 2, T cells were washed and treated with 20 µg/ml of the PFK-2 inhibitor N-BrEt for an additional 48 h in the absence or presence of 10 nM glucose. Apoptotic cells were detected by flow cytometry; representative data are shown (A). Inhibitor-induced increases in death rates for control and RA T cells are presented for 18 patients and 15 controls (B). Data are shown as box plots. Median, 25th, and 75th percentiles (box), and 10th and 90th percentiles (whiskers) are displayed. Transcripts of Puma (C), Noxa (D), and Bim (E) were quantified by qPCR and are shown as mean ± SEM from three independent experiments. *, P < 0.05; **, P < 0.01; ***, P < 0.001.
Figure 4.
Figure 4.
Silencing PFKFB3 constrains glucose metabolism in T cells. T cells were transfected with PFKFB3 shRNA plasmids (shPFKFB3-GFP) or control plasmids on day 2 after stimulation. Transfection efficiency was monitored by flow cytometry for GFP-expressing cells (A), and PFKFB3 transcripts were quantified 24 h later in control and shPFK-transfected cells by RT-PCR (B). Lactate production (C) and concentrations of intracellular ATP (D) were compared in five independent experiments, and results are given as mean ± SEM. Apoptotic cells were detected by flow cytometry; representative dot blots are shown (E). Expression of the lineage commitment transcription factors T-bet, Gata-3, FoxP3, and RORγt was measured in T cells 24 h after transfection (F), n = 8. *, P < 0.05; **, P < 0.01.
Figure 5.
Figure 5.
Overexpression of PFKFB3 in RA T cells restores glucose metabolism and protects from apoptosis. CD4+CD45RA T cells were isolated from RA patients, stimulated with anti-CD3/CD28 beads, and 48 h later transfected with PFKFB3 overexpression plasmids (pIRES-PFKFB3-GPF) or control plasmids. Cells were kept in culture for an additional 48 h. Flow cytometric analysis of a representative experiment analyzing GFP expression is shown (A). The following parameters were determined in transfected T cells: (B) PFKFB3 mRNA level by qPCR; (C) lactate production; and (D) intracellular ATP concentration quantified as in Fig. 1. Data from five independent experiments are presented as mean ± SEM. Apoptotic susceptibility was tested in PFKFB3 and control transfected T cells by measuring 7AAD+ and Annexin V+ cells (E). *, P < 0.05; **, P < 0.01.
Figure 6.
Figure 6.
Naive CD4 T cells were purified and activated as in Fig. 1. NADPH levels were measured in T cell extracts 72 h after activation. Data from 8 RA patients and 10 age-matched controls are presented as box plots. Median, 25th, and 75th percentiles (box), and 10th and 90th percentiles (whiskers) are displayed (A). T cells were loaded with fluorogenic dyes (DCF and DHE) and H2O2 and O2− production was quantified by flow cytometry on days 0 and 3 after stimulation. Data from 11–18 RA patients and 15–22 healthy controls are presented as box plots. Median, 25th, and 75th percentiles (box), and 10th and 90th percentiles (whiskers) are displayed (B). CD4+CD45RO T cells were stimulated and cultured in the absence or presence of the ROS scavenger Tempol (50 µM) for 72 h. Frequencies of apoptotic (7AAD+ and Annexin V+) T cells were assessed by flow cytometry. Representative dot blots are shown and data from three independent experiments are presented as mean ± SEM (C). *, P < 0.05; ***, P < 0.001.
Figure 7.
Figure 7.
Impaired induction of autophagy in RA T cell. Freshly isolated naive CD4 (CD4+CD45RO) T cells were prepared from healthy individuals and stimulated with anti-CD3/CD28–coated beads. Cells were harvested on days 0, 2, 4, and 6, and cell extracts were analyzed for the autophagy marker LC3-II by Western blot (A). On day 2 after stimulation, cells were treated with the autophagy inhibitor 3-MA for 24 h. Frequencies of apoptotic cells were determined by flow cytometry as 7AAD and Annexin V double-positive cells. Representative data from five independent experiments are shown (B). Expression of LC3-II protein in RA and control T cells was compared by Western blot analysis on day 4 after TCR stimulation. Protein levels were quantified by densitometry. Western blot results from a representative experiment are shown and results from six different control-patient pairs are presented as mean ± SEM (C). Apoptotic sensitivity was tested in control and RA T cells by treating with increasing doses of 3-MA. Frequencies of 7AAD+/Annexin V+ cells from 6 patients and 5 controls are given as mean ± SEM (D). *, P < 0.05; **, P < 0.01.
Figure 8.
Figure 8.
PFKFB3 is a regulator of autophagy in human T cells. Naive CD4 (CD4+CD45RO) T cells were isolated from RA patients and age-matched controls and stimulated with anti-CD3/CD28 microbeads. Autophagy-related gene transcripts (Beclin-1, LC3B, Atg5, and Atg7) were quantified by qPCR on day 3 (A, 20 RA patients and 19 healthy controls), and correlated with the induction of PFKFB3 (B and C). Freshly isolated naive CD4 T cells were stimulated with CD3/CD28 beads. On day 2, cells were washed and then cultured in the absence and presence of 10 mM glucose for an additional 48 h. Concentrations of PFKFB3 and LC3-II were measured by Western blotting. Representative data from one of three independent experiments are shown (D). T cells were transfected with pSuper-PFKFB3-GFP (shPFK) plasmids (E) or pIRES-PFKFB3-GFP (PFKFB3) plasmids (G) 48 h after stimulation and incubated for an additional 48 h. PFKFB3 and LC3-II protein levels were detected by Western blotting. Representative blots are shown and data from five independent experiments are presented as mean ± SEM. For microscopic analysis of LC3 foci, T cells were transfected with pSuper-PFKFB3-H2Kk (shPFK) plasmids (F) or pIRES-PFKFB3-H2Kk (PFKFB3) plasmids (H) 48 h after stimulation and incubated for an additional 48 h. In each experiment, LC3-GFP foci were determined in >50 cells. Representative pictures are shown and data from three to four independent experiments are presented as mean ± SEM. Bars, 50 µM. CD4+CD45RO T cells from RA patients were transfected with PFKFB3 or control plasmids and tested for apoptotic susceptibility by culturing them in the absence and presence of 2.5 µM 3-MA. Frequencies of 7AAD+ and Annexin V+ cells were determined cytometrically (I). Representative dot plots are presented. Frequencies of apoptotic cells from three independent experiments are given as mean ± SEM. *, P < 0.05; **, P < 0.01; n.s., non-significant.

Comment in

References

    1. Almeida A., Bolaños J.P., Moncada S. 2010. E3 ubiquitin ligase APC/C-Cdh1 accounts for the Warburg effect by linking glycolysis to cell proliferation. Proc. Natl. Acad. Sci. USA. 107:738–741 10.1073/pnas.0913668107 - DOI - PMC - PubMed
    1. Alves N.L., Derks I.A., Berk E., Spijker R., van Lier R.A., Eldering E. 2006. The Noxa/Mcl-1 axis regulates susceptibility to apoptosis under glucose limitation in dividing T cells. Immunity. 24:703–716 10.1016/j.immuni.2006.03.018 - DOI - PubMed
    1. Atsumi T., Chesney J., Metz C., Leng L., Donnelly S., Makita Z., Mitchell R., Bucala R. 2002. High expression of inducible 6-phosphofructo-2-kinase/fructose-2,6-bisphosphatase (iPFK-2; PFKFB3) in human cancers. Cancer Res. 62:5881–5887 - PubMed
    1. Bando H., Atsumi T., Nishio T., Niwa H., Mishima S., Shimizu C., Yoshioka N., Bucala R., Koike T. 2005. Phosphorylation of the 6-phosphofructo-2-kinase/fructose 2,6-bisphosphatase/PFKFB3 family of glycolytic regulators in human cancer. Clin. Cancer Res. 11:5784–5792 10.1158/1078-0432.CCR-05-0149 - DOI - PubMed
    1. Bell B.D., Leverrier S., Weist B.M., Newton R.H., Arechiga A.F., Luhrs K.A., Morrissette N.S., Walsh C.M. 2008. FADD and caspase-8 control the outcome of autophagic signaling in proliferating T cells. Proc. Natl. Acad. Sci. USA. 105:16677–16682 10.1073/pnas.0808597105 - DOI - PMC - PubMed

Publication types

MeSH terms