. 2013 Sep 23;210(10):2025-39.
doi: 10.1084/jem.20130903. Epub 2013 Sep 16.

Intestinal monocytes and macrophages are required for T cell polarization in response to Citrobacter rodentium

Affiliations

Intestinal monocytes and macrophages are required for T cell polarization in response to Citrobacter rodentium

Heidi A Schreiber et al. J Exp Med. .

Abstract

Dendritic cells (DCs), monocytes, and macrophages are closely related phagocytes that share many phenotypic features and, in some cases, a common developmental origin. Although the requirement for DCs in initiating adaptive immune responses is well appreciated, the role of monocytes and macrophages remains largely undefined, in part because of the lack of genetic tools enabling their specific depletion. Here, we describe a two-gene approach that requires overlapping expression of LysM and Csf1r to define and deplete monocytes and macrophages. The role of monocytes and macrophages in immunity to pathogens was tested by their selective depletion during infection with Citrobacter rodentium. Although neither cell type was required to initiate immunity, monocytes and macrophages contributed to the adaptive immune response by secreting IL-12, which induced Th1 polarization and IFN-γ secretion. Thus, whereas DCs are indispensable for priming naive CD4(+) T cells, monocytes and macrophages participate in intestinal immunity by producing mediators that direct T cell polarization.


Figures
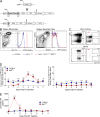
Figure 1.
Figure 1.
MMDTR mice. (A) Diagrammatic representation of Lysmcre (top) Csf1rLsL-DTR (middle) and MMDTR (bottom) mice. Expression of Cre recombinase is under the control of LysM. Expression of a DTR-mCherry protein in BAC transgenic mice is under the control of CSF1R, but is inhibited by a loxp site-flanked Stop element. In MMDTR mice, CSF1R-expressing cells that had expressed LysM express the DTR-mCherry fusion protein and can be deleted by DT. (B) Flow cytometric analysis of mCherry expression on splenic monocytes (LinnegCD11bhighLy6ChighCD115+) and cDCs (LinnegCD11chighMHCIIhigh). Lineage gating includes NK1.1, B220, CD19, Ly6G, and TCRβ. (C) Flow cytometry plots of bone marrow (top) and peripheral blood (bottom) without (left) and 24 h after (right) DT injection. Cells gated on LinnegCD11bhighLy6Gneg. (D) Monocyte abundance in peripheral blood at multiple time points after DT injection in B6 and MMDTR mice. Percentage of the two major monocyte populations, LinnegCD11bhighCD115+Ly6Chigh (left) and LinnegCD11bhighCD115+Ly6Clow (right) in the blood. (E) M-CSF concentrations in sera of DT-treated MMDTR mice determined by ELISA at multiple time points after DT injection. Results represent two to three experiments with two to five mice per group and experiment. Error bars indicate SEM. *, P < 0.05; **, P < 0.01; ***, P < 0.001.
Figure 2.
Figure 2.
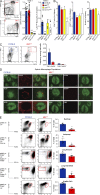
Depletion of monocytes, macrophages, and cDCs in CD11cDTR, zDCDTR, and MMDTR mice. (A) Flow cytometry plots of spleen cDCs (Gate 1, CD11chighMHCIIhigh, gated on Linneg) and monocytes (Gate 2, Ly6ChighCD115+, gated on LinnegMCHIIlowCD11clowCD11b+). Bar graphs show percentage of cDCs and monocytes among total spleen cells 24 h after DT injection. Each data point corresponds to an individual mouse. (B) Bar graphs show percentage of CD4+ and CD8+ T and B lymphocytes among total spleen cells 24 h after DT injection. Results represent three mice per group. (C) Intracellular staining for TNF and iNOS in splenic monocytes from DT-injected B6 and MMDTR mice infected with L. monocytogenes. Gated on LinnegCD11bhighMHCIIlow-intCD11clow-int cells. Cells were stimulated ex vivo with heat-killed L. monocytogenes. Results represent two to three experiments with two to five mice per group and experiment. (D) Spleens from B6 and MMDTR mice 24 h after DT injection. Sections were stained with B220 (green) to visualize B cell zones and macrophage markers (red) to reveal metallophilic (CD169), marginal zone (SIGNR1), and red pulp (F4/80) macrophages. Bars, 100 µm. (E) Tissue macrophage depletion in B6 and MMDTR mice 24 h after DT injection. Results from one representative experiment with four mice per group. Error bars indicate SEM. *, P < 0.05; **, P < 0.01; ***, P < 0.001.
Figure 3.
Figure 3.
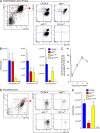
Depletion of monuclear phagocytes in the intestine of MMDTR, zDCDTR, and CD11cDTR mice. (A) Flow cytometry plots of small intestine lamina propria mononuclear phagocyte populations 24 h after DT injection in chimeric B6, MMDTR, zDCDTR, and CD11cDTR mice. Gating on LinnegCD45+MHCIIhigh (left) and CD103 versus CD11b plots on gated population for each genotype (right). (B) Bar graphs show absolute numbers of CD103+CD11b, CD103+CD11b+, and CD103CD11b+ cells in the small intestine lamina propria. Data pooled from >3 experiments with 3–17 mice per group. (C) Reconstitution of macrophage after single DT injection. Frequency of CD103CD11b+ cells among total MHCIIhighCD11chigh cells at several time points after DT injection. Each time point consists of three mice per group. (D) Flow cytometry plots of isolated serosa/muscularis cells 24 h after DT injection in chimeric B6, MMDTR, zDCDTR, and CD11cDTR. Gating on CD11clow-intCD11b+ (left) and CD103 versus CD11b on gated population (right). (E) Bar graphs show absolute numbers of CD103CD11b+ cells in the serosa/muscularis. Results represent two experiments with 2–5 mice per group and experiment. Error bars indicate SEM. *, P < 0.05; **, P < 0.01.
Figure 4.
Figure 4.
Migratory cells in mesenteric lymph nodes after DT injection in CD11cDTR, zDCDTR, and MMDTR mice. (A) Flow cytometry plots of mesenteric LN DCs 24 h after DT injection in B6, MMDTR, zDCDTR, and CD11cDTR mice. Gating on LinnegCD11c+MHCIIhigh cells (left) and CD103 versus CD11b staining on the gated population (right). (B) Bar graphs show absolute number of CD11c+MHCIIhigh total migratory cells, and CD103CD11b+ and CD103+CD11b+ subsets. Data pooled from >3 experiments, 8–10 mice per group. (C) CCR7 transcript levels determined by quantitative real-time PCR from FACS-sorted lamina propria CD103+CD11b+ cells 24 h after DT injection in B6 (blue), MMDTR (red), and zDCDTR (yellow) mice. (D) Flow cytometry plots of mesenteric LN DCs 3 d after C. rodentium infection in DT-injected B6, MMDTR, and zDCDTR mice. (E) Bar graphs show absolute number of CD11c+MHCIIhigh total migratory cells, and CD103CD11b+ and CD103+CD11b+ subsets. Results represent two experiments with three mice per group and experiment. Error bars indicate SEM. (F) CFU per gram of homogenized mesenteric lymph node tissue 3 d after C. rodentium infection. Each data point corresponds to an individual mouse from two independent experiments. Error bars indicate SEM. (G–I) 5 × 10⁶ OT-II cells labeled with violet trace were transferred to DT-treated B6, zDCDTR, and MMDTR mice. Mice were infected with an OVA-expressing strain of C. rodentium the next day. 5 d after the infection, T cell proliferation (dilution of violet trace) and activation (down-regulation of CD62L) were determined in the mLN. (G) Dilution of violet trace cell division dye and down-regulation of CD62L. Shown are representative plots from two independent experiments with 4–5 mice per group and experiment. Bar graphs show absolute numbers of (H) total OT-II cells and (I) CD62L low OT-II cells. *, P < 0.05; **, P < 0.01; ***, P < 0.001.
Figure 5.
Figure 5.
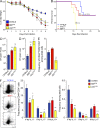
Response to C. rodentium infection in MMDTR and zDCDTR mice. (A) Weight loss after infection with C. rodentium. B6, MMDTR, and zDCDTR mice received DT 1 d before infection and then every other day for 9 d. Each group contains 24–32 mice. (B) Percent of mice surviving C. rodentium infection. As in A, but mice were observed for survival for 23 d. Mean survival (ms) for each group is indicated. Each group contains 6–10 mice. (C) CFU per gram of homogenized feces at day 9 after infection. (D) CFU per gram of homogenized liver at day 9 after infection. (E) Frequency of TCRβ+CD4+CD44+ cells (obtained from LinCD45+ gate) among total colonic lamina propria cells. (F) Flow cytometry plots from colonic lamina propria cells isolated 9 d after C. rodentium infection. Cells were stimulated ex vivo with PMA/Ionomycin and stained for IFN-γ and IL-17. Representative plots show LinnegCD45+TCRβ+CD4+CD44high cells. Bar graphs show frequency of IFN-γ+IL-17, IFN-γ+IL-17+, and IFN-γIL-17+ subsets among CD4+CD44high colonic lamina propria cells. Data pooled from >3 experiments, 10–18 mice per group. *, P < 0.05; **, P < 0.01; ***, P < 0.001. Error bars indicate SEM.
Figure 6.
Figure 6.
Monocytes and macrophage depletion during L. monocytogenes infection. (A–C) C57Bl/6 and MMDTR bone marrow chimeric mice received one DT injection 1 d before i.v. injection with (A) 5 × 10⁴ virulent Lm or (B and C) 108 ActA Lm and every other day thereafter. Mice were sacrificed at day 7 after infection. (A) Percent of DT-injected C57Bl/6 and MMDTR mice surviving virulent Lm infection. Mean survival (ms) for MMDTR group is 4.5 d. ***, P < 0.000, as compared with B6 control receiving continuous DT. Each group contains eight individual mice. (B) Frequency of CD44+ cells among total spleen CD4+ T cells. No statistical significance among C57Bl/6 and MMDTR groups. (C) Flow cytometry plots from splenocytes isolated 7 d after Lm infection. Cells were stimulated ex vivo with LLO190-201 peptide in the presence of BFA, and stained for IFN-γ. Representative plots show LinnegTCRβ+CD4+CD44+ cells. Bar graph shows frequency of IFN-γ+–producing cells among CD4+CD44+ cells. Data pooled from >3 experiments, 7–11 mice per group. ***, P < 0.001. Error bars indicate SEM.
Figure 7.
Figure 7.
Localized IL-12 reduction after monocyte and macrophage depletion during C. rodentium infection. (A) IL12p35 transcript levels from FACS-sorted lamina propria CD103+CD11b, CD103+CD11b+, and CD103CD11b+ cells 3 d after C. rodentium infection in B6 mice. (B) IL12p70 protein levels in the supernatant of colonic tissue, taken 3 d after C. rodentium infection, and cultured for 24 h. (C) Median Fluorescent Intensity (MFI) of Stat4 (pY693) of LinnegCD45+TCRβ+CD4+CD44high cells. Results represent two experiments with three mice per group per experiment. *, P < 0.05; ***, P < 0.001. Error bars indicate SEM.

Similar articles

Cited by

References

    1. Athie-Morales V., Smits H.H., Cantrell D.A., Hilkens C.M. 2004. Sustained IL-12 signaling is required for Th1 development. J. Immunol. 172:61–69 - PubMed
    1. Auffray C., Fogg D.K., Narni-Mancinelli E., Senechal B., Trouillet C., Saederup N., Leemput J., Bigot K., Campisi L., Abitbol M., et al. 2009. CX3CR1+ CD115+ CD135+ common macrophage/DC precursors and the role of CX3CR1 in their response to inflammation. J. Exp. Med. 206:595–606 10.1084/jem.20081385 - DOI - PMC - PubMed
    1. Basu R., O’Quinn D.B., Silberger D.J., Schoeb T.R., Fouser L., Ouyang W., Hatton R.D., Weaver C.T. 2012. Th22 cells are an important source of IL-22 for host protection against enteropathogenic bacteria. Immunity. 37:1061–1075 10.1016/j.immuni.2012.08.024 - DOI - PMC - PubMed
    1. Bennett C.L., Clausen B.E. 2007. DC ablation in mice: promises, pitfalls, and challenges. Trends Immunol. 28:525–531 10.1016/j.it.2007.08.011 - DOI - PubMed
    1. Bogunovic M., Ginhoux F., Helft J., Shang L., Hashimoto D., Greter M., Liu K., Jakubzick C., Ingersoll M.A., Leboeuf M., et al. 2009. Origin of the lamina propria dendritic cell network. Immunity. 31:513–525 10.1016/j.immuni.2009.08.010 - DOI - PMC - PubMed

Publication types

MeSH terms

Substances