. 2013 Oct 1;110(40):E3868-77.
doi: 10.1073/pnas.1215295110. Epub 2013 Sep 16.

Sensorimotor structure of Drosophila larva phototaxis

Affiliations

Sensorimotor structure of Drosophila larva phototaxis

Elizabeth A Kane et al. Proc Natl Acad Sci U S A. .

Abstract

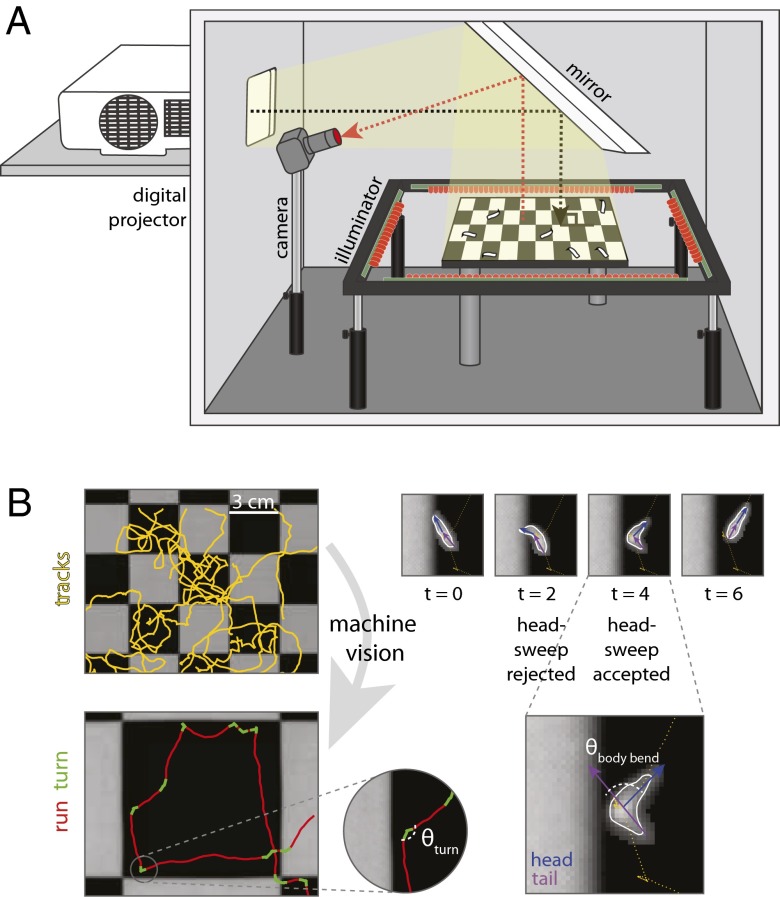
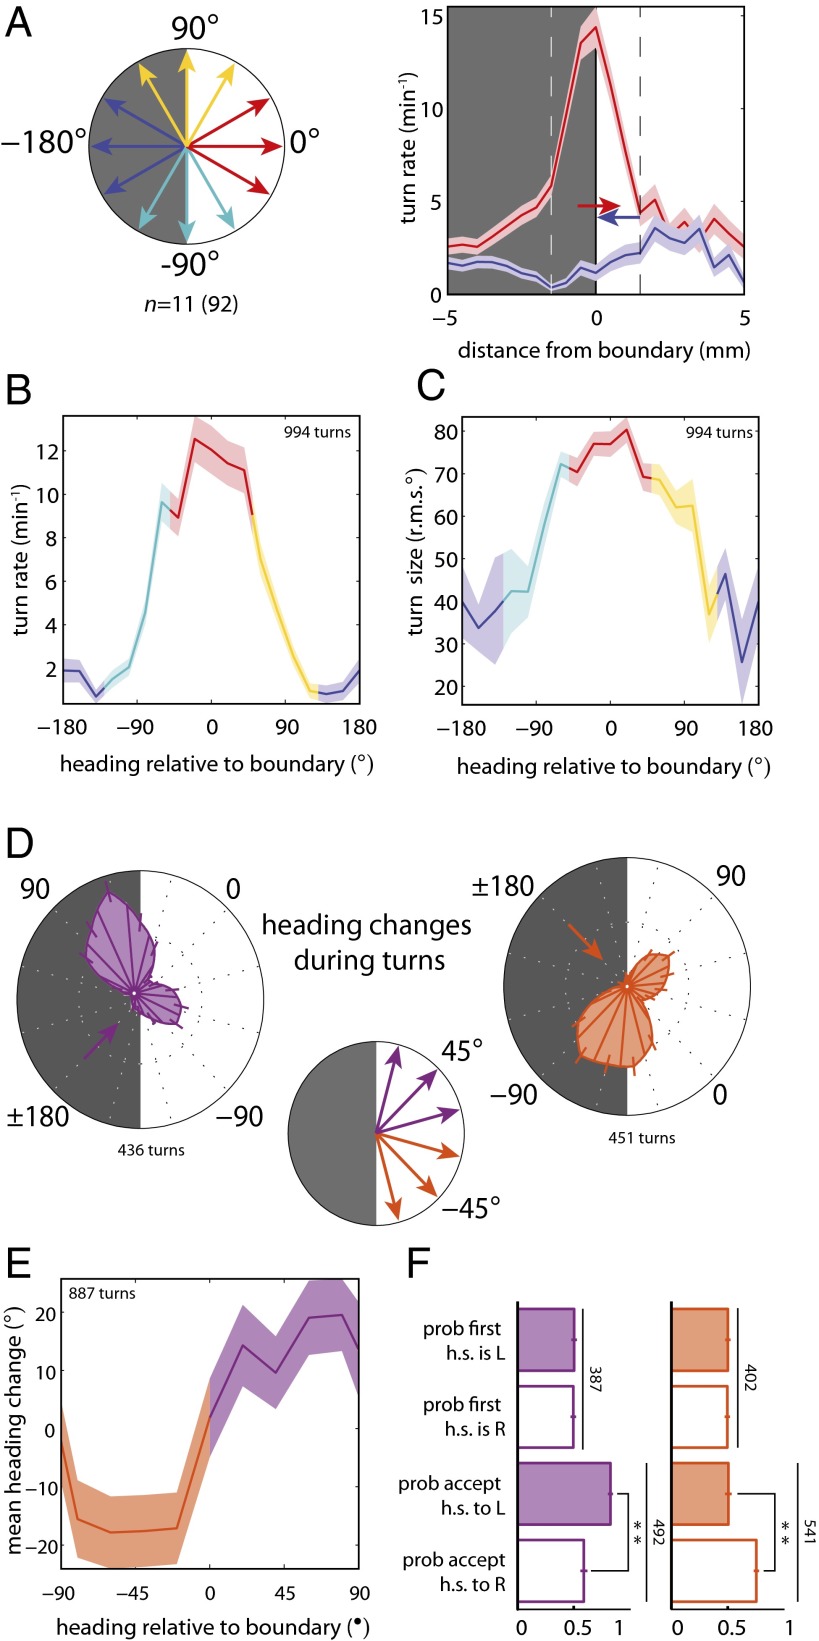
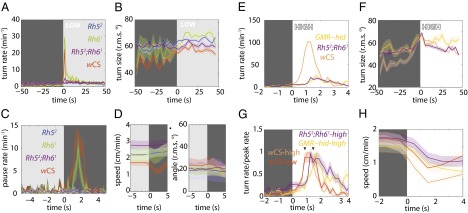
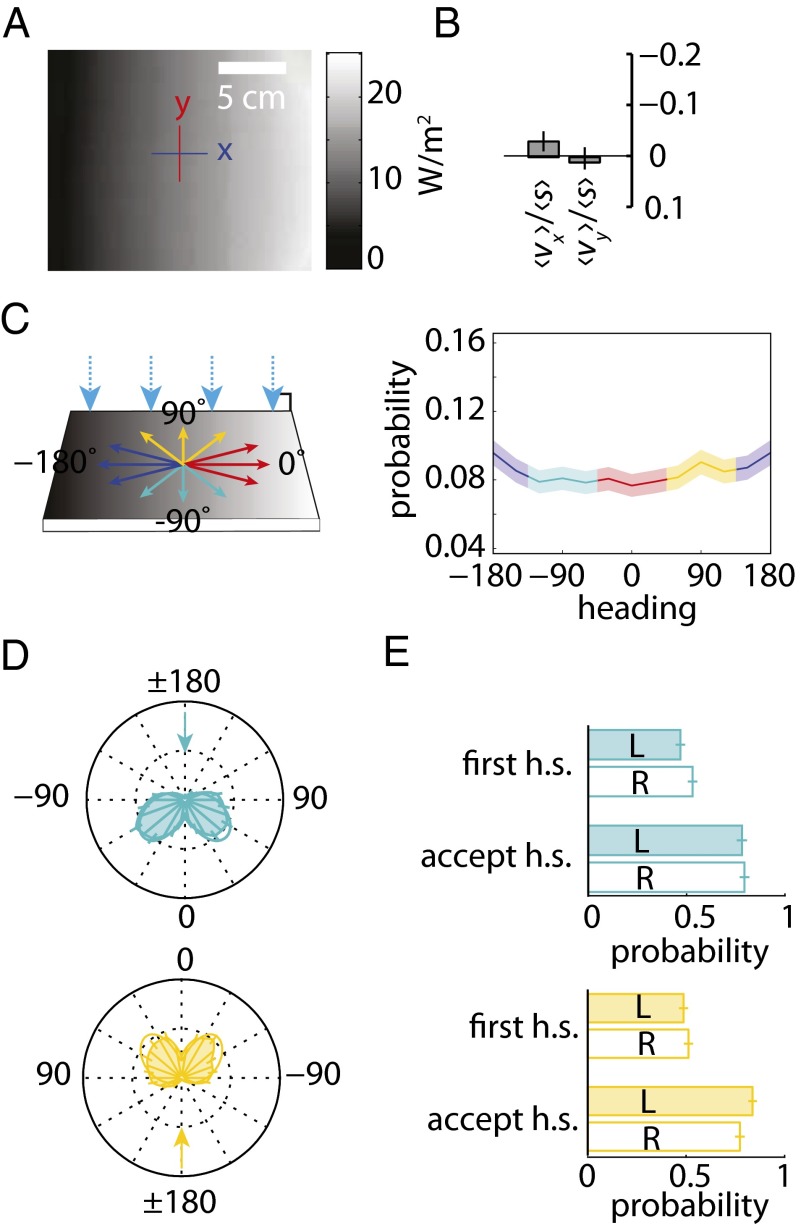
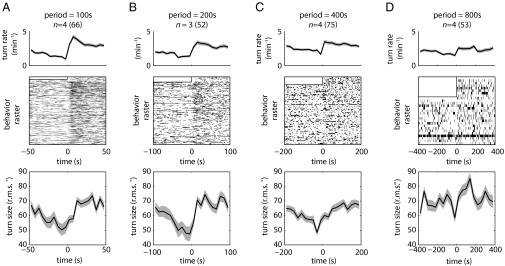
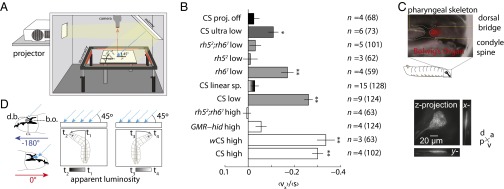
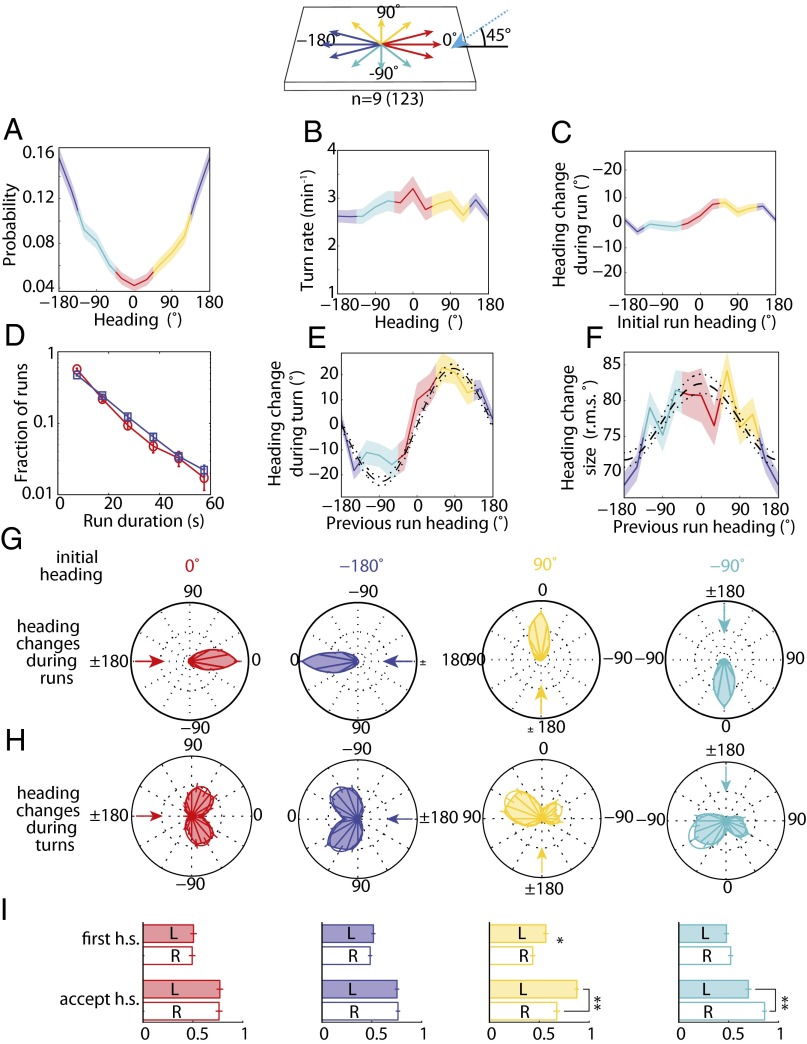
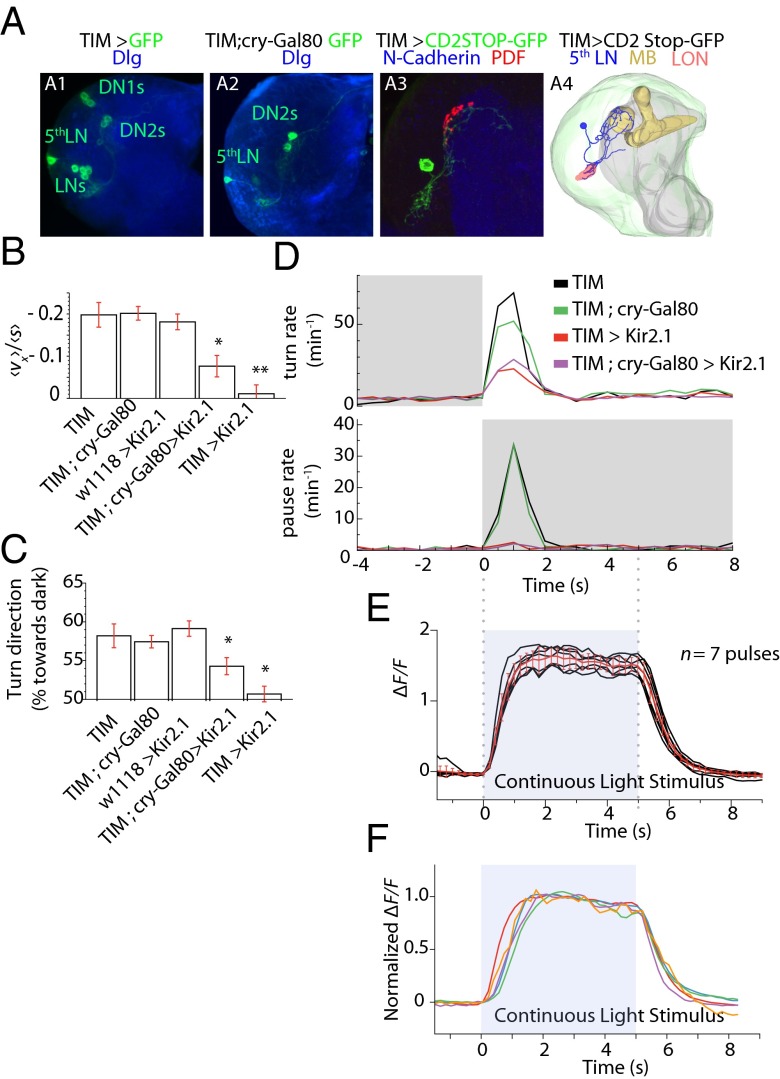
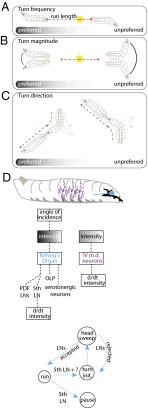
The avoidance of light by fly larvae is a classic paradigm for sensorimotor behavior. Here, we use behavioral assays and video microscopy to quantify the sensorimotor structure of phototaxis using the Drosophila larva. Larval locomotion is composed of sequences of runs (periods of forward movement) that are interrupted by abrupt turns, during which the larva pauses and sweeps its head back and forth, probing local light information to determine the direction of the successive run. All phototactic responses are mediated by the same set of sensorimotor transformations that require temporal processing of sensory inputs. Through functional imaging and genetic inactivation of specific neurons downstream of the sensory periphery, we have begun to map these sensorimotor circuits into the larval central brain. We find that specific sensorimotor pathways that govern distinct light-evoked responses begin to segregate at the first relay after the photosensory neurons.


Conflict of interest statement

The authors declare no conflict of interest.

Figures

Fig. 1.
Fig. 1.
Phototaxis apparatus and automated machine vision larval postural analysis. (A) Schematic of phototaxis assay generating a checkerboard lightscape. A digital projector generates arbitrary spatiotemporal light stimuli. Larvae are placed on a 25-cm dish coated in agar, and their resulting behavior is visualized by infrared LEDs and recorded with a camera. (B) Machine vision software segments the larval tracks into runs and turns. Turns are composed of accepted and/or rejected head-sweeps.
Fig. 2.
Fig. 2.
Larvae bias the frequency, size, and direction of turns to remain in the dark. n = number experiments (number larvae). For definitions of light intensities see Figs. S1 and S2. (A) Schematic of heading angles relative to boundary. Turning rate vs. distance of head from the boundary for −180° and 0° headings; dashed lines indicate boundary region. (BF) Turns initiated when the head was in the boundary. (B) Turning rate vs. heading relative to boundary. (C) Turn size (rms degrees) vs. heading relative to boundary. (D) (Center) Schematic of heading angles diagonal to checker boundary. (Left and Right) Polar histograms of heading changes achieved by turns for a fixed initial run heading before turn. The initial heading is indicated by an arrow. (E) Mean heading change achieved by turns vs. initial heading relative to the boundary. (F) Probability of first head-sweep (h.s.) direction and acceptance to left (L) and right (R). Numbers indicate total head-sweeps. **Rejection of null hypothesis that probabilities are the same at P < 0.0001, binomial statistics.
Fig. 3.
Fig. 3.
Larvae use temporal comparisons of light intensity to inform phototaxis. Shaded background represents light stimulus. Shaded areas around curves represent SEM. For definitions of light intensities, see Figs. S1 and S2. n = number experiments (number larvae). Low intensity: wCS: n = 4 (98); rh52: n = 4 (106); rh61: n = 2 (41); rh52;rh61: n = 4 (110). High intensity: wCS: n = 4 (107); GMR−hid: n = 4 (62); rh52;rh61: n = 5 (119). (A) Turn rate vs. time since light-on. (B) Turn size (rms degrees) vs. time since light-on. wCS: 2,890 turns; rh52: 2,569 turns; rh61: 927 turns; rh52;rh61: 3,258 turns. (C) Pausing rate vs. time since light-off. (D) Average speed and angle of body bend (rms degrees) vs. time since light-off. wCS: 1,299 pauses; rh52: 444 pauses; rh61: 217 pauses; rh52;rh61: 811 pauses. (E) Turn rate vs. time since light-on. (F) Turn size (rms degrees) vs. time since light-on. (G) Normalized turning rate vs. time since light-on. (H) Average speed vs. time since light-on. wCS: 3,100 turns; GMR−hid: 1,125 turns; rh52;rh61: 3,622 turns.
Fig. 4.
Fig. 4.
Larvae do not phototax on a shallow linear spatial gradient. (A) Irradiance map of the linear gradient lightscape. (B) Canton-S larvae navigational index, (v)/(s), computed for x and y directions on the linear gradient lightscape. n = 15 animals, 128 experiments. (C) (Left) Schematic of the linear gradient lightscape. Light is incident to plate at 90°. (Right) Probability of orientation vs. heading in runs for the linear gradient lightscape. The shaded area around the curve represents SEM. (D) Polar histograms of heading changes achieved by turns for a fixed initial run heading before turn. The arrow indicates the initial heading. (E) Probability of first head-sweep (h.s.) direction and head-sweep acceptance to left (L) and right (R) sorted by initial heading for linear gradient lightscape.
Fig. 5.
Fig. 5.
Temporal analogs of linear gradient lightscapes (triangle-wave lightscapes). Shaded areas around curves represent SEM. n = number experiments (number larvae). (AD) Statistics of turning decisions for linear temporal gradients delivered as repeating cycles of periods equal to 100 s (A), 200 s (B), 400 s (C), and 800 s (D). (Top) Turning rate vs. time. (Middle) Raster plots represent periods in which an individual larva was turning. Each row represents one larva tracked continuously throughout the cycle. Half of the period of the first cycle was discarded to allow for acclimation. (Bottom) Mean turn size vs. time in cycle.
Fig. 6.
Fig. 6.
Directional lightscape navigation requires the Rh5 PRs of the BO. (A) Schematic of directional lightscape apparatus. Light rays are incident to larvae at 45°. (B) Navigational index (vx)/(s). Rejection of null hypothesis that dataset has same mean as projector-off dataset: *P < 0.01, **P < 0.0001, Welch two-tailed t test. For light intensities see Figs. S1 and S2. n = number experiments (number larvae). (C) The BO sits in a pigment cup formed by the cephalopharyngeal skeleton. (Upper) Fluorescence microscopy of GMR−RFP merged with bright-field microscopy. The white dotted line indicates the cephalopharyngeal skeleton. (Lower) Maximum intensity projections from 3D confocal microscopy of the BO in longGMR > CD8:: GFP larva. (D) Schematic of differential view angle of the BO conferred by cephalopharyngeal skeleton.
Fig. 7.
Fig. 7.
Directional lightscape navigational strategy. (Top) Schematic of headings on the directional lightscape. (A) Probability of heading during runs. (B) Turn rate vs. heading in run. (C) Mean heading change achieved in run vs. heading in initial run. (D) Distribution of run lengths for larval headings into incident light rays (red, 0°, nonpreferred heading) and away from incident light rays (blue, 180°, preferred heading). (E) Mean heading change during turn vs. previous run heading. Dashed and dotted lines are the prediction and 95% confidence interval of a model with biases in turn magnitude and head-swing acceptance (11). (F) Heading change size (rms degrees) vs. initial heading (in degrees). Dashed and dotted lines are the prediction and 95% confidence interval of the model as described in E. (G) Polar histograms of heading changes achieved by runs for afixed initial heading, indicated by arrow. (H) Polar histograms of heading changes achieved by turns for a fixed initial heading before turn. The arrow indicates the initial heading. (I) Probability of first head-sweep (h.s) direction and acceptance of head-sweeps, whether left (L) or right (R), sorted by initial heading. In AF, shaded areas represent SEM. In I, * indicates P < 0.01 and ** indicates P < 0.0001 using binomial statistics. Data represent nine experiments and 123 animals.
Fig. 8.
Fig. 8.
Segregation of photosensory responses occurs at the first relay. (A) (1 and 2) Projection pattern of the neurons expressing UAS-CD8::GFP under the control of tim-Gal4 (A1, labeling all LNs, DN2s, and DN1s) or tim-Gal4, cry-gal80 (A2, labeling the fifth LN and DN2); anti-GFP is shown in green, and the neuropile marker is shown in blue, with fasciculin/ChaT and Dlg, respectively. (3) Single clone of a fifth LN generated with hs-flp; tim-Gal4/UAS-FRT-CD2-STOP-FRT-CD8::GFP (anti-GFP is show in green, and anti-pdf is shown in red). The non-pdf fifth LN innervates the LON and shows a projection pattern distinct from the pdf-expressing LNs. (4) 3D model of the fifth LN using TrackEM from a confocal stack of a flipped-out fifth LN. The mushroom body helps map the brain (gold). (B) Navigational index (v)/(s) computed for the x direction. Rejection of the null hypothesis that the dataset has the same mean as the TIM dataset: *P < 0.05 or **P < 0.005, Welch two-tailed t test. Error bars indicate SEM. (C) Turn direction bias toward darkness. *Rejection of null hypothesis that distributions have same mean as TIM at P < 0.0001, two-tailed binomial statistics. n = number of turning events. (D) Turn rate (Upper) and pause rate (Lower) in the temporal assays at the onset of light and darkness, respectively. (E) GCaMP6 responses of the fifth LN in one larva exposed to seven on/off pulses of light. Individual ΔF/F traces of each pulse are shown in black, and the mean is shown in red. Error bars indicate SD. (F) GCaMP6 responses of the fifth LN in five animals normalized to a 2-s window of the fluorescence intensity plateau.
Fig. 9.
Fig. 9.
Models for the phototaxis navigational strategy and photosensory processing. (A) Larvae use temporal comparisons of light intensity during runs to modulate turn frequency. The gradient represents the light intensity. (B) Larvae make larger turns from the nonpreferred direction and smaller turns from the preferred direction. (C) Larvae use head-sweeps as probes to explore their local environment and to identify the preferred direction for successive runs. Turn direction bias is generated by asymmetrical acceptance of head-sweeps toward the preferred direction. (D) Model of larval photosensory processing based on temporal derivatives of lumonisoty (d/dt) as described in text.

References

    1. Mast SO. Factors involved in the process of orientation of lower organisms in light. Biol Rev Camb Philos Soc. 1938;13:186–224.
    1. Fraenkel GS, Gunn DL. The Orientation of Animals, Kineses, Taxes and Compass Reactions. Oxford, New York: Oxford University Press; 1961.
    1. Sawin EP, Harris LR, Campos AR, Sokolowski MB. Sensorimotor transformation from light reception to phototactic behavior in Drosophila larvae. J Insect Behav. 1994;7:553–567.
    1. Sawin-McCormack EP, Sokolowski MB, Campos AR. Characterization and genetic analysis of Drosophila melanogaster photobehavior during larval development. J Neurogenet. 1995;10(2):119–135. - PubMed
    1. Hassan J, Busto M, Iyengar B, Campos AR. Behavioral characterization and genetic analysis of the Drosophila melanogaster larval response to light as revealed by a novel individual assay. Behav Genet. 2000;30(1):59–69. - PubMed

Publication types