

A novel system for spatial and temporal imaging of intrinsic plant water use efficiency
- PMID: 24043857
- PMCID: PMC3830482
- DOI: 10.1093/jxb/ert288
A novel system for spatial and temporal imaging of intrinsic plant water use efficiency
Abstract
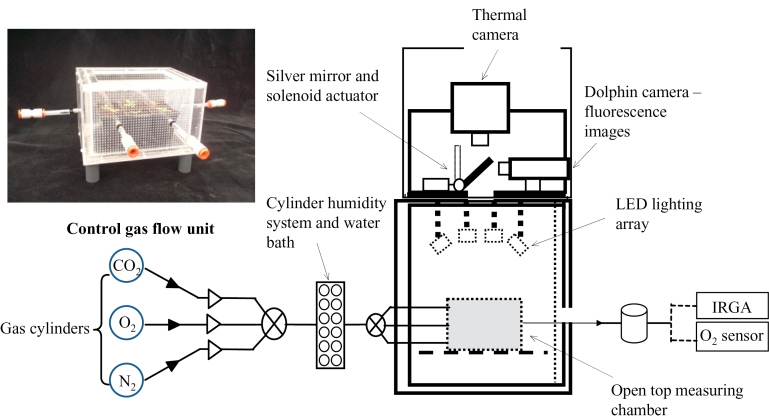
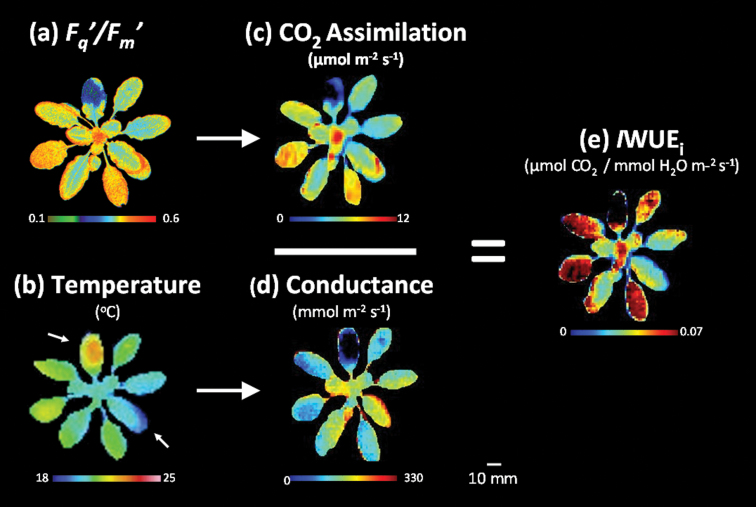
Instrumentation and methods for rapid screening and selection of plants with improved water use efficiency are essential to address current issues of global food and fuel security. A new imaging system that combines chlorophyll fluorescence and thermal imaging has been developed to generate images of assimilation rate (A), stomatal conductance (gs), and intrinsic water use efficiency (WUEi) from whole plants or leaves under controlled environmental conditions. This is the first demonstration of the production of images of WUEi and the first to determine images of g s from themography at the whole-plant scale. Data are presented illustrating the use of this system for rapidly and non-destructively screening plants for alterations in WUEi by comparing Arabidopsis thaliana mutants (OST1-1) that have altered WUEi driven by open stomata, with wild-type plants. This novel instrument not only provides the potential to monitor multiple plants simultaneously, but enables intra- and interspecies variation to be taken into account both spatially and temporally. The ability to measure A, gs, and WUEi progressively was developed to facilitate and encourage the development of new dynamic protocols. Images illustrating the instrument's dynamic capabilities are demonstrated by analysing plant responses to changing photosynthetic photon flux density (PPFD). Applications of this system will augment the research community's need for novel screening methods to identify rapidly novel lines, cultivars, or species with improved A and WUEi in order to meet the current demands on modern agriculture and food production.
Keywords: Chlorophyll fluorescence imaging; dynamic responses; leaf heterogeneity; screening; thermal imaging; water use efficiency..
Figures
Similar articles
-
Differences in stomatal sensitivity to CO2 and light influence variation in water use efficiency and leaf carbon isotope composition in two genotypes of the C4 plant Zea mays.J Exp Bot. 2024 Nov 15;75(21):6748-6761. doi: 10.1093/jxb/erae286. J Exp Bot. 2024. PMID: 38970337
-
Mesophyll CO2 conductance and leakiness are not responsive to short- and long-term soil water limitations in the C4 plant Sorghum bicolor.Plant J. 2020 Aug;103(4):1590-1602. doi: 10.1111/tpj.14849. Epub 2020 Jul 22. Plant J. 2020. PMID: 32438487
-
Stomatal action directly feeds back on leaf turgor: new insights into the regulation of the plant water status from non-invasive pressure probe measurements.Plant J. 2010 Jun 1;62(6):1072-82. doi: 10.1111/j.1365-313X.2010.04213.x. Epub 2010 Mar 25. Plant J. 2010. PMID: 20345603
-
Opportunities for improving leaf water use efficiency under climate change conditions.Plant Sci. 2014 Sep;226:108-19. doi: 10.1016/j.plantsci.2014.04.007. Epub 2014 Apr 15. Plant Sci. 2014. PMID: 25113456 Review.
-
Gas exchange and water-use efficiency in plant canopies.Plant Biol (Stuttg). 2020 Jan;22 Suppl 1:52-67. doi: 10.1111/plb.12939. Epub 2018 Dec 19. Plant Biol (Stuttg). 2020. PMID: 30428160 Review.
Cited by
-
A Journey Through a Leaf: Phenomics Analysis of Leaf Growth in Arabidopsis thaliana.Arabidopsis Book. 2015 Jul 22;13:e0181. doi: 10.1199/tab.0181. eCollection 2015. Arabidopsis Book. 2015. PMID: 26217168 Free PMC article.
-
Thermography methods to assess stomatal behaviour in a dynamic environment.J Exp Bot. 2020 Apr 6;71(7):2329-2338. doi: 10.1093/jxb/erz573. J Exp Bot. 2020. PMID: 31912133 Free PMC article.
-
Dynamic leaf energy balance: deriving stomatal conductance from thermal imaging in a dynamic environment.J Exp Bot. 2019 May 9;70(10):2839-2855. doi: 10.1093/jxb/erz068. J Exp Bot. 2019. PMID: 30793211 Free PMC article.
-
Measuring the dynamic photosynthome.Ann Bot. 2018 Aug 1;122(2):207-220. doi: 10.1093/aob/mcy087. Ann Bot. 2018. PMID: 29873681 Free PMC article. Review.
-
Using Infrared Thermography for High-Throughput Plant Phenotyping.Methods Mol Biol. 2024;2790:317-332. doi: 10.1007/978-1-0716-3790-6_16. Methods Mol Biol. 2024. PMID: 38649578
References
-
- Aldea M, Frank TD, DeLucia EH. 2006. A method for quantitative analysis of spatially variable physiological processes across leaf surfaces. Photosynthesis Research 90, 161–172 - PubMed
-
- Bacon MA. 2004. Water use efficiency in plant biology. In: Bacon MA, ed. Water use efficiency in plant biology. Oxford: Blackwell Publishing, 1–26
-
- Badger MR, Fallahi H, Kaines S, Takahashi S. 2009. Chlorophyll fluorescence screening of Arabidopsis thaliana for CO2 sensitive photorespiration and photoinhibition mutants. Functional Plant Biology 36, 867–873 - PubMed
-
- Baker NR. 2008. Chlorophyll fluorescence: a probe of photosynthesis in vivo . Annual Review of Plant Biology 59, 89–113 - PubMed
-
- Baker NR, Oxborough K. 2004. Chlorophyll fluorescence as a probe of photosynthetic productivity. Berlin: Springer
MeSH terms
Substances
LinkOut - more resources
Full Text Sources
Other Literature Sources
