. 2013 Oct;142(4):351-66.
doi: 10.1085/jgp.201310995. Epub 2013 Sep 16.

Direct interaction of eag domains and cyclic nucleotide-binding homology domains regulate deactivation gating in hERG channels

Affiliations

Direct interaction of eag domains and cyclic nucleotide-binding homology domains regulate deactivation gating in hERG channels

Elena C Gianulis et al. J Gen Physiol. 2013 Oct.

Abstract

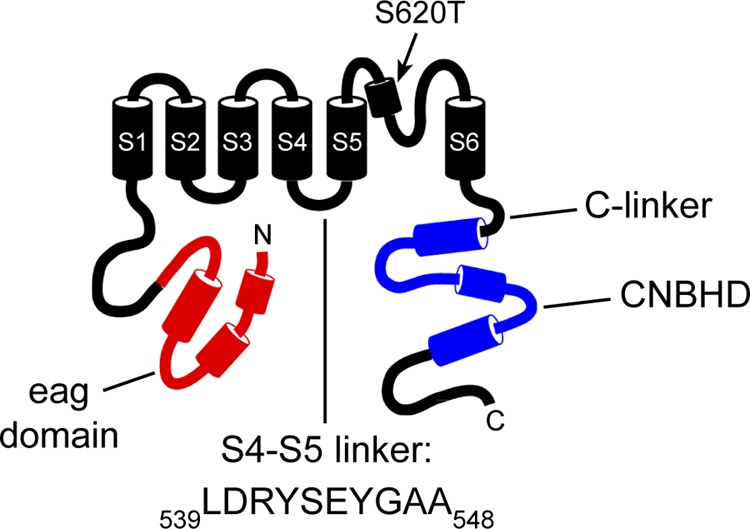
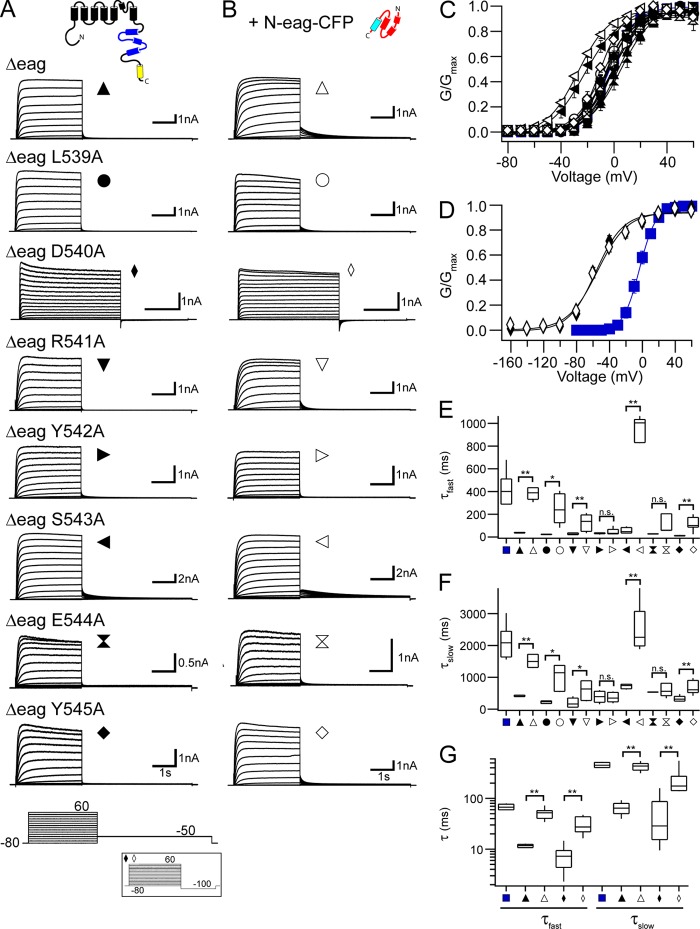
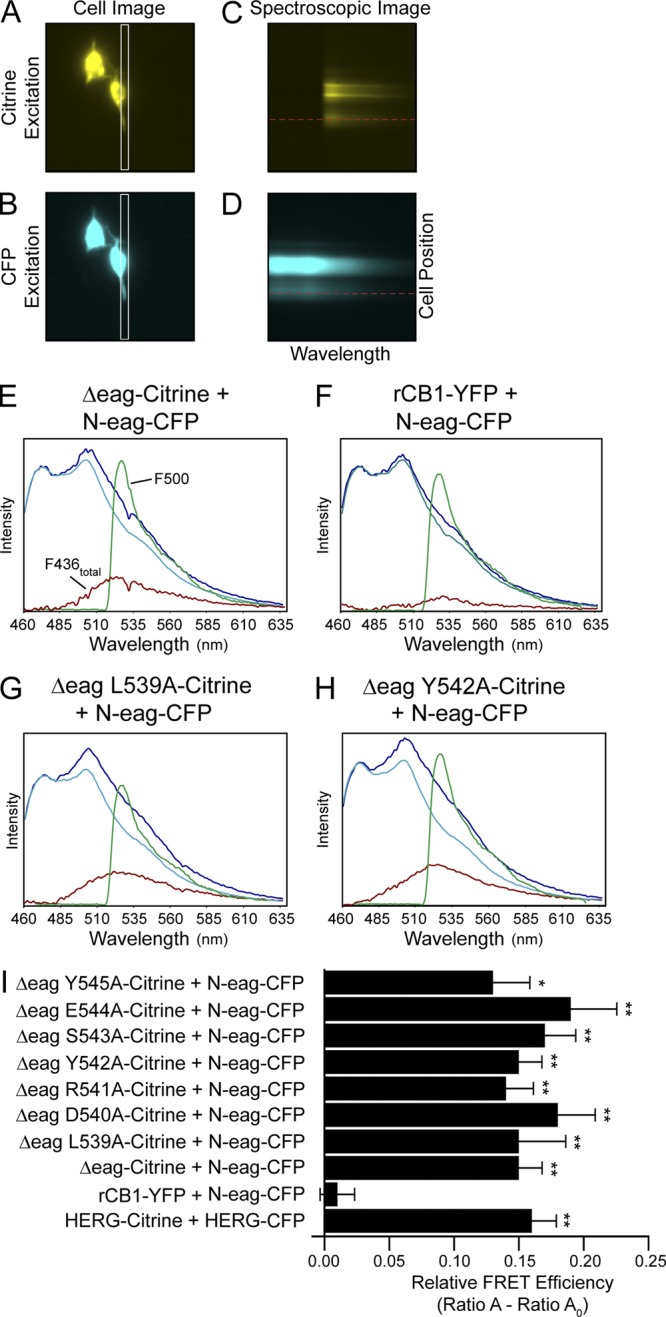
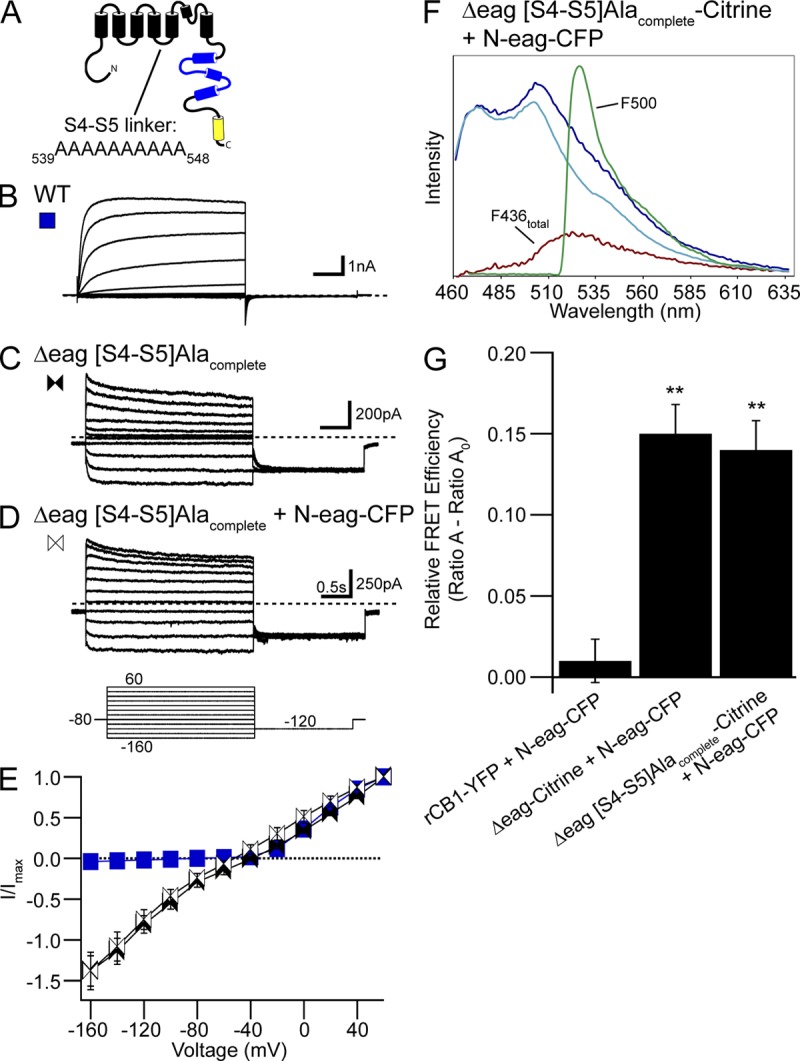
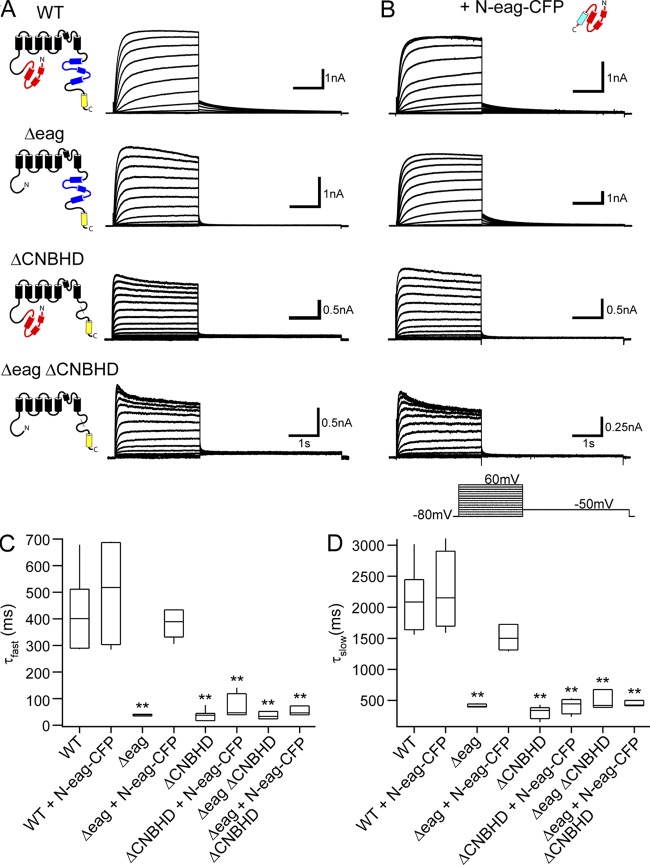
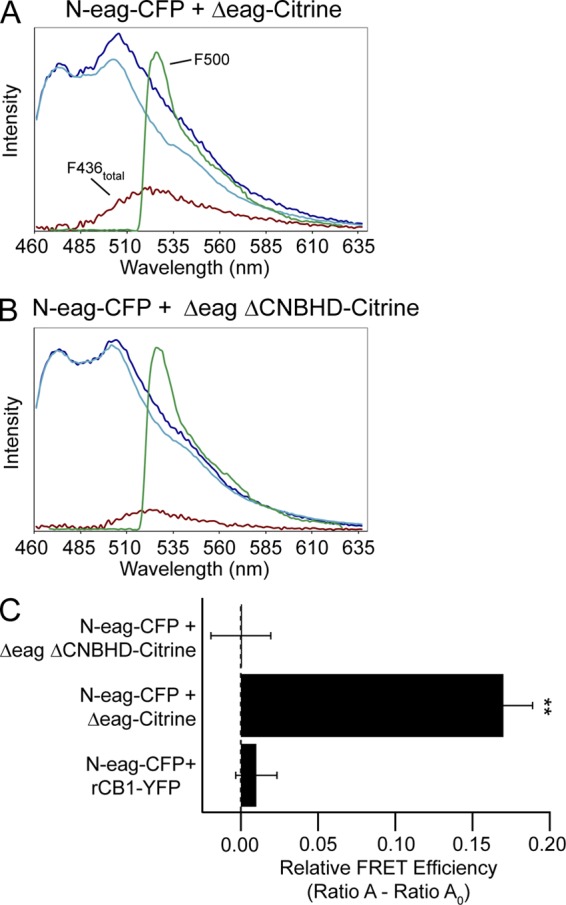
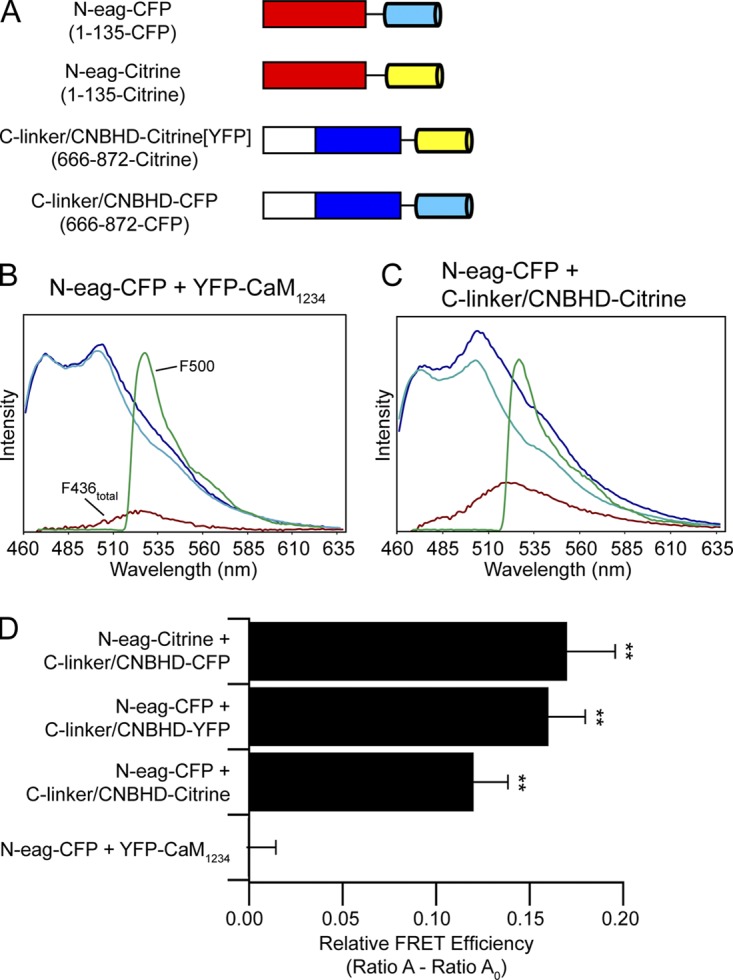
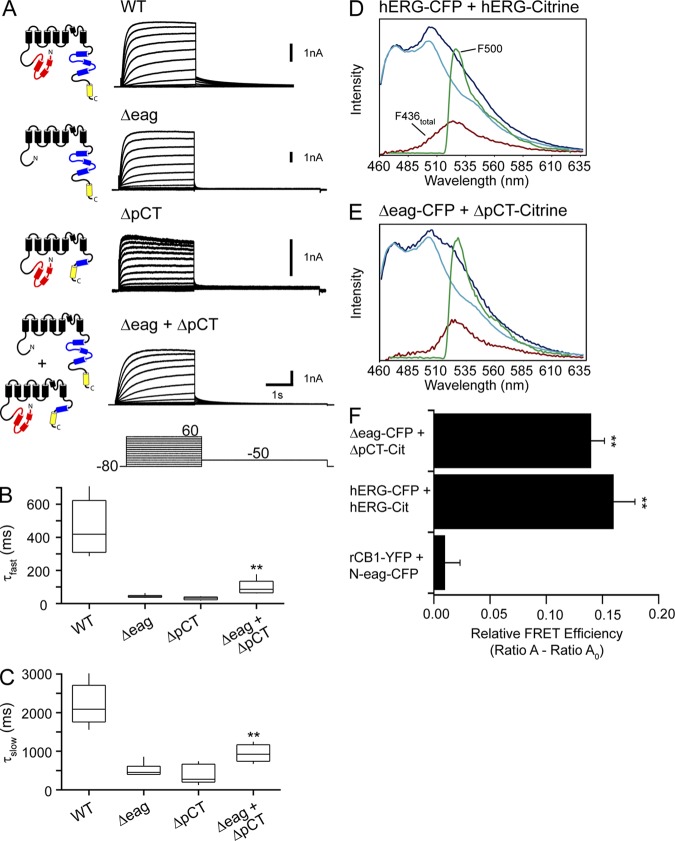
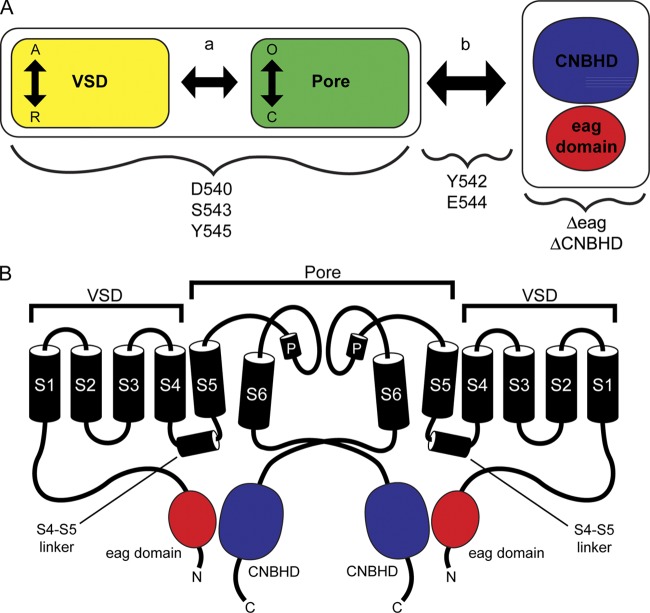
Human ether-á-go-go (eag)-related gene (hERG) potassium channels play a critical role in cardiac repolarization and are characterized by unusually slow closing (deactivation) kinetics. The N-terminal "eag" domain and a C-terminal C-linker/cyclic nucleotide-binding homology domain (CNBHD) are required for regulation of slow deactivation. The region between the S4 and S5 transmembrane domains (S4-S5 linker) is also implicated in this process, but the mechanism for regulation of slow deactivation is unclear. Here, using an eag domain-deleted channel (hERG Δeag) fused to Citrine fluorescent protein, we found that most channels bearing individual alanine mutations in the S4-S5 linker were directly regulated by recombinant eag domains fused to a cyan fluorescent protein (N-eag-CFP) and had robust Förster resonance energy transfer (FRET). Additionally, a channel bearing a group of eight alanine residues in the S4-S5 linker was not measurably regulated by N-eag-CFP domains, but robust FRET was measured. These findings demonstrate that the eag domain associated with all of the S4-S5 linker mutant channels. In contrast, channels that also lacked the CNBHD (hERG Δeag ΔCNBHD-Citrine) were not measurably regulated by N-eag-CFP nor was FRET detected, suggesting that the C-linker/CNBHD was required for eag domains to directly associate with the channel. In a FRET hybridization assay, N-eag-CFP had robust FRET with a C-linker/CNBHD-Citrine, suggesting a direct and specific interaction between the eag domain and the C-linker/CNBHD. Lastly, coexpression of a hERG subunit lacking the CNBHD and the distal C-terminal region (hERG ΔpCT-Citrine) with hERG Δeag-CFP subunits had FRET and partial restoration of slow deactivation. Collectively, these findings reveal that the C-linker/CNBHD, but not the S4-S5 linker, was necessary for the eag domain to associate with the channel, that the eag domain and the C-linker/CNBHD were sufficient for a direct interaction, and that an intersubunit interaction between the eag domain and the C-linker/CNBHD regulated slow deactivation in hERG channels at the plasma membrane.


Figures

Figure 1.
Figure 1.
Schematic of the hERG potassium channel highlighting the S4–S5 linker. The eag domain is shown in red, and the CNBHD is shown in blue. The point mutation, S620T, is indicated. The intracellular loop between the S4 and S5 transmembrane domains, referred to as the “S4–S5 linker,” consists of ∼10 amino acids beginning with L539 and ending with A548.
Figure 2.
Figure 2.
N-eag-CFP regulates deactivation gating in most of the hERG [S4–S5]Alaind mutant channels. Representative current recordings from HEK293 cells expressing each hERG Δeag [S4–S5]Alaind (A) alone or (B) coexpressed with N-eag-CFP. The voltage command protocol used to record ionic currents is shown on the bottom; the inset represents the voltage command protocol used to record hERG Δeag D540A alone and with N-eag-CFP coexpression. (C and D) G-V relationships for each hERG Δeag [S4–S5]Alaind mutant channel alone and with N-eag-CFP coexpression. Plotted points were fit with a Boltzmann function to yield the V1/2 and k values (averaged data are given in Table S1). (C) The G-V relationships for each hERG Δeag [S4–S5]Alaind mutant channel, except for hERG Δeag D540A. (D) The G-V relationship for hERG Δeag D540A. Blue squares represent the G-V relationship for WT hERG in both C and D. n ≥ 3 for each. (E and F) Box plots of the time constants of deactivation derived from a double-exponential fit to the tail current produced during the −50-mV pulse from 60 mV to yield the τfast values (E) and the τslow values (F). The middle line is the mean, the top and bottom lines are the 75th and 25th percentile, respectively, and the straight lines are the 90th and 10th percentiles. (G) Box plot of the time constants of deactivation at −100 mV for hERG Δeag D540A alone and with N-eag-CFP coexpression. Tail currents produced during the −100-mV pulse from 60 mV were fit with a double-exponential function to yield the τfast and τslow values. Blue squares represent the τfast and τslow for WT hERG in E–G. n ≥ 4 for each. All data are plotted as mean ± SEM. *, P < 0.05; **, P < 0.01 (ANOVA).
Figure 3.
Figure 3.
FRET spectroscopy shows that individual mutations in the hERG S4–S5 linker do not disrupt eag domain association with the channel. A single HEK293 cell expressing hERG Δeag-Citrine + N-eag-CFP was imaged with either (A) Citrine excitation at 500 nm or (B) CFP excitation at 436 nm. The spectrographic input slit (A and B, white rectangle) was positioned over a region of the cell that corresponded to the plasma membrane, and spectroscopic images were taken from the area within the slit with excitation of either Citrine (C) or CFP (D). In each spectroscopic image, the x axis represents the wavelength, and the y axis represents the position of the cell within the slit. A horizontal line drawn across each spectroscopic image (C and D, red line) indicates the region from which the emission spectra were measured, which are plotted in E. Representative emission spectra from HEK293 cells expressing (E) hERG Δeag-Citrine + N-eag-CFP, (F) rCB1-YFP + N-eag-CFP, (G) hERG Δeag L539A-Citrine + N-eag-CFP, or (H) hERG Δeag Y542A-Citrine + N-eag-CFP. The total emission spectrum from excitation at 436 nm is shown in dark blue. The extracted spectrum (red trace, F436total) is the CFP emission (cyan trace) subtracted from the total emission spectrum and contains the Citrine emission with excitation at 436 nm. The green trace is the Citrine emission with excitation at 500 nm (F500). Ratio A was determined as the ratio of the red trace (F436total) to the green trace (F500). As a control, cells expressing acceptor only (Citrine or YFP constructs) were excited at 436 nm (F436) and at 500 nm (F500), and Ratio A0 was calculated as the ratio of F436 emission to F500 emission. (I) Histogram of Ratio A–Ratio A0 values, a value that is directly proportional to the relative FRET efficiency (averaged data are also given in Table S3). Data are presented as mean ± SEM. *, P < 0.05 versus rCB1-YFP + N-eag-CFP; **, P < 0.01 versus rCB1-YFP + N-eag-CFP (ANOVA). n ≥ 6 for each.
Figure 4.
Figure 4.
Replacement of the hERG S4–S5 linker with alanines disrupted eag domain regulation of gating but not interaction with the channel. (A) hERG channel schematic illustrating the hERG Δeag[S4–S5]Alacomplete mutant channel in which all the residues in the S4–S5 linker were replaced with alanines. Representative current recordings from cells expressing (B) WT hERG, (C) hERG Δeag[S4–S5]Alacomplete, or (D) hERG Δeag[S4–S5]Alacomplete + N-eag-CFP. The inset represents the voltage command protocol used to record the currents. (E) I-V relationships for WT hERG and hERG Δeag[S4–S5]Alacomplete with or without N-eag-CFP expression. Data are plotted as mean ± SEM. n ≥ 4 for each. (F) Representative emission spectra from cells expressing hERG Δeag[S4–S5]Alacomplete-Citrine + N-eag-CFP. The emission spectra are color-coded as follows: dark blue trace, total emission with 436-nm excitation; cyan trace, CFP emission with 436-nm excitation; red trace, subtracted spectrum (difference between the cyan and the dark blue traces), which contains Citrine emission with 436-nm excitation; green trace, Citrine emission with 500-nm excitation. (G) Histogram of Ratio A–Ratio A0 values. Data are presented as mean ± SEM and are given in Table S3. **, P < 0.01 versus rCB1-YFP + N-eag-CFP (ANOVA). n ≥ 10 for each.
Figure 5.
Figure 5.
Regulation of slow deactivation by the eag domain requires the presence of the CNBHD in the hERG C-terminal region. Representative current recordings from HEK293 cells expressing WT hERG, hERG Δeag, hERG ΔCNBHD, or hERG Δeag ΔCNBHD in the absence (A) or presence (B) of N-eag-CFP domains. The inset represents the voltage command protocol used. (C and D) Box plots of the time constants of deactivation at −50 mV. Tail currents produced during the −50-mV pulse from 60 mV were fit with a double-exponential function to yield the τfast (C) and τslow (D) time constants of deactivation. The middle line represents the mean, the top and bottom lines represent the 75th and 25th percentiles, respectively, and the straight lines represent the 90th and 10th percentiles. **, P < 0.01 versus WT hERG (ANOVA). n ≥ 3 for each.
Figure 6.
Figure 6.
FRET spectroscopy reveals that association of the eag domain with the channel requires the CNBHD in the hERG C-terminal region. Representative emission spectra from cells expressing (A) N-eag-CFP + hERG Δeag-Citrine and (B) N-eag-CFP + hERG Δeag ΔCNBHD-Citrine. The dark blue trace represents the total emission spectrum with excitation at 436 nm. The cyan trace is the CFP emission with excitation at 436 nm taken from cells expressing donor only (N-eag-CFP). The red trace represents the Citrine emission with excitation at 436 nm (F436total) and was calculated by subtracting the cyan trace from the dark blue trace. The green trace represents the Citrine emission with excitation at 500 nm (F500). (C) Histogram of Ratio A–Ratio A0 values, which are proportional to the relative FRET efficiency. Data are plotted as mean ± SEM and are also given in Table S3. **, P < 0.01 versus N-eag-CFP + rCB1-YFP (ANOVA). n = 11 for each.
Figure 7.
Figure 7.
FRET two-hybrid analysis reveals that the eag domain directly interacts with the CNBHD. (A) Schematic illustrating hERG gene fragments used in the FRET two-hybrid assay. CFP is shown in cyan, and Citrine (or YFP) is shown in yellow. Representative emission spectra from cells expressing the bait-prey pairs (B) N-eag-CFP + YFP-CaM1234 or (C) N-eag-CFP + C-linker/CNBHD-Citrine. The dark blue trace represents the total emission spectrum with 436-nm excitation. The cyan trace represents the CFP emission with 436-nm excitation taken from cells expressing “bait” only (N-eag-CFP). The red trace is the subtracted spectrum (difference between the dark blue and cyan traces) and represents the Citrine emission with 436-nm excitation. The green trace represents Citrine emission with 500-nm excitation. (D) Histogram of Ratio A–Ratio A0 values of each bait-prey pair. Data are plotted as mean ± SEM and are given in Table S3. **, P < 0.01 versus N-eag-CFP + YFP-CaM1234 (ANOVA). n ≥ 6 for each.
Figure 8.
Figure 8.
hERG Δeag and hERG ΔpCT subunits form heterotetrameric channels. (A) Representative current recordings from cells expressing WT hERG, hERG Δeag, hERG ΔpCT, or hERG Δeag + hERG ΔpCT. The voltage command protocol used to elicit the ionic currents is shown. (B and C) Box plots of time constants of deactivation at −50 mV. Tail currents produced during the −50-mV pulse from 60 mV were fit with a double-exponential function to yield the τfast (B) and τslow (C) time constants of deactivation. **, P < 0.01 versus hERG Δeag alone and hERGΔpCT alone (ANOVA). n ≥ 5 for each. Representative emission spectra from cells expressing (D) hERG-CFP + hERG-Citrine or (E) hERG Δeag-CFP + hERG ΔpCT-Citrine. In both D and E, the emission spectra are color-coded as follows: dark blue trace, total emission with 436-nm excitation; cyan trace, CFP emission with 436-nm excitation; red trace, subtracted spectrum (difference between the cyan and the dark blue traces), which contains Citrine emission with 436-nm excitation; green trace, Citrine emission with 500-nm excitation. (F) Histogram of the Ratio A–Ratio A0 values. Data are plotted as mean ± SEM and are given in Table S3. **, P < 0.01 versus rCB1-YFP + N-eag-CFP (ANOVA). n ≥ 9 for each.
Figure 9.
Figure 9.
Model of eag domain–dependent regulation of gating. (A) Schematic illustrating the proposed mechanism of hERG channel slow deactivation gating. The VSD module (VSD or S1–S4 transmembrane domains; yellow rectangle) is coupled (arrow a) to the pore module (S5-P-S6 domains; green rectangle). Vertical arrows depict movement between the active (A) and resting (R) state of the VSD and the closed (C) or open state (O) of the pore. Together, the VSD and pore modules are coupled (arrow b) to the interdomain interaction between the C-terminal C-linker/CNBHD (blue) and the N-terminal eag domain (red). Deletion of either the eag domain or the CNBHD disrupts the eag domain–C-linker/CNBHD interaction and its regulation of gating at the channel pore. Residues in the S4–S5 linker, such as D540, S543, and Y545, primarily alter gating by influencing the VSD and pore modules, whereas residues such as Y542 and E544 are primarily involved in the coupling pathway (arrow b) between the eag domain–C-linker/CNBHD interaction and the channel pore. (B) Two hERG subunits indicating that eag domain–dependent regulation of gating occurs through a direct intersubunit interaction between the N-terminal eag domain (red) and the C-terminal CNBHD (blue).

Comment in

  • Domain-domain interactions in ion channels.
    Zheng J. Zheng J. J Gen Physiol. 2013 Oct;142(4):347-50. doi: 10.1085/jgp.201311090. Epub 2013 Sep 16. J Gen Physiol. 2013. PMID: 24043858 Free PMC article. No abstract available.

Similar articles

Cited by

References

    1. Alonso-Ron C., de la Peña P., Miranda P., Domínguez P., Barros F. 2008. Thermodynamic and kinetic properties of amino-terminal and S4-S5 loop HERG channel mutants under steady-state conditions. Biophys. J. 94:3893–3911 10.1529/biophysj.107.116731 - DOI - PMC - PubMed
    1. Al-Owais M., Bracey K., Wray D. 2009. Role of intracellular domains in the function of the herg potassium channel. Eur. Biophys. J. 38:569–576 10.1007/s00249-009-0408-2 - DOI - PubMed
    1. Brelidze T.I., Carlson A.E., Zagotta W.N. 2009. Absence of direct cyclic nucleotide modulation of mEAG1 and hERG1 channels revealed with fluorescence and electrophysiological methods. J. Biol. Chem. 284:27989–27997 10.1074/jbc.M109.016337 - DOI - PMC - PubMed
    1. Brelidze T.I., Carlson A.E., Sankaran B., Zagotta W.N. 2012. Structure of the carboxy-terminal region of a KCNH channel. Nature. 481:530–533 10.1038/nature10735 - DOI - PMC - PubMed
    1. Chen J., Zou A., Splawski I., Keating M.T., Sanguinetti M.C. 1999. Long QT syndrome-associated mutations in the Per-Arnt-Sim (PAS) domain of HERG potassium channels accelerate channel deactivation. J. Biol. Chem. 274:10113–10118 10.1074/jbc.274.15.10113 - DOI - PubMed

Publication types

MeSH terms