. 2013 Oct 15;191(8):4367-74.
doi: 10.4049/jimmunol.1300038. Epub 2013 Sep 16.

The complement anaphylatoxin C5a receptor contributes to obese adipose tissue inflammation and insulin resistance

Affiliations

The complement anaphylatoxin C5a receptor contributes to obese adipose tissue inflammation and insulin resistance

Julia Phieler et al. J Immunol. .

Abstract

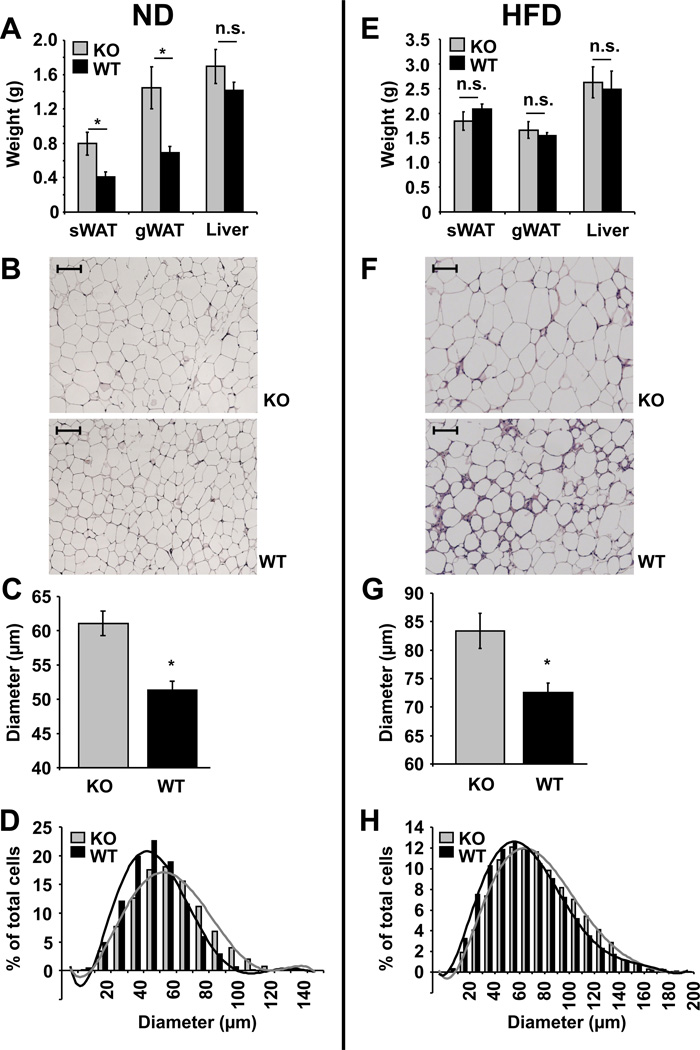
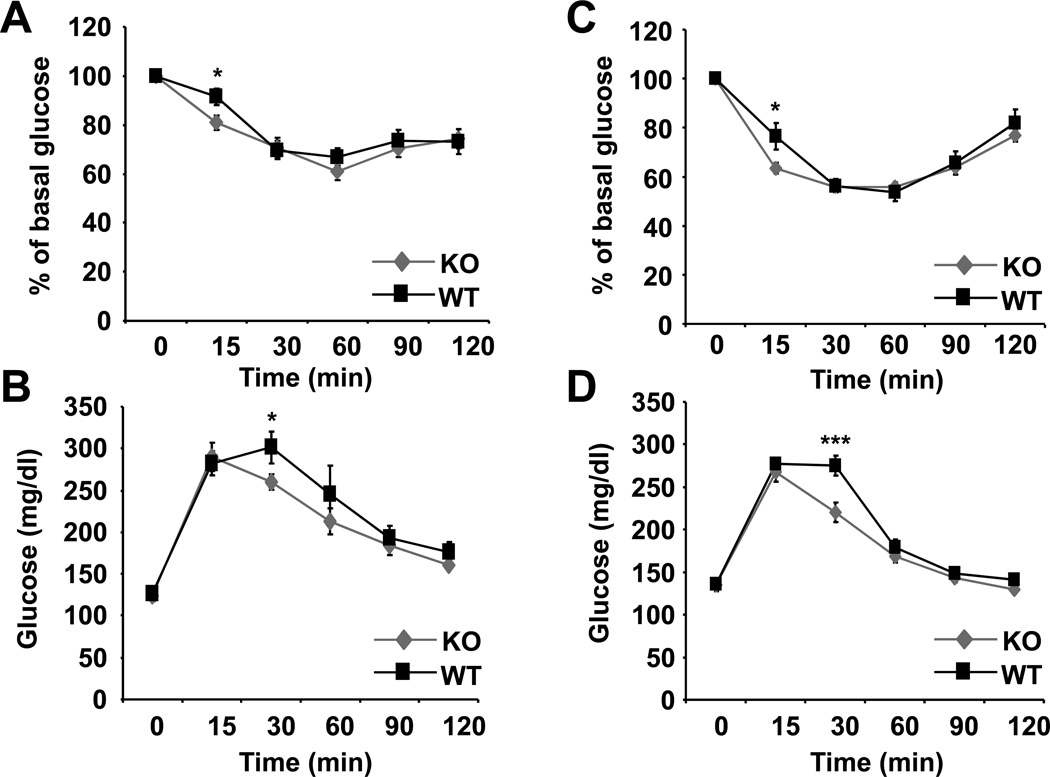
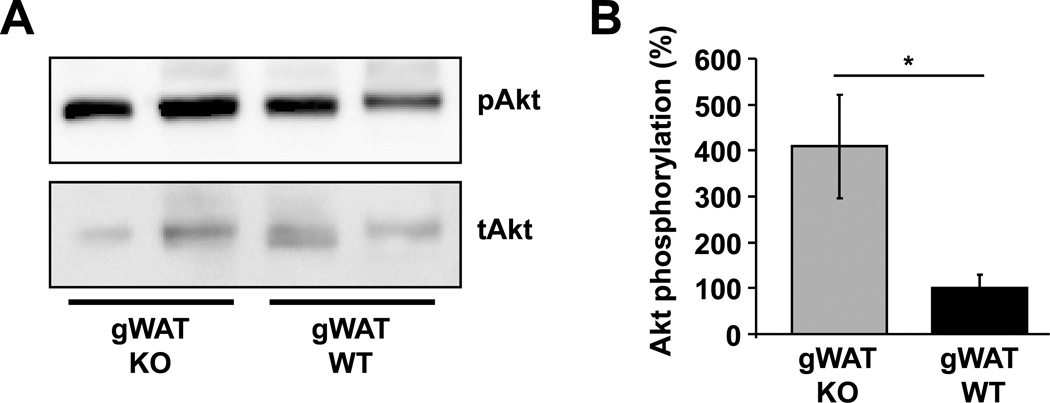
Obese adipose tissue (AT) inflammation contributes critically to development of insulin resistance. The complement anaphylatoxin C5a receptor (C5aR) has been implicated in inflammatory processes and as regulator of macrophage activation and polarization. However, the role of C5aR in obesity and AT inflammation has not been addressed. We engaged the model of diet-induced obesity and found that expression of C5aR was significantly upregulated in the obese AT, compared with lean AT. In addition, C5a was present in obese AT in the proximity of macrophage-rich crownlike structures. C5aR-sufficient and -deficient mice were fed a high-fat diet (HFD) or a normal diet (ND). C5aR deficiency was associated with increased AT weight upon ND feeding in males, but not in females, and with increased adipocyte size upon ND and HFD conditions in males. However, obese C5aR(-/-) mice displayed improved systemic and AT insulin sensitivity. Improved AT insulin sensitivity in C5aR(-/-) mice was associated with reduced accumulation of total and proinflammatory M1 macrophages in the obese AT, increased expression of IL-10, and decreased AT fibrosis. In contrast, no difference in β cell mass was observed owing to C5aR deficiency under an HFD. These results suggest that C5aR contributes to macrophage accumulation and M1 polarization in the obese AT and thereby to AT dysfunction and development of AT insulin resistance.


Figures

Fig. 1
Fig. 1. The role of C5aR in diet-induced obesity
A) RNA from gWAT of male WT mice fed a ND or a HFD (grey bars) for up to 26 weeks was extracted. The respective C5aR mRNA expression was normalized against 18s. Data are displayed as mean ± SEM (n = 3–5 mice/group) and are shown as percentage of control. C5aR expression of lean gWAT (i.e. under ND conditions) at the respective time point represents the 100% control. *P ≤ 0.05; **P ≤ 0.01. B) Representative IHC of gWAT from male wildtype mice fed a ND or HFD for 18 weeks stained for C5a (red) and haematoxylin (blue) are depicted. Left panels: negative control; right panels: samples stained with anti-C5a antibody. Arrows indicate C5a-positive staining. The majority of the diffuse C5a staining is localized to macrophage-rich crown-like structures. Scale bars represent 100 µm. C–D) C5aR-deficient (KO) or –sufficient (WT) male mice were fed a ND or a HFD (n = 7–19/group). C) The absolute body weight in grams is shown. Data are displayed as mean ± SEM. *P ≤ 0.05. D) The difference of body weight gain in grams is shown. Data are displayed as mean ± SEM. The weight difference between the two groups under ND conditions was significant starting in the 5th week of feeding and remained significant through the end of the experiment. *P ≤ 0.05. E–F) C5aR-deficient (KO) or –sufficient (WT) female mice were fed a ND or a HFD (n = 5–17/group). E) The absolute body weight in grams is shown. Data are displayed as mean ± SEM. F) The difference of body weight gain in grams is shown. Data are displayed as mean ± SEM.
Fig. 2
Fig. 2. C5aR-deficient male mice have increased adipocyte size of the gWAT
A) Tissue weights of subcutaneous (s) WAT, gonadal (g) WAT or livers from male C5aR-deficient (KO, grey bars) or –sufficient (WT, black bars) mice fed a ND for 28 weeks (n = 6 – 7) are depicted. Data are displayed as mean ± SEM. *P ≤ 0.05; n.s. = not significant. B) HE staining of gWAT from male C5aR−/− (KO) or WT mice fed a ND is shown. Scale bars represent 100 µm. C) and D) The adipocyte diameters from HE stained gWAT of C5aR-deficient (KO, grey bars) or – sufficient (WT, black bars) male mice fed a ND (n = 5) were measured. C) Mean diameter of adipocytes in µm is shown. Data are displayed as mean ± SEM. *P ≤ 0.05. D) Distribution of adipocytes based on their diameter in µm is shown (the cell number is shown as percentage of total cells counted). E) Tissue weights of sWAT, gWAT or livers from male C5aR-deficient (KO, grey bars) or –sufficient (WT, black bars) mice fed a HFD for 28 weeks (n = 4–5) are depicted. Data are displayed as mean ± SEM. n.s. = not significant. F) HE staining of gWAT from male C5aR−/− (KO) or WT mice fed a HFD for 20 weeks is shown. Scale bars represent 100 µm. G) and H) The adipocyte diameters from HE stained gWAT of C5aR-deficient (KO, grey bars) or –sufficient (WT, black bars) male mice fed a HFD for 20 weeks (n = 4) were measured. G) Mean diameter of adipocytes in µm is shown. Data are displayed as mean ± SEM. *P ≤ 0.05. H) Distribution of adipocytes based on their diameter in µm is shown (the cell number is shown as percentage of total cells counted).
Fig. 3
Fig. 3. C5aR-deficiency in obese mice results in mild improvement of insulin sensitivity
Insulin tolerance tests (ITT) and glucose tolerance (GTT) tests were performed as described in Material and Methods. A) ITT of C5aR-deficient (KO) or –sufficient (WT) male mice after 19 weeks on HFD is shown. The blood glucose values are displayed as percentage of basal glucose. B) GTT of C5aR-deficient (KO) or –sufficient (WT) male mice after 18 weeks on HFD is shown. The blood glucose values in mg/dl are shown. C) ITT of C5aR-deficient (KO) or –sufficient (WT) female mice after 17 weeks on HFD is shown. The blood glucose values are displayed as percentage of basal glucose. D) GTT of C5aR-deficient (KO) or –sufficient (WT) female mice after 16 weeks on HFD is shown. The blood glucose values in mg/dl are shown. Data are displayed as mean ± SEM; n = 8–17/group. *P ≤ 0.05; ***P ≤ 0.001.
Fig. 4
Fig. 4. C5aR deficiency leads to improved insulin sensitivity in obese gWAT
C5aR-sufficient (WT) or –deficient (KO) male mice fed a HFD for 28 weeks were fasted and then injected i.p. with insulin; after 8 min mice were euthanized, the gonadal (g) WAT was extracted and tissue lysates were analyzed for the phosphorylated Akt/total Akt ratio by western blot. A) Representative western blot analysis from gWAT of insulin-induced Akt phosphorylation, as well as of total Akt is shown. Membranes were stripped and re-probed with the total Akt antibody. B) Densitometric analysis from gWAT of phosphorylated Akt/total Akt is shown. Data are mean ± SEM (n = 4) and are shown as percentage of control. The phosphorylated Akt/total Akt ratio in the WT mice represents the 100% control. *P ≤ 0.05.
Fig. 5
Fig. 5. C5aR-deficiency results in reduced macrophage accumulation in the obese gonadal WAT
Representative IHC of gonadal WAT from male C5aR−/− (KO) or WT mice (20 weeks on HFD) stained for F4/80 and haematoxylin at 200× are depicted. Arrows indicate F4/80 positive macrophages. C5aR−/− mice have less macrophages and macrophage-related crown like structures as compared to C5aR-sufficient mice.
Fig. 6
Fig. 6. C5aR-deficiency results in reduced macrophage accumulation and M1 polarization in the obese WAT
The stromal vascular fraction of subcutaneous (s) WAT and gonadal (g) WAT from C5aR-deficient (KO; grey bars) or –sufficient (WT; black bars) male mice fed a HFD for 20 weeks (n = 8–9/group) was analyzed by flow cytometry. The absolute cell numbers of A) total leukocytes (CD45+CD31); B) total macrophages (F4/80+CD11b+); C) M1-macrophages, characterized as F4/80+CD11b+CD11c+; D) M1-macrophages, characterized as F4/80+CD11c+CD206; E) M2-macrophages, characterized as F4/80+CD11cCD206+; F) pro-inflammatory “intermediate” M1/M2-type macrophages, characterized as F4/80+CD11c+CD206+; G) CD8+ T cells (CD3+CD4CD8+) and H) CD4+ T cells (CD3+CD4+CD8) are shown. Data are displayed as mean ± SEM. *P ≤ 0.05; **P ≤ 0.01; ***P ≤ 0.001; n.s. = not significant.

Similar articles

Cited by

References

    1. Schenk S, Saberi M, Olefsky JM. Insulin sensitivity: modulation by nutrients and inflammation. J Clin Invest. 2008;118:2992–3002. - PMC - PubMed
    1. Odegaard JI, Chawla A. Mechanisms of macrophage activation in obesity-induced insulin resistance. Nat Clin Pract Endocrinol Metab. 2008;4:619–626. - PMC - PubMed
    1. Weisberg SP, McCann D, Desai M, Rosenbaum M, Leibel RL, Ferrante AW., Jr Obesity is associated with macrophage accumulation in adipose tissue. J Clin Invest. 2003;112:1796–1808. - PMC - PubMed
    1. Weber C, Noels H. Atherosclerosis: current pathogenesis and therapeutic options. Nat Med. 2011;17:1410–1422. - PubMed
    1. Chatzigeorgiou A, Karalis KP, Bornstein SR, Chavakis T. Lymphocytes in obesity-related adipose tissue inflammation. Diabetologia. 2012;55:2583–2592. - PubMed

Publication types

MeSH terms

LinkOut - more resources