

Human T cells upregulate CD69 after coculture with xenogeneic genetically-modified pig mesenchymal stromal cells
- PMID: 24044963
- PMCID: PMC3870890
- DOI: 10.1016/j.cellimm.2013.08.004
Human T cells upregulate CD69 after coculture with xenogeneic genetically-modified pig mesenchymal stromal cells
Abstract
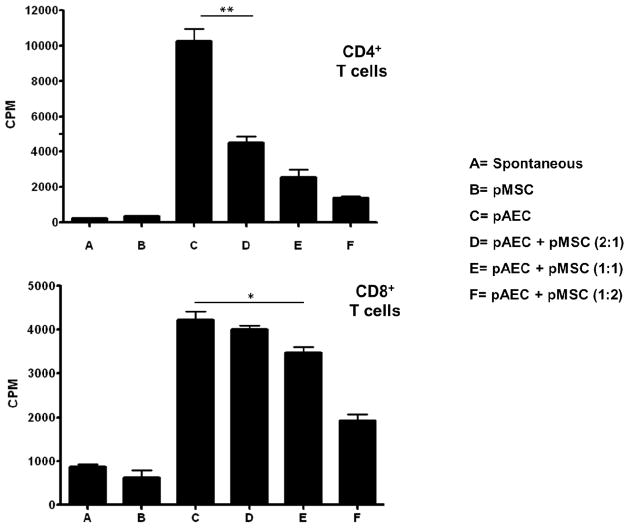
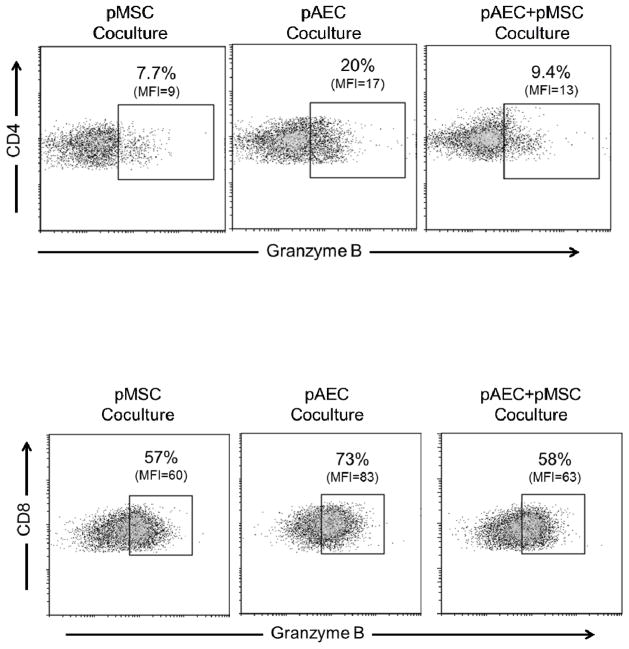
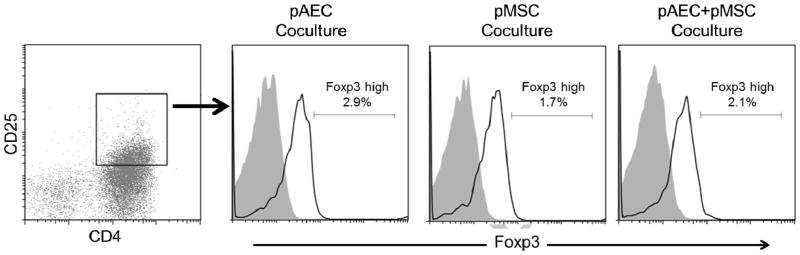
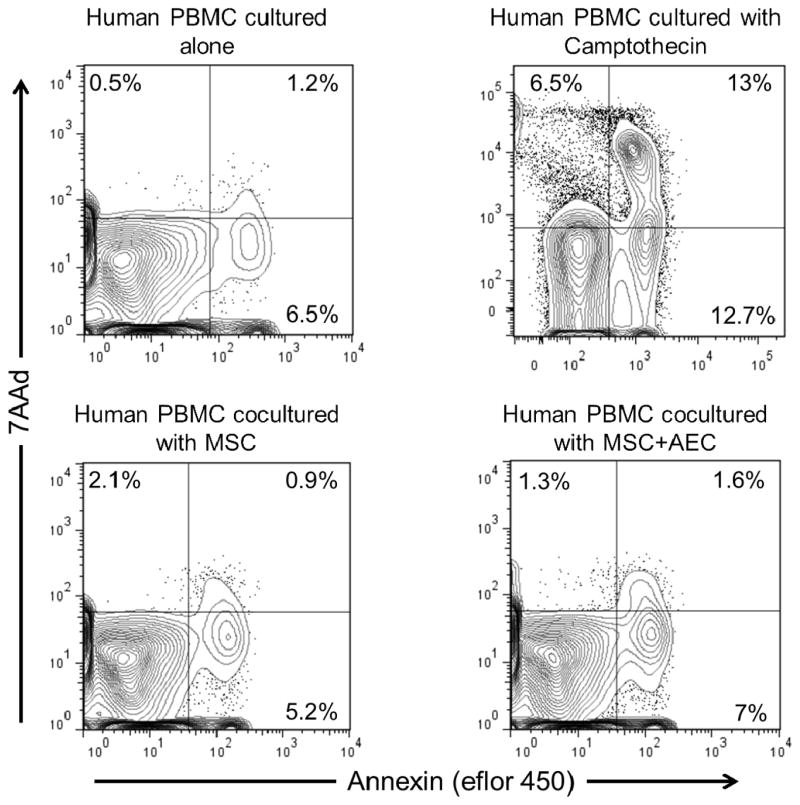
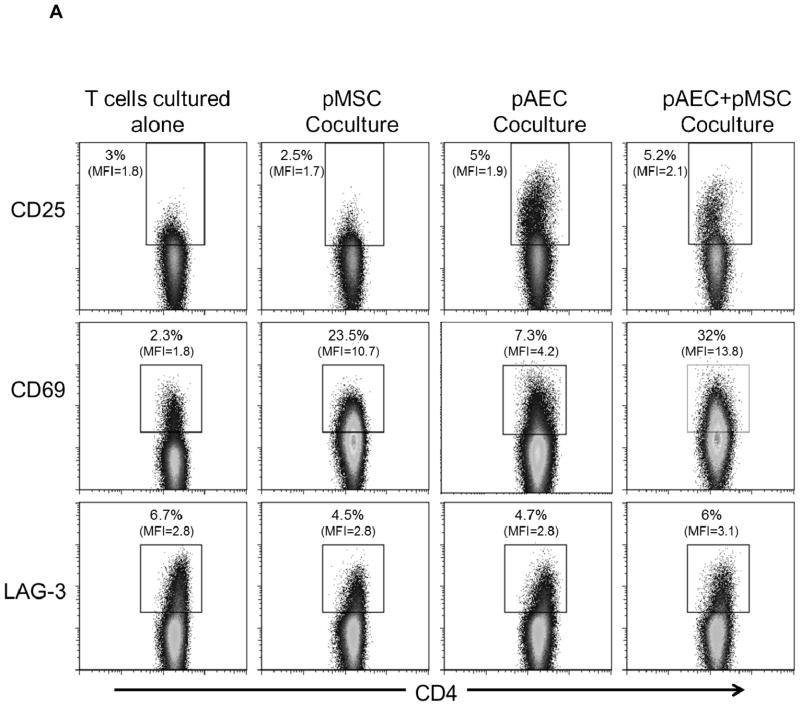
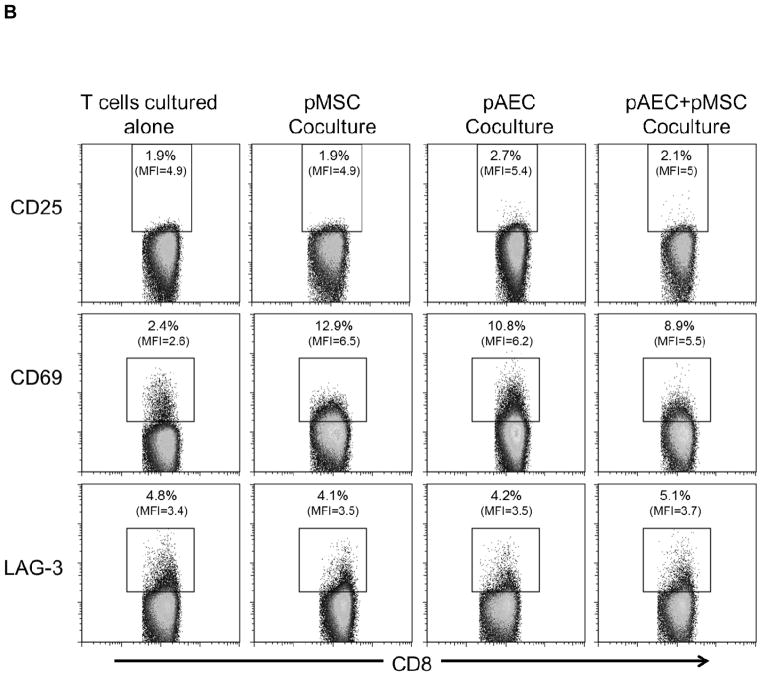
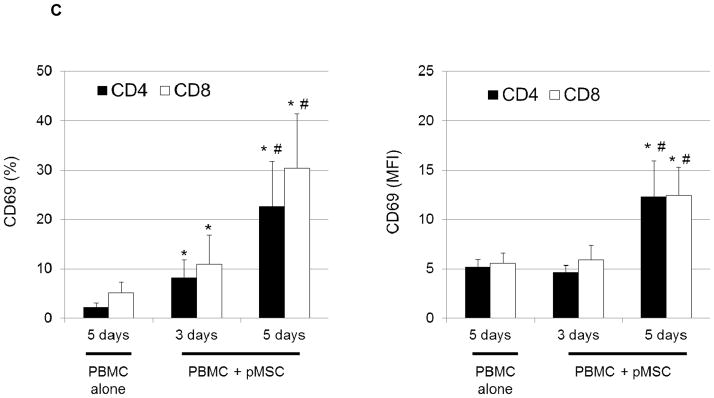
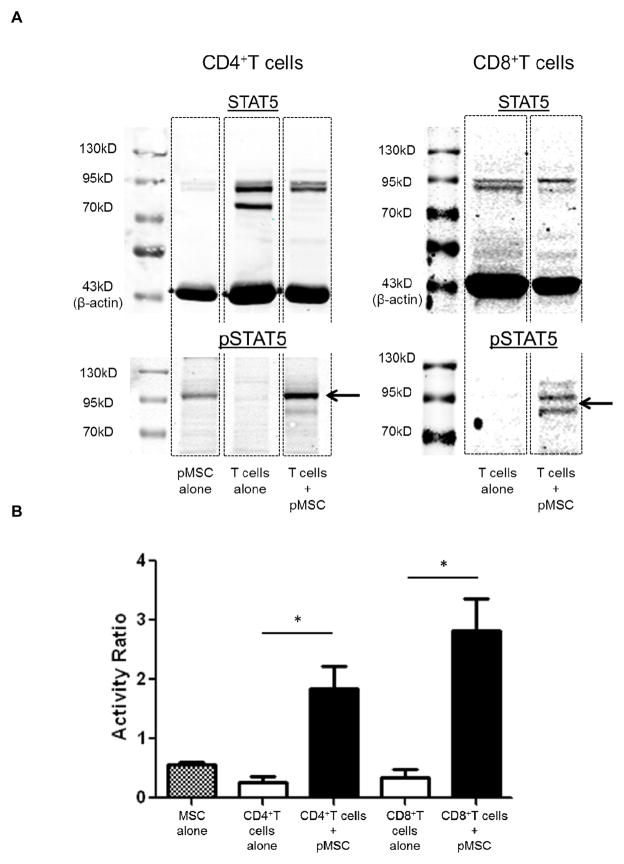
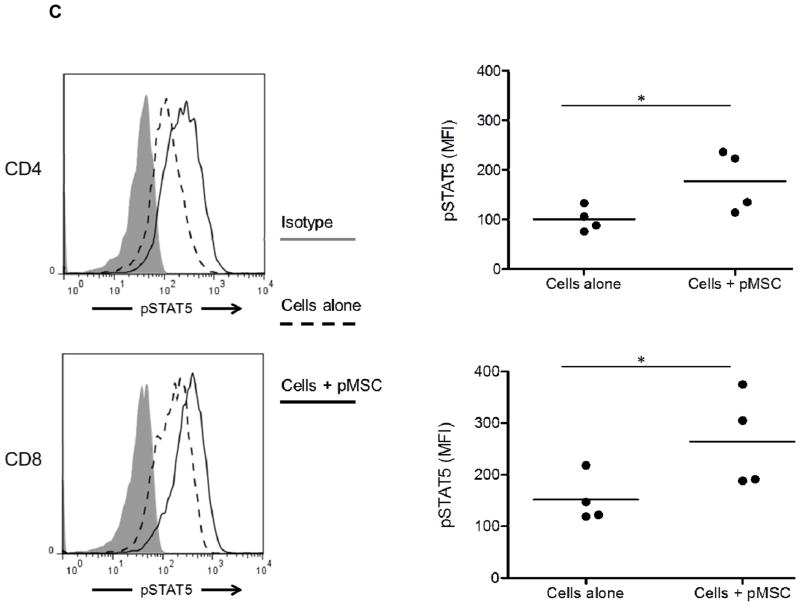
Mesenchymal stromal cells (MSC) obtained from α1,3-galactosyltransferase gene knock-out pigs transgenic for the human complement-regulatory protein CD46 (GTKO/CD46 pMSC) suppress in vitro human anti-pig cellular responses as efficiently as allogeneic human MSC. We investigated the immunoregulatory effects of GTKO/CD46 pMSC on human CD4(+) and CD8(+) T cell proliferation in response to pig aortic endothelial cells (pAEC). pMSC efficiently suppressed T cell proliferation, which was associated with downregulation of granzyme B expression. No induction of CD4(+)CD25(+)Foxp3(hi) regulatory T cells or T cell apoptosis was documented. In correlation with T cell proliferation, CD25 expression was upregulated on T cells in response to pAEC but not to pMSC. In contrast, CD69 expression was upregulated on T cells in response to both pMSC and pAEC, which was associated with a significant increase in the phosphorylation of STAT5. GTKO/CD46 pMSC possibly regulate human T cell responses through modulation of CD69 expression and STAT5 signaling.
Keywords: CD69; GTKO/CD46; GTKO/hCD46; Gal; LAG-3; Mesenchymal stem cells; PBMC; Pig; STAT5; T cells; Xenotransplantation; galactose-α1,3-galactose; lymphocyte activation gene-3; pAEC; pMSC; pSTAT5; peripheral blood mononuclear cells; phosphorylated signal transducer and activator of transcription 5; pig aortic endothelial cells; pig mesenchymal stromal cells; α1,3-galactosyltransferase gene-knockout/human CD46.
Copyright © 2013 Elsevier Inc. All rights reserved.
Conflict of interest statement
DA is an employee of Revivicor, Inc. No other author has a conflict of interest.
Figures
Similar articles
-
The potential role of genetically-modified pig mesenchymal stromal cells in xenotransplantation.Stem Cell Rev Rep. 2014 Feb;10(1):79-85. doi: 10.1007/s12015-013-9478-8. Stem Cell Rev Rep. 2014. PMID: 24142483 Free PMC article. Review.
-
Genetically-modified pig mesenchymal stromal cells: xenoantigenicity and effect on human T-cell xenoresponses.Xenotransplantation. 2011 May-Jun;18(3):183-95. doi: 10.1111/j.1399-3089.2011.00635.x. Xenotransplantation. 2011. PMID: 21696448
-
Adipose-derived mesenchymal stromal cells from genetically modified pigs: immunogenicity and immune modulatory properties.Cytotherapy. 2012 Apr;14(4):494-504. doi: 10.3109/14653249.2011.651529. Epub 2012 Jan 23. Cytotherapy. 2012. PMID: 22264190 Free PMC article.
-
Initial in vitro studies on tissues and cells from GTKO/CD46/NeuGcKO pigs.Xenotransplantation. 2016 Mar;23(2):137-50. doi: 10.1111/xen.12229. Epub 2016 Mar 14. Xenotransplantation. 2016. PMID: 26988899 Free PMC article.
-
Justification of specific genetic modifications in pigs for clinical organ xenotransplantation.Xenotransplantation. 2019 Jul;26(4):e12516. doi: 10.1111/xen.12516. Epub 2019 Apr 15. Xenotransplantation. 2019. PMID: 30989742 Free PMC article. Review.
Cited by
-
Reducing porcine corneal graft rejection, with an emphasis on porcine endogenous retrovirus transmission safety: a review.Int J Ophthalmol. 2019 Feb 18;12(2):324-332. doi: 10.18240/ijo.2019.02.21. eCollection 2019. Int J Ophthalmol. 2019. PMID: 30809491 Free PMC article. Review.
-
Immune Responses of HLA Highly Sensitized and Nonsensitized Patients to Genetically Engineered Pig Cells.Transplantation. 2018 May;102(5):e195-e204. doi: 10.1097/TP.0000000000002060. Transplantation. 2018. PMID: 29266033 Free PMC article.
-
Cytotoxic Responses Mediated by NK Cells and Cytotoxic T Lymphocytes in Xenotransplantation.Transpl Int. 2025 Feb 12;38:13867. doi: 10.3389/ti.2025.13867. eCollection 2025. Transpl Int. 2025. PMID: 40012743 Free PMC article. Review.
-
Quantitative Proteomic Analysis of Tibetan Pig Livers at Different Altitudes.Molecules. 2023 Feb 10;28(4):1694. doi: 10.3390/molecules28041694. Molecules. 2023. PMID: 36838681 Free PMC article.
-
The potential role of genetically-modified pig mesenchymal stromal cells in xenotransplantation.Stem Cell Rev Rep. 2014 Feb;10(1):79-85. doi: 10.1007/s12015-013-9478-8. Stem Cell Rev Rep. 2014. PMID: 24142483 Free PMC article. Review.
References
-
- Le Blanc K, Frassoni F, Ball L, Locatelli F, Roelofs H, Lewis I, Lanino E, Sundberg B, Bernardo ME, Remberger M, Dini G, Egeler RM, Bacigalupo A, Fibbe W, Ringden O. Mesenchymal stem cells for treatment of steroid-resistant, severe, acute graft-versus-host disease: a phase II study. Lancet. 2008;371:1579–1586. - PubMed
-
- Le Blanc K, Rasmusson I, Sundberg B, Gotherstrom C, Hassan M, Uzunel M, Ringden O. Treatment of severe acute graft-versus-host disease with third party haploidentical mesenchymal stem cells. Lancet. 2004;363:1439–1441. - PubMed
-
- Lu Y, Jin X, Chen Y, Li S, Yuan Y, Mai G, Tian B, Long D, Zhang J, Zeng L, Li Y, Cheng J. Mesenchymal stem cells protect islets from hypoxia/reoxygenation-induced injury. Cell biochemistry and function. 2010;28:637–643. - PubMed
-
- Rackham CL, Chagastelles PC, Nardi NB, Hauge-Evans AC, Jones PM, King AJ. Co-transplantation of mesenchymal stem cells maintains islet organisation and morphology in mice. Diabetologia. 2011;54:1127–1135. - PubMed
Publication types
MeSH terms
Substances
Grants and funding
LinkOut - more resources
Full Text Sources
Other Literature Sources
Research Materials
Miscellaneous
