. 2013 Nov;23(11):1817-28.
doi: 10.1101/gr.159426.113. Epub 2013 Sep 17.

Genome-wide evidence for speciation with gene flow in Heliconius butterflies

Affiliations

Genome-wide evidence for speciation with gene flow in Heliconius butterflies

Simon H Martin et al. Genome Res. 2013 Nov.

Abstract

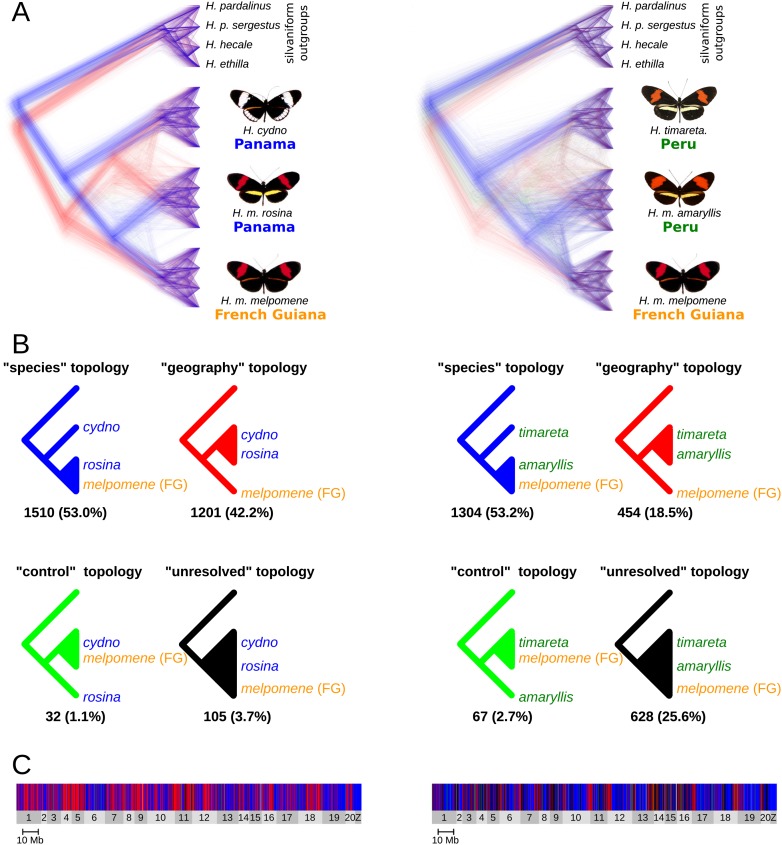
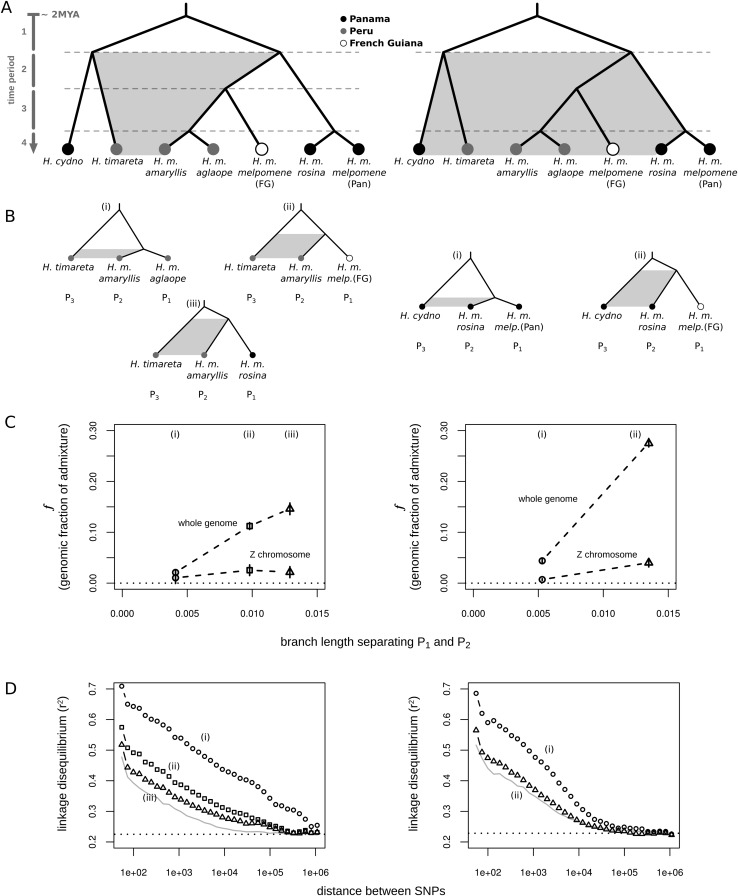
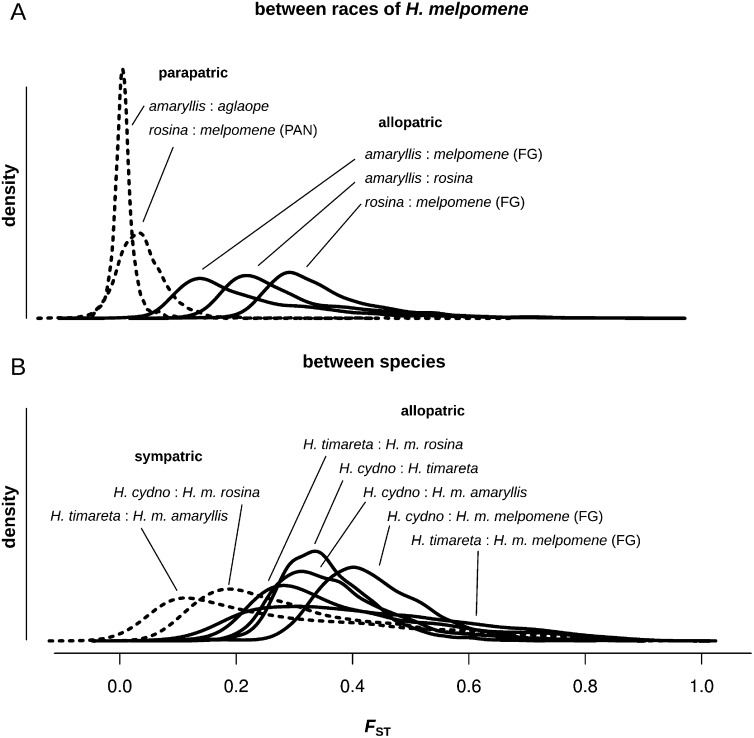
Most speciation events probably occur gradually, without complete and immediate reproductive isolation, but the full extent of gene flow between diverging species has rarely been characterized on a genome-wide scale. Documenting the extent and timing of admixture between diverging species can clarify the role of geographic isolation in speciation. Here we use new methodology to quantify admixture at different stages of divergence in Heliconius butterflies, based on whole-genome sequences of 31 individuals. Comparisons between sympatric and allopatric populations of H. melpomene, H. cydno, and H. timareta revealed a genome-wide trend of increased shared variation in sympatry, indicative of pervasive interspecific gene flow. Up to 40% of 100-kb genomic windows clustered by geography rather than by species, demonstrating that a very substantial fraction of the genome has been shared between sympatric species. Analyses of genetic variation shared over different time intervals suggested that admixture between these species has continued since early in speciation. Alleles shared between species during recent time intervals displayed higher levels of linkage disequilibrium than those shared over longer time intervals, suggesting that this admixture took place at multiple points during divergence and is probably ongoing. The signal of admixture was significantly reduced around loci controlling divergent wing patterns, as well as throughout the Z chromosome, consistent with strong selection for Müllerian mimicry and with known Z-linked hybrid incompatibility. Overall these results show that species divergence can occur in the face of persistent and genome-wide admixture over long periods of time.


Figures

Figure 1.
Figure 1.
Populations sampled and their phylogenetic relationships. The entire distribution of H. melpomene is shown in gray. The entire distribution of the H. cydno/timareta clade is shown with dots (Rosser et al. 2012). Colors depict distributions of races used in this study, with dots indicating the sampling locations, and correspond to the colored dots on the tree. The tree is a compressed version of the whole-genome ML tree (Supplemental Fig. S1). The three general sampling locations, Panama, Peru, and French Guiana, are indicated. The scale bar refers to the number of substitutions per site.
Figure 2.
Figure 2.
Four-taxon ML trees for 100-kb windows. (A) Trees were superimposed using DensiTree (Bouckaert 2010). There were 2848 trees for the H. cydnoH. melpomene data set (left) and 2453 for the H. timaretaH. melpomene data set (right). Tree lengths were equalized so that all trees could be superimposed, and then a random jitter was added to all branch lengths to show density. Trees supporting each of the four possible topologies are colored accordingly: blue for the species tree, red for the geography tree, green for the control tree, and black for unresolved trees. (B) The four topologies scored, along with the number and percentage of trees supporting each. See Supplemental Figure S3 for examples of trees assigned to each topology. (C) The distribution of the four topologies across the genome. Chromosomes are shaded light and dark gray. See Supplemental Figure S4 for an enlarged version.
Figure 3.
Figure 3.
Measuring admixture at different phylogenetic scales. (A) We can distinguish between admixture in different time periods as follows. If gene flow was ancient only (i.e., period 1), then H. m. amaryllis and H. m. rosina should both be equally admixed with H. timareta and H. cydno. However, if gene flow is more recent (i.e., period 2, 3, or 4), then H. m. amaryllis should be more admixed with Peruvian H. timareta, and H. m. rosina should be more admixed with Panamanian H. cydno. The same logic applies when quantifying admixture for a specific branch: If H. timareta shares more derived alleles with H. m. amaryllis than with H. m. aglaope, this skew must reflect gene flow between H. timareta and H. m. amaryllis that is more recent than the coalescence between H. m. amaryllis and H. m. aglaope (i.e., during period 4). (B) Our sampling allowed us to quantify admixture at three time scales between H. timareta and H. m. amaryllis, and two time scales between H. cydno and H. m. rosina. (C) The estimated fraction of admixture (f), plotted for the whole genome and the Z chromosome specifically against the estimated length of the time period being analyzed, calculated as the average branch length separating populations P1 and P2 in the genomic ML phylogeny (Supplemental Fig. S1). Vertical lines depict standard errors. (D) LD (r2) between shared-derived alleles in the P2 population (left, H. m. amaryllis; right, H. m. rosina), plotted as a function of distance on a logarithmic scale. The SNPs used to estimate LD were those carrying a shared derived allele in P2 and P3, while P1 was fixed for the ancestral state (i.e., an ABBA pattern, where the B alleles are not necessarily fixed). The gray line represents the average genomic LD level, and the dashed line shows the average LD among unlinked sites.
Figure 4.
Figure 4.
Genomic divergence along the speciation continuum. FST values were calculated for 100-kb windows sliding in increments of 20 kb. Chromosomes are shown with alternating light and dark shading. Point colors reflect the absolute level of FST to allow for comparison between plots. The locations of the wing pattern loci HmYb and HmB are indicated by arrows. (amaryllis) H. m. amaryllis; (rosina) H. m. rosina; (melpomene) H. m. melpomene; (cydno) H. c. chioneus; (timareta) H. t. thelxinoe; (Pan) Panama; (Per) Peru; (FG) French Guiana.
Figure 5.
Figure 5.
Density plots of pairwise FST values for non-overlapping 100-kb windows. All pairwise comparisons, corresponding to the plots in Figure 4, between races of H. melpomene (A), and between species (B).

Comment in

References

    1. Baxter SW, Nadeau NJ, Maroja LS, Wilkinson P, Counterman BA, Dawson A, Beltran M, Perez-Espona S, Chamberlain N, Ferguson L, et al. 2010. Genomic hotspots for adaptation: The population genetics of Müllerian mimicry in the Heliconius melpomene clade. PLoS Genet 6: 12 - PMC - PubMed
    1. Bouckaert RR 2010. DensiTree: Making sense of sets of phylogenetic trees. Bioinformatics 26: 1372–1373 - PubMed
    1. Bull V, Beltrán M, Jiggins CD, McMillan WO, Bermingham E, Mallet J 2006. Polyphyly and gene flow between non-sibling Heliconius species. BMC Biol 4: 11. - PMC - PubMed
    1. Chamberlain NL, Hill RI, Kapan DD, Gilbert LE, Kronforst MR 2009. Polymorphic butterfly reveals the missing link in ecological speciation. Science 326: 847–850 - PMC - PubMed
    1. Charlesworth B 1998. Measures of divergence between populations and the effect of forces that reduce variability. Mol Biol Evol 15: 538–543 - PubMed

Publication types