. 2013 Oct 16;32(20):2708-21.
doi: 10.1038/emboj.2013.204. Epub 2013 Sep 17.

Unlimited in vitro expansion of adult bi-potent pancreas progenitors through the Lgr5/R-spondin axis

Affiliations

Unlimited in vitro expansion of adult bi-potent pancreas progenitors through the Lgr5/R-spondin axis

Meritxell Huch et al. EMBO J. .

Abstract

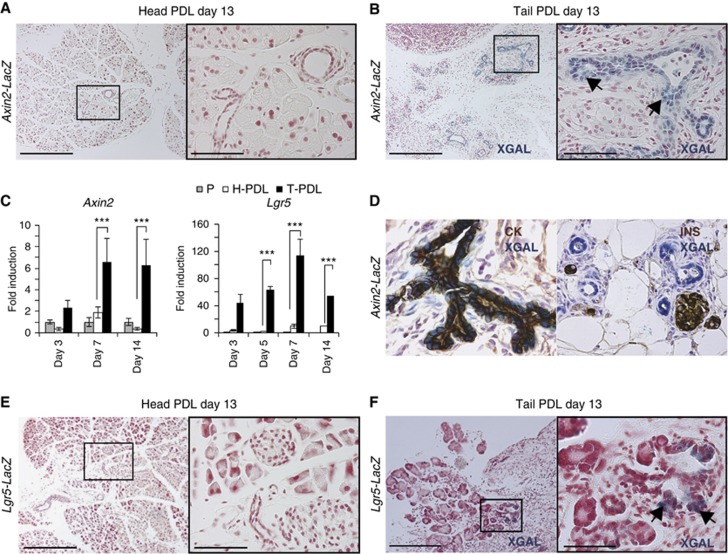
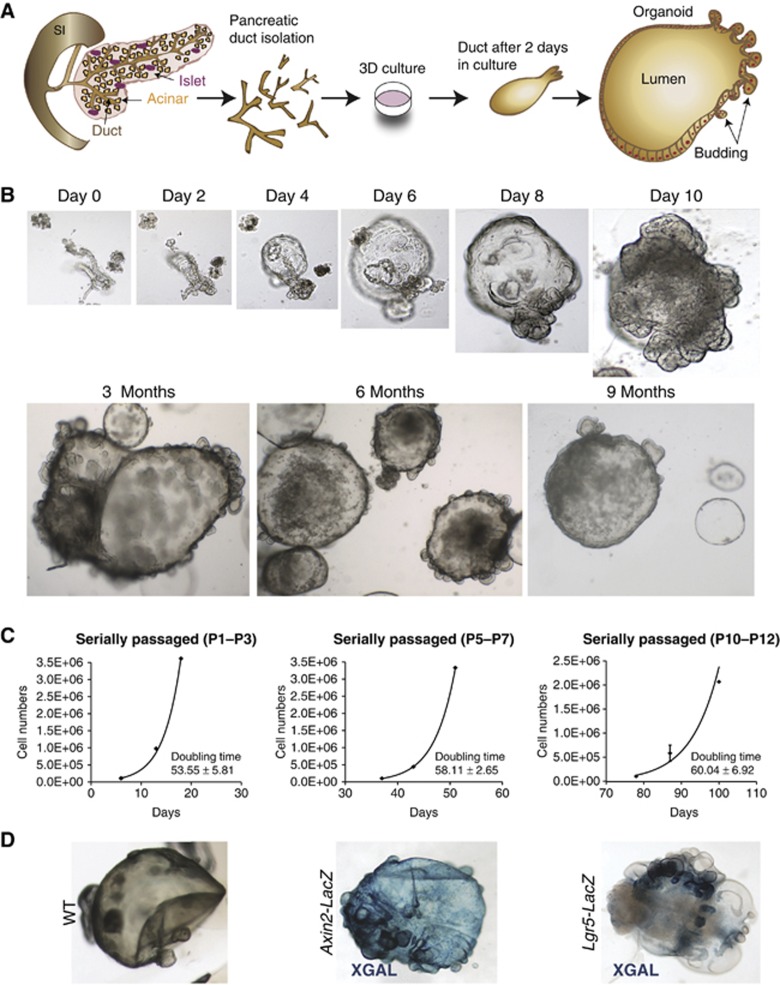
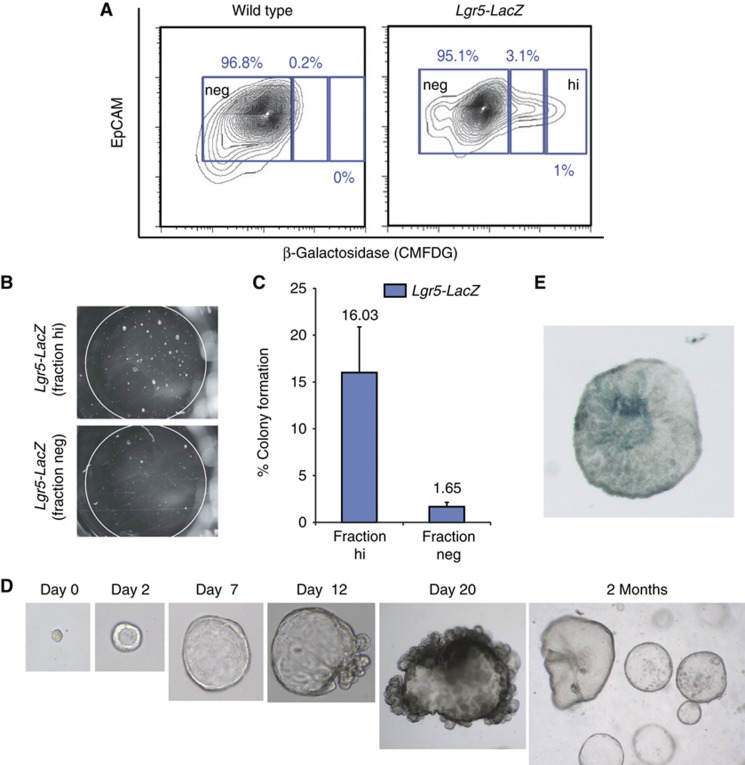
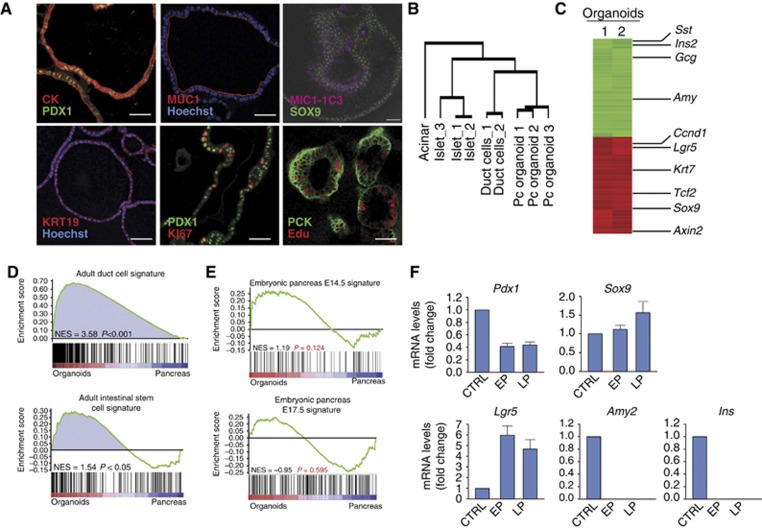
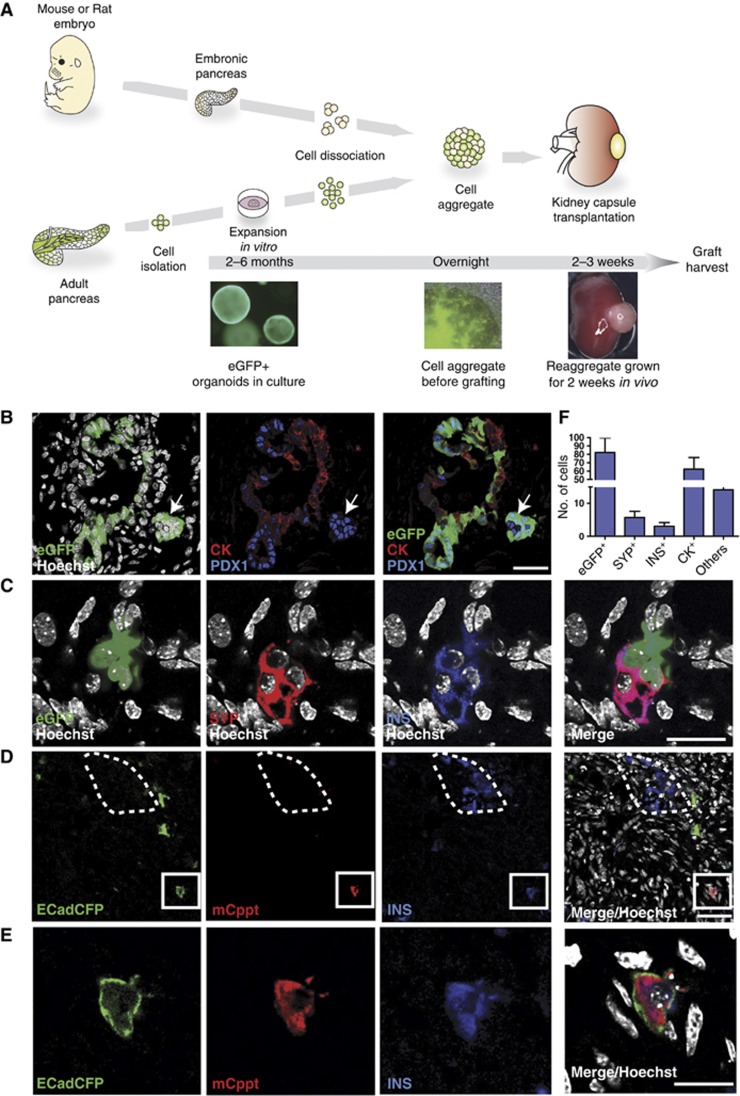
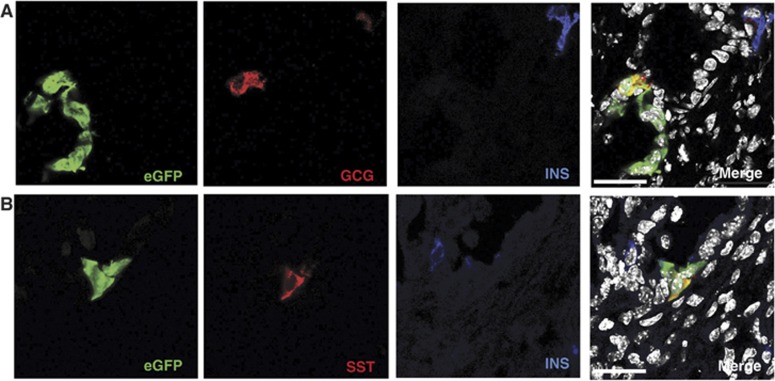
Lgr5 marks adult stem cells in multiple adult organs and is a receptor for the Wnt-agonistic R-spondins (RSPOs). Intestinal, stomach and liver Lgr5(+) stem cells grow in 3D cultures to form ever-expanding organoids, which resemble the tissues of origin. Wnt signalling is inactive and Lgr5 is not expressed under physiological conditions in the adult pancreas. However, we now report that the Wnt pathway is robustly activated upon injury by partial duct ligation (PDL), concomitant with the appearance of Lgr5 expression in regenerating pancreatic ducts. In vitro, duct fragments from mouse pancreas initiate Lgr5 expression in RSPO1-based cultures, and develop into budding cyst-like structures (organoids) that expand five-fold weekly for >40 weeks. Single isolated duct cells can also be cultured into pancreatic organoids, containing Lgr5 stem/progenitor cells that can be clonally expanded. Clonal pancreas organoids can be induced to differentiate into duct as well as endocrine cells upon transplantation, thus proving their bi-potentiality.


Conflict of interest statement

MH, TS and HC are inventors on a patent application related to this work.

Figures

Figure 1
Figure 1
Induction of Axin2 and Lgr5 expression upon damage on adult pancreas. (A, B) Axin2-LacZ induction in newly formed pancreatic ducts upon PDL. Axin2-LacZ mice (n=6) underwent PDL as explained in Materials and methods. Mice were sacrificed at the indicated time points and the non-ligated pancreatic tissue (Head-PDL) was separated from the ligated part (Tail-PDL). (A) Head-PDL and (B) Tail-PDL portion 13 days after injury. Arrows indicate XGAL-specific staining exclusively detected in the pancreatic ducts of the ligated pancreas. Scale bars 200 μm (A, B, left panels) and 50 μm (A, B, right panels). (C) qPCR analysis of Axin2 and Lgr5 mRNA in adult pancreas following PDL. Results are represented as mean±s.e.m. of at least three independent experiments. The Hprt housekeeping gene was used to normalize for differences in RNA input. Non-parametric Mann–Whitney test was used. ***P<0.0001. P, pancreas from a sham-operated mice; H-PDL, Head-PDL (non-affected area after PDL injury); T-PDL, Tail-PDL (affected area after PDL injury). (D) Representative image of a XGAL staining on an Axin2-LacZ pancreas after PDL, sections were co-stained either for pancytokeratin (CK), a duct cell marker, or for insulin (INS), an endocrine β-cell marker. XGAL staining (reflecting Axin2 expression) was detected exclusively in the pancreatic duct compartment. (E, F) Lgr5-LacZ induction in the ductal tree upon PDL. (E) Head PDL pancreas (n=6) do not show XGAL staining, indicating that Lgr5 is not expressed in non-injured pancreas. (F) Lgr5 reporter is detected (arrows) in the Tail-PDL portion of the ligated pancreas (n=6). Scale bars 200 μm (E, F, left panels) and 30 μm (E, F, right panels).
Figure 2
Figure 2
Establishment of the pancreas organoids from adult pancreatic ducts. (A) Scheme representing the isolation method of the pancreatic ducts and the establishment of the pancreatic organoid culture. The pancreatic ducts were isolated from adult mouse pancreas after digestion, handpicked manually and embedded in matrigel. Twenty-four hours after, the pancreatic ducts closed and generated cystic structures. After several days in culture, the cystic structures started folding and budding. (B) Representative serial DIC images of a pancreatic organoid culture growing at the indicated time points. Magnifications: × 10 (days 0, 2, 4, 6, and 8) and × 4 (day 10 onwards). (C) Growth curves of pancreas cultures originated from isolated pancreatic ducts cultured as described in Materials and methods. Note that the cultures followed an exponential growth curve within each time window analysed. Graphs illustrate the number of cells counted per well at each passage from passages P1–P3 (left), P5–P7 (middle) and P10–P12 (right). The doubling time (hours) is indicated in each graph. Data represent mean±s.e.m., n=2. (D) Representative DIC images of XGAL staining in WT (left), Axin2-LacZ (middle) and Lgr5-LacZ (right) derived pancreas organoids.
Figure 3
Figure 3
Isolation and in vitro expansion of single, endocrine-depleted pancreatic epithelial cells. (A) Representative fluorescence-activated cell sorting (FACS) plot illustrating the distribution of EpCAM+ and EpCAM cells from dissociated adult mouse pancreas, following epithelial cell enrichment by magnetic beads as described in Materials and methods. (B) Representative FACS plot showing the distribution of EpCAM+ non-granulated TSQ epithelial cells and EpCAM+ granulated TSQ+ endocrine cells. (C) EpCAM+TSQ+ and EpCAM+TSQ sorted fractions were cytocentrifuged and immunostained (red) for Synaptophysin (SYP), Amylase (AMY) and pancytokeratin (CK); nuclei were counterstained with Hoechst 33342 (blue). Magnification: × 40. (D) Representative FACS analysis purity of sorted EpCAM+TSQ cells indicating that this population is isolated with high purity (>99.6%). (E) EpCAM+TSQ-sorted single cells were assessed for their growth potential in 3D expansion culture conditions: this population gave rise to organoids that could be expanded for many passages (>5 months). (F) EpCAM+TSQ+-sorted single cells were assessed for their growth potential under the same conditions: endocrine TSQ+ cells survived in culture but did not proliferate. Scale bars: 30 μm.
Figure 4
Figure 4
Clonal expansion of single Lgr5 cells derived from Lgr5-LacZ pancreatic organoids. (AE) Lgr5+ cells were sorted from Lgr5LacZ-derived pancreas organoids cultured for 20–25 days in our defined medium. Organoid formation efficiency was analysed 12 days after seeding. (A) Representative image of an FACS plot of wild-type (left) and Lgr5LacZ (right) pancreas organoids stained with Detectagene Green CMFDG (for detecting beta-galactosidase expression) and EpCAM (for selecting epithelial cells). (B) Representative image of cultures derived from 500 sorted cells from the high (Lgr5hi) or 500 sorted cells derived from the negative fraction (Lgr5neg) 12 days after seeding. (C) Graph showing the % of colony formation efficiency of the Lgr5hi and Lgr5neg fractions. (D) Representative serial DIC images showing the outgrowth of pancreatic organoids originated from a single Lgr5LacZ+cell. Magnifications: × 40 (days 1–2), × 20 (day 7), × 10 (days 12–20), × 4 (2 months). (E) Representative DIC image of XGAL staining in a 12-day-old clonal culture derived from Lgr5hi fraction. Magnification: × 10.
Figure 5
Figure 5
Characterization of in vitro expanded organoids from single cells. Pancreatic organoids cultured in our defined medium show a ductal-like phenotype. FACS-sorted epithelial cells were isolated as shown in Figures 3 and 4, plated in matrigel and cultured for 7–9 passages before being processed for RNA and immunohistochemistry analysis. (A) Organoids were stained with anti-pancytokeratin (CK), anti-PDX1, anti-mucin 1 (MUC1), anti-SOX9, anti-cytokeratin19 (CK19) and anti-MIC1-1C3 that revealed their duct-like phenotype. Cells were proliferating, as illustrated by anti-Ki67 and Edu immunostaining. Scale bars: 35 μm. (B) Hierarchical clustering analysis of genes differentially expressed among pancreatic organoid cultures, duct, acinar and islet pancreatic lineages. Unsupervised hierarchical clustering analysis shows that the pancreas organoid arrays cluster with the ductal array while the acinar and islet profiles clustered in a separate tree. (C) Heat map of two independent clonal pancreas organoid cultures performed after subtracting pancreas tissue expression levels. Representative organoid-, duct-, endocrine- and exocrine-specific genes are listed on the right. Red, upregulated; green, downregulated. (D, E) Gene set enrichment analysis (GSEA) revealed that pancreas organoid cultures express a significant amount of genes contained in signatures of adult duct cells and intestinal stem cells (Muñoz et al, 2012) (D), while they were not enriched in gene sets representing embryonic pancreas at E14.5 or E17.5 (Juhl et al, 2008) (E). (F) Quantitative PCR showing relative fold changes of Pdx1, Sox9, Lgr5, Amy2 and Ins mRNA levels in partial duct ligated pancreas (CTRL) and cultured organoids at early (EP, passages 2–3) and late passages (LP, passages 7–9). Cyclophillin A was used to normalize for RNA input. Data represent mean±s.e.m. (n=2, independent cultures).
Figure 6
Figure 6
In vitro expanded organoids from single epithelial cells give rise to endocrine and duct cells when grafted in vivo in a developing pancreas. (AF) Pancreas organoid cultures were derived from CAGeGFP+ mice or ECadCFP+ mice as described in Figure 3 and Supplementary Figure S3. The cultures were clonally expanded in vitro for 4–6 passages before dissociation into single cells. Dissociated eGFP+ or ECadCFP+ cells were re-aggregated with WT embryonic E13 mouse (B, C) or E14 rat (D, E) pancreas. The re-aggregates were kept on a filter membrane O/N and then grafted under the kidney capsule of nude mice. The grafts were harvested and analysed 2–3 weeks after. The re-aggregates consistently grew and gave rise to pancreatic tissue, as illustrated in Supplementary Figure S7A. (A) Schematic representation of the pancreatic morphogenetic assay. (B) Representative confocal microscopy image showing incorporation of eGFP+ cells (green) into pancytokeratin+ (CK, red) pancreatic duct structures; these eGFP+ cells also express low levels of PDX1 (blue). Other eGFP+ cells (white arrow) aggregated in islet-like structures near the ducts, downregulated CK and expressed high levels of PDX1 (blue). Scale bar: 35 μm. (C) Confocal microscopy demonstrates that cultured eGFP+ (green) cells differentiate into beta cells and express both synaptophysin (SYP, red) and insulin (INS, blue). Scale bar: 20 μm. (D) Confocal microscopy image illustrating mouse Insulin+ Cpeptide+ (INS+Cppt+) cells derived from ECadCFP+-grafted cells. Note that the INS+Cppt+ cells are incorporated into an embryonic rat pancreas, where rat INS+ cells are negative for mouse-specific Cppt staining (dotted line). Scale bar: 30 μm. (E) High magnification of an ECad+INS+Cppt+-grafted cell (D) that displays CFP membrane localization and cytoplasmic staining for INS and mouse Cppt. Scale bar: 20 μm. (F) Histogram showing the average quantification of differentiation of eGFP+ cells engrafted into each re-aggregate under the kidney capsule. Endocrine (SYP+), Insulin (INS+), duct cells (CK+); others: cells expressing neither duct nor endocrine markers. Average number/graft ±s.e.m. n=11 grafts from six independent cultures.
Figure 7
Figure 7
In vitro expanded organoids give rise to Glucagon (GCG) and Somatostatin (SST) mono-hormonal cells in vivo. Pancreas organoid cultures derived from sorted eGFP+ cells and expanded for at least 2 months in culture were grafted as described in Figure 6. Two weeks after transplantation, the kidney grafts were harvested and the grafted eGFP+ cells were evaluated for the expression of glucagon (GCG) and Somatostatin (SST). (A, B) Representative images illustrating that eGFP+ cells (green) differentiate towards GCG+ (A) or SST+ (B) cells in vivo. Note that both Gcg+ and SST+ cells do not express INS (insulin, blue), indicating that the organoid-derived eGFP+ cells have fully differentiated into mono-hormonal cells in vivo. Scale bars=20 μm.

References

    1. Barker N, Huch M, Kujala P, van de Wetering M, Snippert HJ, van Es JH, Sato T, Stange DE, Begthel H, van den Born M, Danenberg E, van den Brink S, Korving J, Abo A, Peters PJ, Wright N, Poulsom R, Clevers H (2010) Lgr5(+ve) stem cells drive self-renewal in the stomach and build long-lived gastric units in vitro. Cell Stem Cell 6: 25–36 - PubMed
    1. Barker N, van Es JH, Kuipers J, Kujala P, van den Born M, Cozijnsen M, Haegebarth A, Korving J, Begthel H, Peters PJ, Clevers H (2007) Identification of stem cells in small intestine and colon by marker gene Lgr5. Nature 449: 1003–1007 - PubMed
    1. Bhushan A, Itoh N, Kato S, Thiery JP, Czernichow P, Bellusci S, Scharfmann R (2001) Fgf10 is essential for maintaining the proliferative capacity of epithelial progenitor cells during early pancreatic organogenesis. Development 128: 5109–5117 - PubMed
    1. Blaine SA, Ray KC, Anunobi R, Gannon MA, Washington MK, Means AL (2010) Adult pancreatic acinar cells give rise to ducts but not endocrine cells in response to growth factor signaling. Development 137: 2289–2296 - PMC - PubMed
    1. Blaydon DC, Ishii Y, O'Toole EA, Unsworth HC, Teh MT, Ruschendorf F, Sinclair C, Hopsu-Havu VK, Tidman N, Moss C, Watson R, de Berker D, Wajid M, Christiano AM, Kelsell DP (2006) The gene encoding R-spondin 4 (RSPO4), a secreted protein implicated in Wnt signaling, is mutated in inherited anonychia. Nat Genet 38: 1245–1247 - PubMed

Publication types

MeSH terms