. 2013:4:2467.
doi: 10.1038/ncomms3467.

Non-Darwinian dynamics in therapy-induced cancer drug resistance

Affiliations

Non-Darwinian dynamics in therapy-induced cancer drug resistance

Angela Oliveira Pisco et al. Nat Commun. 2013.

Abstract

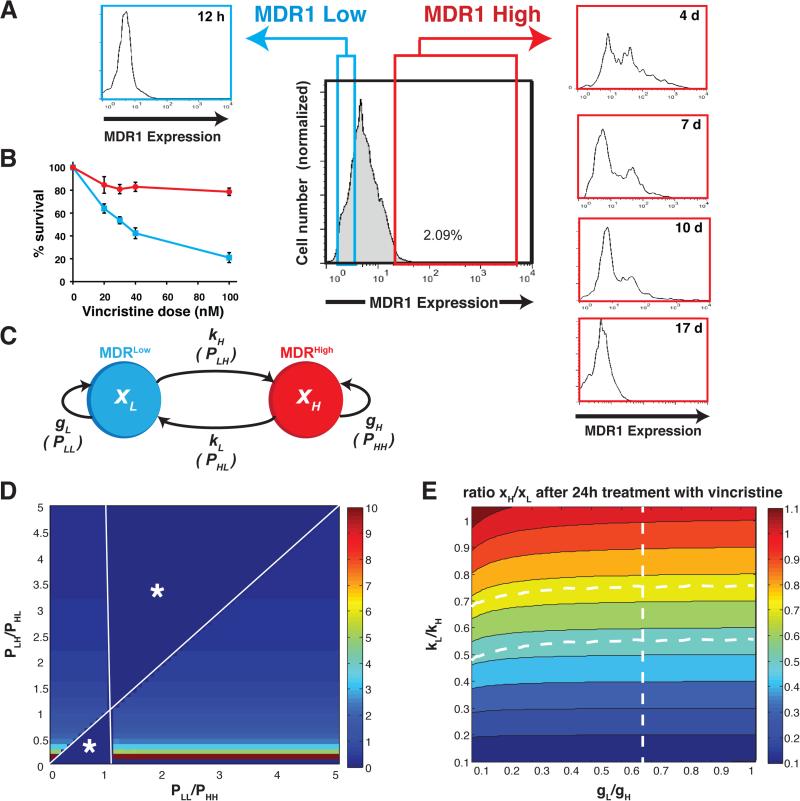
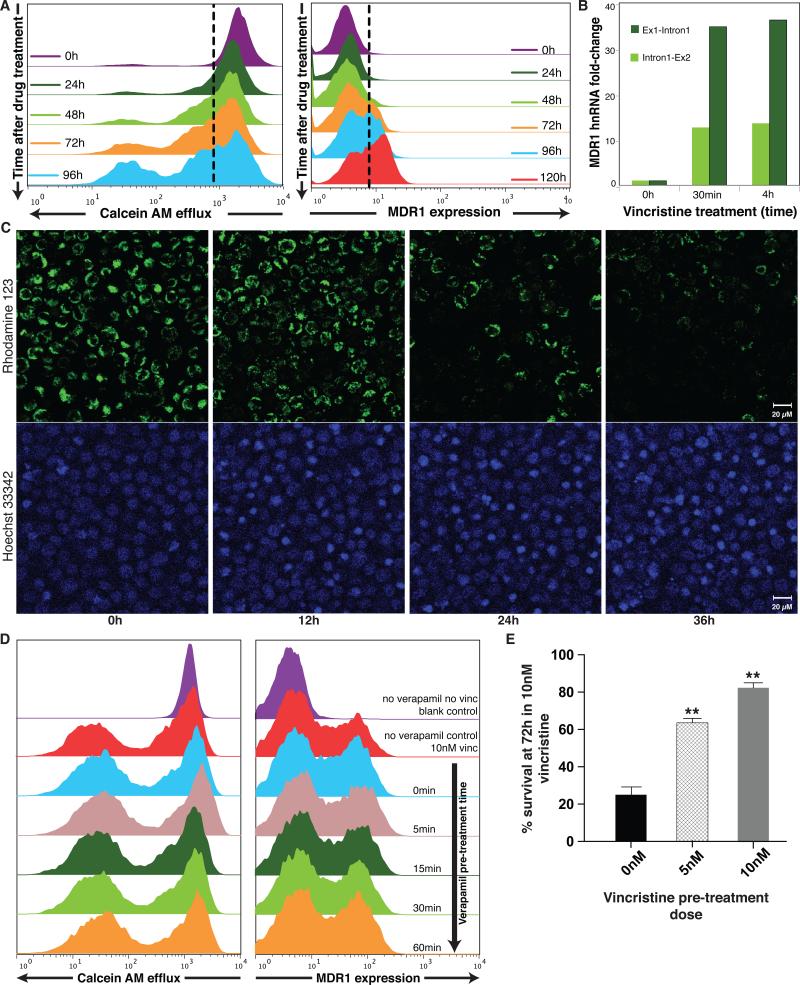
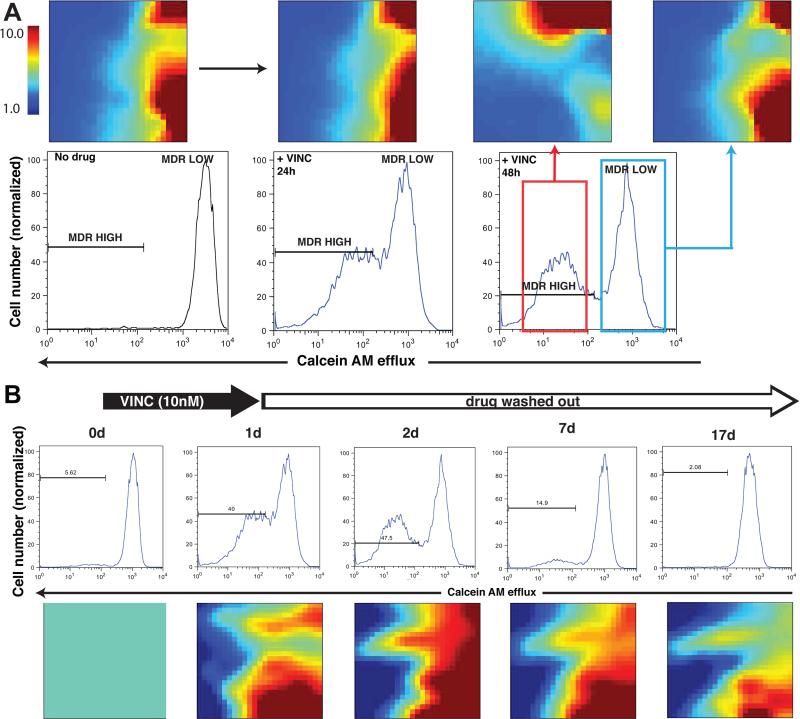
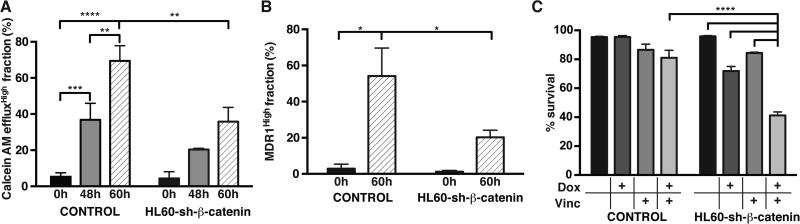
The development of drug resistance, the prime cause of failure in cancer therapy, is commonly explained by the selection of resistant mutant cancer cells. However, dynamic non-genetic heterogeneity of clonal cell populations continuously produces metastable phenotypic variants (persisters), some of which represent stem-like states that confer resistance. Even without genetic mutations, Darwinian selection can expand these resistant variants, which would explain the invariably rapid emergence of stem-like resistant cells. Here, by using quantitative measurements and modelling, we show that appearance of multidrug resistance in HL60 leukemic cells following treatment with vincristine is not explained by Darwinian selection but by Lamarckian induction. Single-cell longitudinal monitoring confirms the induction of multidrug resistance in individual cells. Associated transcriptome changes indicate a lasting stress response consistent with a drug-induced switch between high-dimensional cancer attractors. Resistance induction correlates with Wnt pathway upregulation and is suppressed by β-catenin knockdown, revealing a new opportunity for early therapeutic intervention against the development of drug resistance.


Figures

Figure 1
Figure 1. Dynamical heterogeneity of MDR1 expression within a clonal population of HL60 cells
(A) A distinct subpopulation of 1-2% of the cells of a clonally derived HL60 cell population consistently expresses high levels of MDR1 on the cell surface in the absence of drugs exposure. The MDR1High (red) and MDR1Low sub-populations (blue) differ in sensitivity to vincristine after 48h (B) Measurements of population dynamics and effective growth were obtained in three different laboratories using different culture of HL60 cells and representative results are shown. Error bar, standard deviation of one representative experiment with (n=2) biological replicates (C) Scheme of the state transition model for distinguishing between drug-induced shifts in state transition rates (cell-individual switch to the MDR phenotype) versus drug-induced growth rate differences (selection of the MDR phenotype) x, population fraction of cells in the respective state indicated by the index: H, MDRHigh (=effluxHigh) and L, MDRLow (=effluxLow). k, kinetic rate constant for the first-order state transition represented by the arrows. P state transition probability used in the Markov model. (D) Results of the steady-state Markov model. The state transition and “self-renewal” probabilities required to reach the steady state, shown as heat map with colors indicating the steady-state ratio xH/xL (color bar) as a function of the ratios of the Markov model probabilities P (see METHODS). Change in ratio of transition probabilities PLH/PHL (vertical axis) visibly affects xH/xL while change in the ratio PLL/PHH does not result in significant change of xH/xL. Undefined regions are marked by *. (E) Results of the non-equilibrium ODE model. Color map represents the parameter space indicating which combination of the two sets of parameters, the ratio of the relative growth rate constants, gL/gH (horizontal axis), and the ratio of the state transition rate constants, kL/kH (vertical axis), causes which population fraction xH/xL (color map) 24h after addition of the VINC.
Figure 2
Figure 2. Chemotherapy induces expression of the MDR1 protein and the MDR phenotype in HL60 cell population
(A) Flow cytometry measurements of surface MDR1 (immunostaining) and cell efflux capacity (fluorescent dye ejection) at the population level reveal the kinetics for the appearance of the MDR1High and the MDRHigh/effluxHigh subpopulation following vincristine treatment. (B) Quantitative (real-time) RT-PCR (qPCR) uisng primers targeting the first two exon-intron junctions of MDR1 to measure hnRNA as marker of ongoing transcription. Bar height indicate average (n = 2) of one experiment representative of two independent experiments. Standard deviations of all shown qPCR Ct-values were < 0.7 (C) Cell-individual induction of the MDR phenotype by vincristine. Cells loaded with the fluorescent dye Rhodamine123 (green) as marker of efflux capacity and stained with a DNA dye (Hoechst 33342, blue) as cell indicator and to monitor cell death, were treated with VINC (10nM) time t = 0h and followed by video microscopy under incubator conditions for 36 h. Scale bar = 20μm. (Supplementary Movies 1 and 2 for longitudinal tracking of the individual cells and Supplementary Fig. S8). Snapshots at the indicated times are shown. Disappearance of the green fluorescent dye in the viable cells indicates cell autonomous induction of the MDR phenotype. Nuclear condensation in the Hoechst 33342 stain reveals apoptotic cells. As dying cells will eventually release the dye, we quantified only live cells for dye elimination. After 48h monitoring of a typical time-course, 63 % of the live cells treated with VINC exhibited elimination of the dye, representing the switch to the effluxHigh phenotype compared to 16 % of untreated cells (n=80 cells counted). (D) Saturating doses of verapamil, an inhibitor of MDR1-mediated transport, given at varying times prior to vincristine treatment as indicated, does not alter the induction of MDR1 after 72h of treatment with vincristine. (E) HL60 cells previously exposed for 48h to the indicated doses (5 nM, 10nM) of vincristine exhibited improved survival compared to naïve cells when challenged with 10nM vincristine for 72h. Error bar, standard deviation (n= 3), ** p< 0.01, t-test)
Figure 3
Figure 3. EffluxHigh/effluxLow subpopulations represent distinct functional cell states
(A) Globally distinct transcriptomes of untreated HL60 cells and cells treated with VINC and sorted for effluxHigh / effluxLow displayed as self-organized maps with the GEDI program . Note that effluxLow cells after drug treatment had transcriptomes distinct from that of untreated cells despite the same MDR-status. For full lists of differentially expressed genes see Supplementary Data 1. (B) Memory effect of cell state transition after transient drug treatment, indicative of a switch between attractor states. After a transient (24h) exposure to vincristine, the induced MDR phenotype returned to the baseline level after 7-10 days (top) whereas the transcriptome changes persisted until at least day 17 as shown in the GEDI maps (bottom). Here gene expression was “normalized” to the values at d0, which hence appear in green in the GEDI maps.
Figure 4
Figure 4. Inhibition of β-catenin suppresses drug-induced resistance and MDR1 expression
CalceinAM efflux (A) and MDR1 expression (B) induction in HL60 cells by vincristine (1nM vinc) at indicated times are suppressed when β-catenin is knocked-down using a lentiviral doxocycline-inducible hairpin-small-RNA construct (sh-β-catenin). This suppression of the Wnt pathway also compromised viability of the cells in the presence of low vincristine concentrations (*, **, *** and **** denote comparisons with p-value <0.05, 0.01, 0.001 and 0.0001, respectively (two-way ANOVA); error bars, standard deviation, n=3 biological replicates from one representative of three independent experiments performed in two different laboratories)

References

    1. Chabner BA, Roberts TGJ. Timeline: Chemotherapy and the war on cancer. Nat. Rev. Cancer. 2005;5:65–72. - PubMed
    1. Nakasone ES, et al. Imaging Tumor-Stroma Interactions during Chemotherapy Reveals Contributions of the Microenvironment to Resistance. Cancer Cell. 2012;21:488–503. - PMC - PubMed
    1. Sun Y, et al. Treatment-induced damage to the tumor microenvironment promotes prostate cancer therapy resistance through WNT16B. Nature Medicine. 2012;18:1359–1368. - PMC - PubMed
    1. DeNicola GM, et al. Oncogene-induced Nrf2 transcription promotes ROS detoxification and tumorigenesis. Nature. 2011;475:106–109. - PMC - PubMed
    1. Rosenzweig SA. Acquired resistance to drugs targeting receptor tyrosine kinases. Biochemical pharmacology. 2012;83:1041–1048. - PMC - PubMed

Publication types

MeSH terms